 Fastero Dev Team
"Free dashboard template" means two different things. Half the results are design kits: HTML, React or Figma layouts filled with fake numbers, for people building an app's admin screen. The other half are templates for a reporting tool, which you point at your own data. This guide is about the second kind: where to find them, how each is imported, and what the terms let you do with them.
The short answer: the main free sources of dashboard templates are Google's Data Studio Report Gallery (the tool was called Looker Studio until April 2026), Grafana's dashboard library, Power BI's sample .pbix and .pbit files, Tableau Public and Streamlit's app gallery. A template is only useful if your data has the columns it expects, so check that first. Terms differ more than most lists say: Google forbids selling or reselling gallery reports, Microsoft's samples page allows use "for your internal reference purposes", and a Grafana dashboard carries its author's licence. For a dashboard on your own database, an example with its SQL is often quicker to adapt than a template.
Fastero
Connect your database. Ask questions. Get dashboards.
Postgres, BigQuery, Snowflake, and 10+ sources — live-connected, AI-powered, no dashboard builder learning curve.
Try free →Free dashboard template galleries, side by side
| Gallery | What's in it | How you use one | What the terms allow |
|---|---|---|---|
| Data Studio Report Gallery (Google) | Featured reports, Google's own marketing templates, community reports | Open it, choose Use my own data, then Edit and share to copy it | Use and copy them with Data Studio; you "must not sell, trade, or resell" gallery reports |
| Grafana dashboards | Official and community dashboards, mostly for monitoring | Import by ID, URL or JSON, then pick a data source | The uploader keeps the rights; check each dashboard's own licence |
| Power BI samples (Microsoft) | Sample .pbix and .pbit files and Excel workbooks, refreshed in 2026 |
Open the .pbix, or import the .pbit template and point it at your data |
The samples page says "internal reference purposes"; the GitHub repository holding the files says MIT |
| Tableau Public | Millions of public visualisations | Download a workbook, if its author allows it, into Tableau Desktop Public Edition | Everything on Tableau Public is public |
| Streamlit gallery | Python apps with their source code | Fork the app to your GitHub and deploy your copy | Each repository's own licence |
| Metabase examples | A showcase of public dashboards, plus one example in every install | Duplicate inside one Metabase; moving between instances is a paid feature | Not offered as templates |
Data Studio (formerly Looker Studio)
On 16 April 2026 Google announced: "We've rebranded Looker Studio as Data Studio." The old gallery address now redirects to datastudio.google.com/gallery, so most template roundups still use the old name. The gallery has three sections: featured reports, Marketing Templates made by Google's own team, mostly for Google Ads, and a community section.
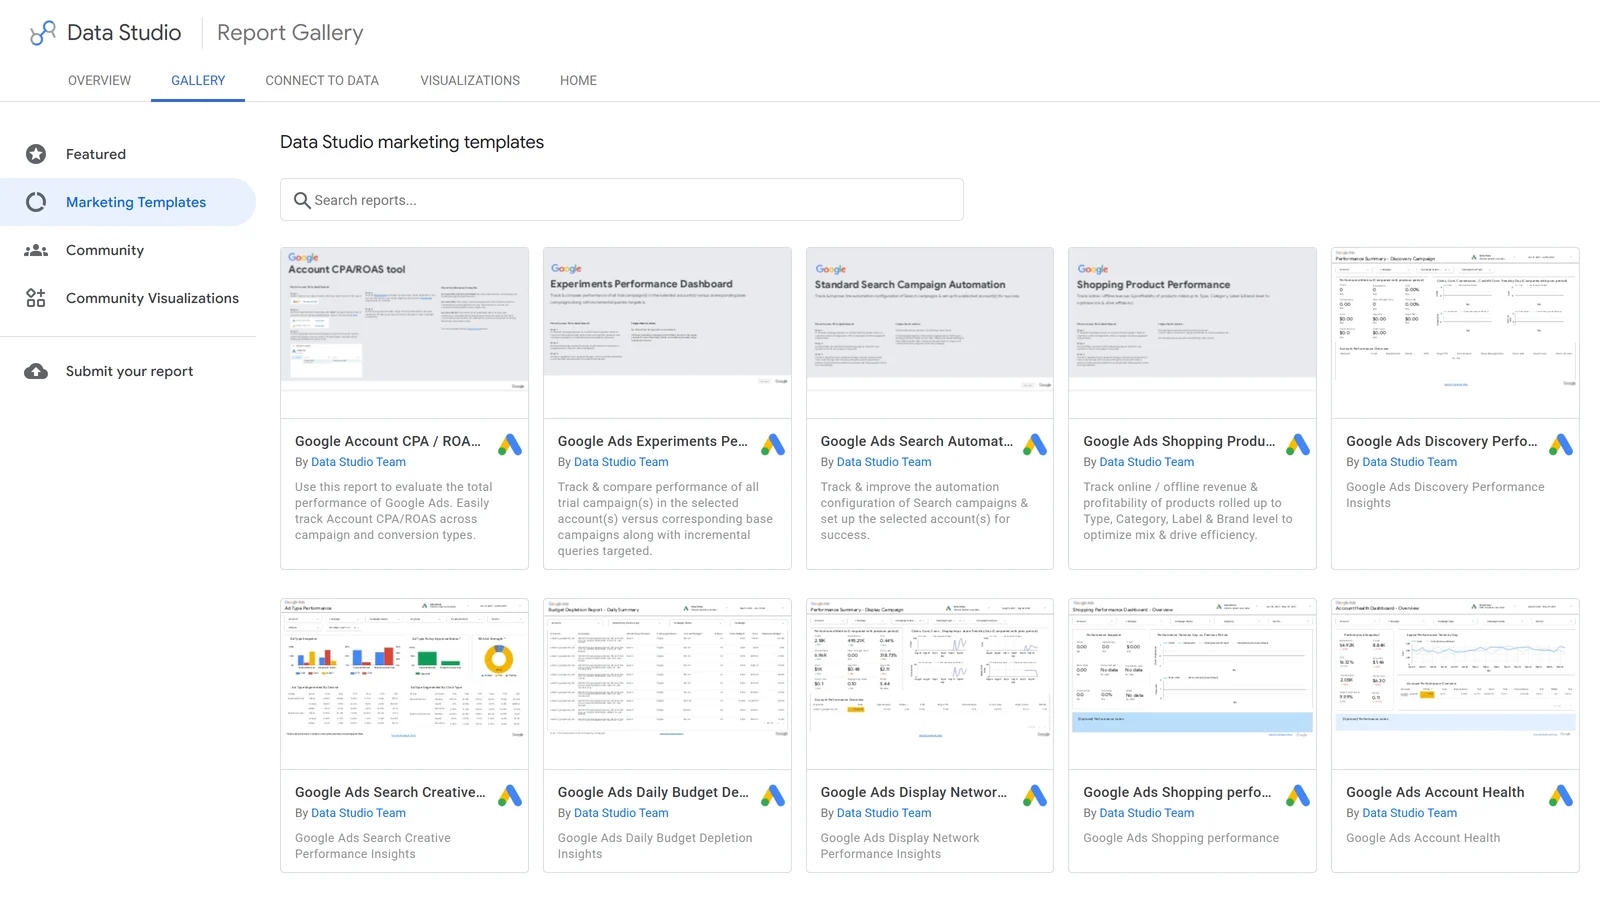
Data Studio's marketing templates on 11 November 2026, under the new name.
"A template is a special kind of report, created by appending /preview to the report's URL." To use one, "click Use my own data, then click Replace data", and "before you can modify or share the template, you must copy it to a new report by clicking Edit and share." The gallery's terms let you "browse, locate, use, copy, or download" what's there, but for Data Studio reports "you must not sell, trade, or resell such Products from the Galleries for any purpose". An agency can build a client report from one; it shouldn't sell the template itself. One snag: the gallery's own link to those terms returned a 404 when we checked; the terms live on Google Cloud's site.
Grafana
Grafana's library is the biggest source of free dashboards for monitoring: servers, Kubernetes, databases and the like. To use one, "Paste a Grafana.com dashboard URL or ID into the field provided, and click Load", or "Upload a dashboard JSON file", then "Select a data source, if required."
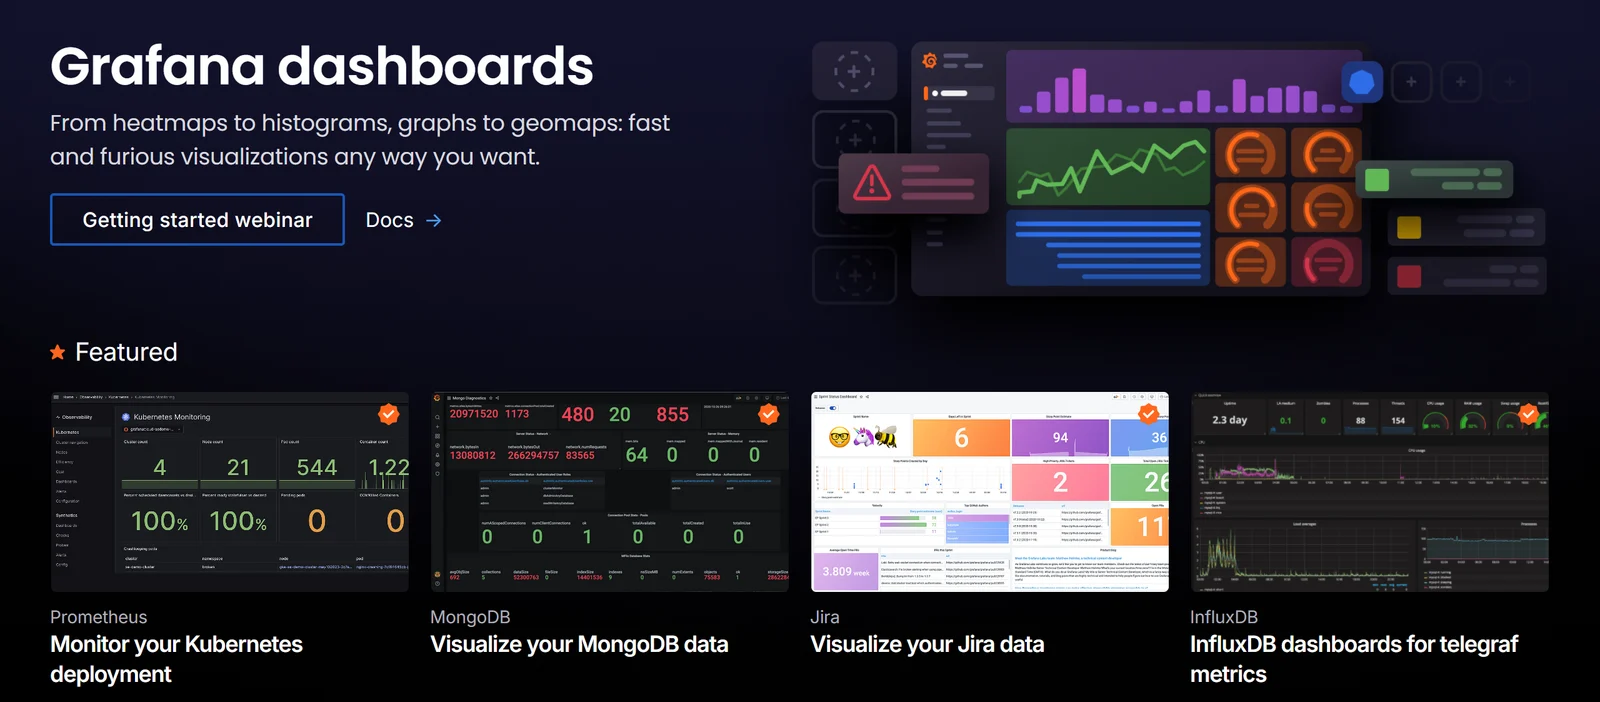
Grafana's library mixes official and community dashboards.
The library holds "official and community-built dashboards", and Grafana's terms leave the rights with whoever uploaded them: "You retain any and all rights you may have in your User Content". So check the dashboard's own repository. The most-featured one, Node Exporter Full, is Apache-2.0 licensed and was still being updated on 31 October 2026. Grafana also has built-in dashboard templates that "use sample data, which you can replace with your own data"; that feature "is currently in public preview."
Power BI
Microsoft's samples page "lists downloadable .pbix and .pbit files, Excel workbooks, and SQL sample databases", and several "were refreshed to pair modern report design with stronger semantic models" in 2026. The difference between the two file types matters: "templates don't contain any data, just the report definitions themselves". Import a template with "File > Import > Power BI template", and Power BI asks for the data it should read.
The licence is muddled. The samples page says "You can copy and use this workbook for your internal reference purposes", and some files need an attribution line, while the GitHub repository with the same files carries an MIT licence. If you'll reuse one for a client, the MIT repository is the safer source.
Tableau Public
"On Tableau Public, anyone can interact with your views, or download your workbooks or data sources", and "Workbooks and data published to your Tableau Public profile are not private". That's what makes it a template library: download a workbook whose author allows it and open it in the free Tableau Desktop Public Edition. The flip side is that anything you save there is public too, so it's no place for a client's numbers.
Streamlit
Streamlit's gallery says: "Try out these apps, browse their source code, then fork them and make them your own." Forking copies the app's repository to your GitHub account, and Community Cloud also has starter templates such as a "GDP dashboard" you can deploy in a few clicks. These are code, so they suit someone who writes Python; our eight Streamlit examples have screenshots of each running.
Metabase
Metabase's examples page is a showcase, "real life examples built by real Metabase users", not templates you can import. "Every new Metabase comes with an example dashboard, E-commerce insights", and you can duplicate a dashboard inside one Metabase, but moving one between instances needs serialization, which "is only available on Pro and Enterprise plans". Our Metabase dashboard examples show what people build with it.
How to pick a template, or skip one
A template saves the layout. It doesn't save the hard part: making your data fit. Before you import one:
- Check the columns. A Google Ads template needs a Google Ads account; a Node Exporter dashboard needs Prometheus with Node Exporter. If your table has
order_dateand the template expectsdate, every chart is empty until you map them. - Look for three to five headline numbers, each against a previous period. "A number with nothing to compare to can't be judged."
- Check which way is good. "For spend, cost per lead, run time and churn, down is good." A template that colours every rise green gets those wrong.
- Read the terms if it's for a client. Building a client report from a gallery template is usually fine; selling the template isn't.
Connect any database. Ask in plain English.
Start free →Seven example dashboards you can rebuild on your own data
If your data is in a database rather than in Google Ads or Prometheus, a template for someone else's tool may not fit at all. Fastero's example gallery takes a different approach: "Seven real dashboards built in Fastero on invented data — executive, AI agent, SaaS, cohort retention, client report, KPI and energy." "They are worked examples rather than files to download." "Every page lists what is on the dashboard, shows how its key numbers are worked out in SQL, and" gives the prompt to build the same dashboard from your data.
| Example | What it shows | Good starting point for |
|---|---|---|
| Executive dashboard | Revenue, orders, average order value and cancellations, the monthly trend, revenue by channel, country and product | A leadership team's weekly page |
| Monthly client report | Leads, cost per lead, booked jobs and revenue against last month, channels, campaigns and a written summary | Agencies and freelancers reporting to clients |
| SaaS dashboard | Weekly active users, signups, activation, the funnel, feature adoption and retention, on three tabs | Product and growth teams |
| Cohort retention dashboard | A retention heatmap by signup month, with the SQL for the table | Anyone asking "do users stay?" |
| AI agent dashboard | Runs, spend, success rate and run time per agent and model, failures and tool errors | Teams running AI agents |
| KPI dashboard | The KPI rows of five dashboards and how each number is compared | Designing a top row of numbers |
| Energy monitoring dashboard | Twelve solar sites against forecast, yield by site and hour, alerts | Operations and sensor data |
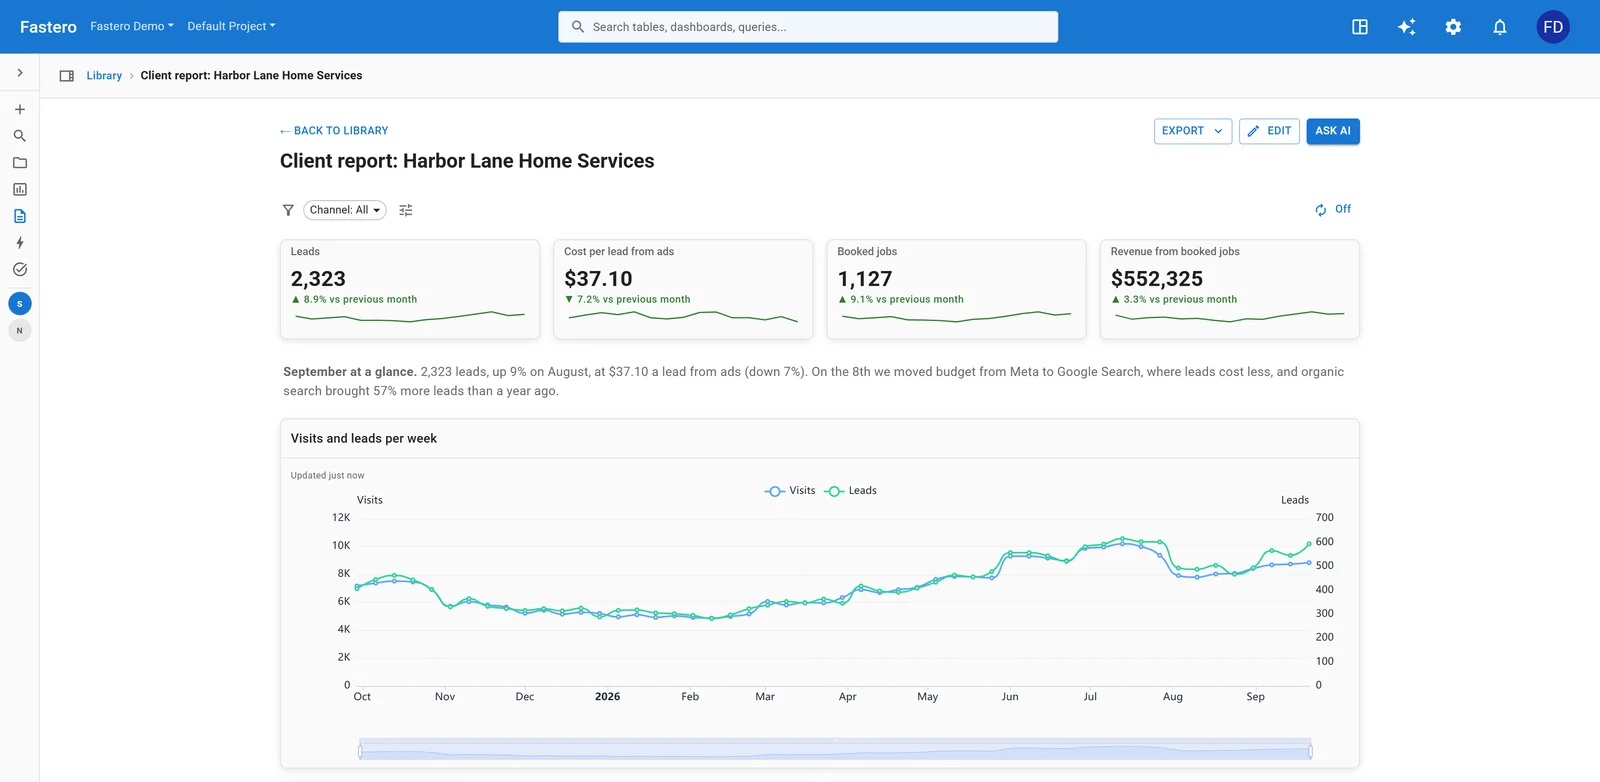
The monthly client report example, on an invented home-services business.
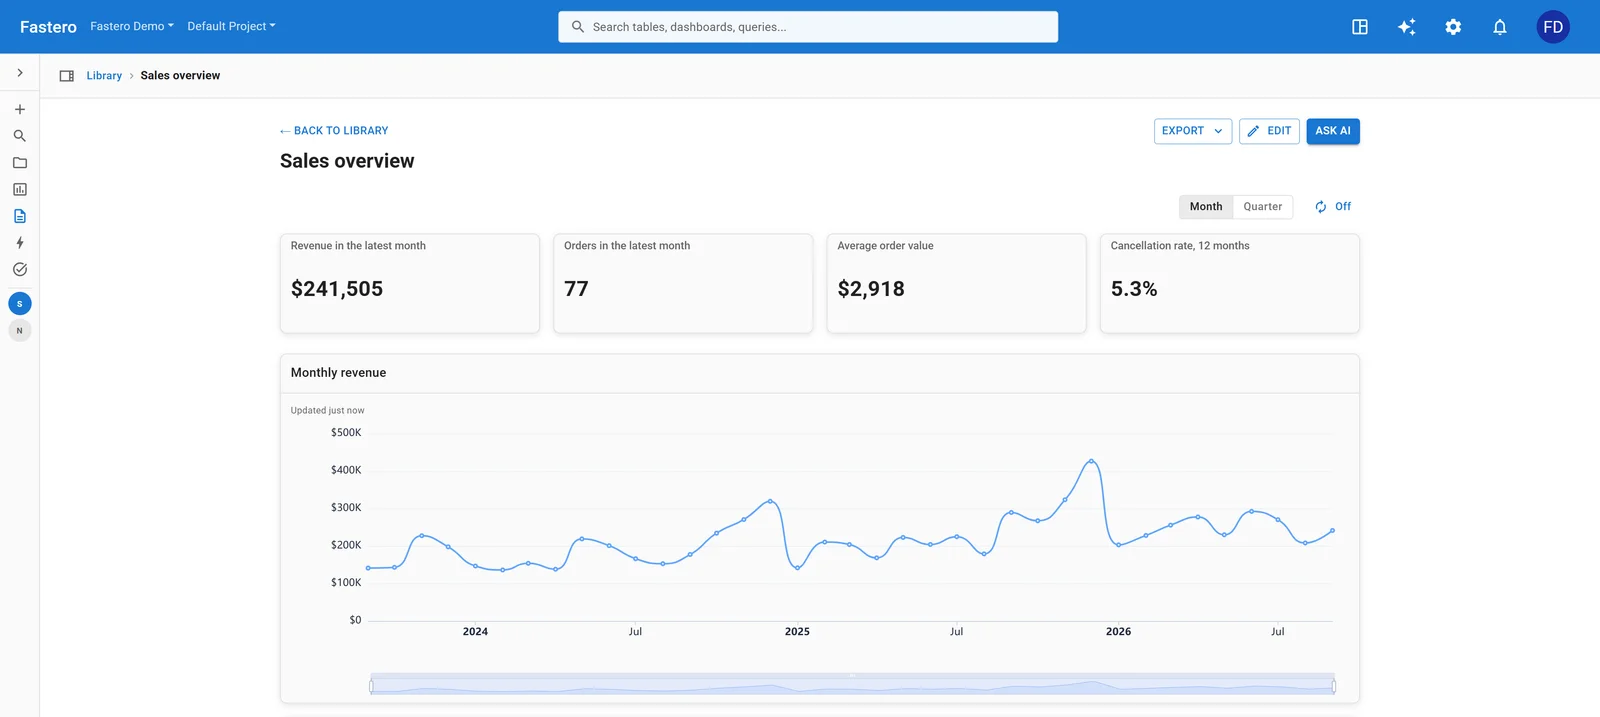
The executive dashboard example. Every number on it comes from a saved SQL query.
Each example ends with the prompt that builds it. Connect your own database in Fastero, an AI and data platform where people and AI agents work together on a team's data, paste the prompt, and the assistant builds the dashboard from your tables, with every chart a saved query you can open and check. Colleagues sign in to see it, "viewers are free", or it can arrive by email as a PDF on a schedule.
More on the best free dashboard tools, KPI dashboard examples and Power BI dashboard examples.
FAQ
Where can I find free dashboard templates?
For a reporting tool: Google's Data Studio Report Gallery, Grafana's dashboard library, Microsoft's Power BI sample files, Tableau Public and Streamlit's app gallery. For a web app's admin screen, UI kits such as AdminLTE or MUI's templates are a different thing: they contain no data connection.
Does Google Data Studio have free templates?
Yes. The Data Studio Report Gallery (Looker Studio until April 2026) has free templates, including Google Ads reports made by Google's own team. Open one, choose Use my own data, and copy it with Edit and share.
How do I use a Looker Studio template with my own data?
Open the template, click Use my own data, then Replace data and pick your source. To keep or change it, copy it to a new report with Edit and share. The charts only fill in if your data has the fields the template uses.
Can I use a free dashboard template for a client?
Usually, to build the client's report, but read the terms. Google's gallery terms forbid selling or reselling gallery reports, Microsoft's samples page limits its files to internal reference while its GitHub copy is MIT-licensed, and each Grafana dashboard carries its author's licence.
What is a .pbit file?
A Power BI template. It holds the report's layout, model and queries but no data, so opening it asks where your data is. A .pbix file is a full report with its data.
Can I download dashboards from Tableau Public?
Yes, when the author allows downloads. Open the workbook in the free Tableau Desktop Public Edition. Anything you publish to Tableau Public is public too.
Sources
Read on 11 November 2026:
- Google: Data Studio release notes, Report Gallery, marketing templates, Create a report from a template, Galleries terms of service
- Grafana: Import dashboards, template dashboards, Node Exporter Full, terms of service
- Microsoft: Power BI sample files, Power BI templates, powerbi-desktop-samples on GitHub
- Tableau: Tableau Public, Publish to Tableau Public
- Streamlit: App gallery, Fork and edit a public app, Deploy from a template
- Metabase: Examples, Dashboards, Serialization