 Fastero Dev Team
Search for Power BI dashboard examples and most results are lists of templates sold by connector companies. The best-documented examples come from Microsoft itself: 18 sample reports on realistic, invented company data, each with a page explaining what it shows, free to download, and eight of them redesigned in 2026 to show current report design.
The short answer: start with Microsoft's sample reports. The list on Microsoft Learn (updated 4 September 2026) covers sales, marketing, sales pipeline, finance, IT spend, HR, procurement and supplier quality. You can explore one in your browser with no account in the Power BI Embedded Analytics Playground; the rest are free .pbix downloads that open in Power BI Desktop, or built-in samples in the Power BI service with a free Fabric licence. The good ones follow the rules Microsoft writes down: key numbers in cards at the top left, filters (slicers) across the top, one screen per page, and detail moved to drillthrough pages and tooltips instead of more charts.
Fastero
Connect your database. Ask questions. Get dashboards.
Postgres, BigQuery, Snowflake, and 10+ sources — live-connected, AI-powered, no dashboard builder learning curve.
Try free →Where to see them
| Where | Account needed? | What you get |
|---|---|---|
| Embedded Analytics Playground → Developer sandbox → Use sample | None | The Sales and Marketing sample, live in the browser: Market Share, YTD Category and Sentiment pages, with working slicers |
| Playground showcases | None | Demo apps built on sample reports: report themes and dark mode, a custom layout, saved report views |
| Microsoft Learn sample pages | None | A written tour of each sample with Microsoft's screenshots |
| GitHub: microsoft/powerbi-desktop-samples | Download, none; opening needs Power BI Desktop (Windows) | The .pbix files, including the 2026 redesigns |
| Built-in samples in the Power BI service | A Fabric free licence | "You just need a Fabric free license to explore the sample in the Power BI service" |
A note on pictures. Most of the sample data "are the property of obviEnce, LLC", whose notice allows use "for your internal reference purposes" and asks that every visualisation carry its credit, and Microsoft's own screenshot rules exclude images with third-party content. So rather than reproduce the reports here, we link to them, and show the same kinds of dashboard as we built them on invented data in Fastero.
Sales and marketing examples
1. Sales and Marketing: the market-share overview
"The Sales and Marketing sample contains a dashboard and report for a fictitious manufacturing company named VanArsdel Ltd." Its Market Share page, the one the Playground opens, is the classic layout: two cards top left (total category volume and unit market share, each with a coloured trend arrow), a date slicer and manufacturer, product and region filters in one strip across the top, a category breakdown table with data bars, and volume over time by region below. In the Playground, picking East in the region slicer re-filters every visual on the page at once.
What to copy: the headline numbers where the eye lands first, every filter in one place, and one colour scale used throughout.
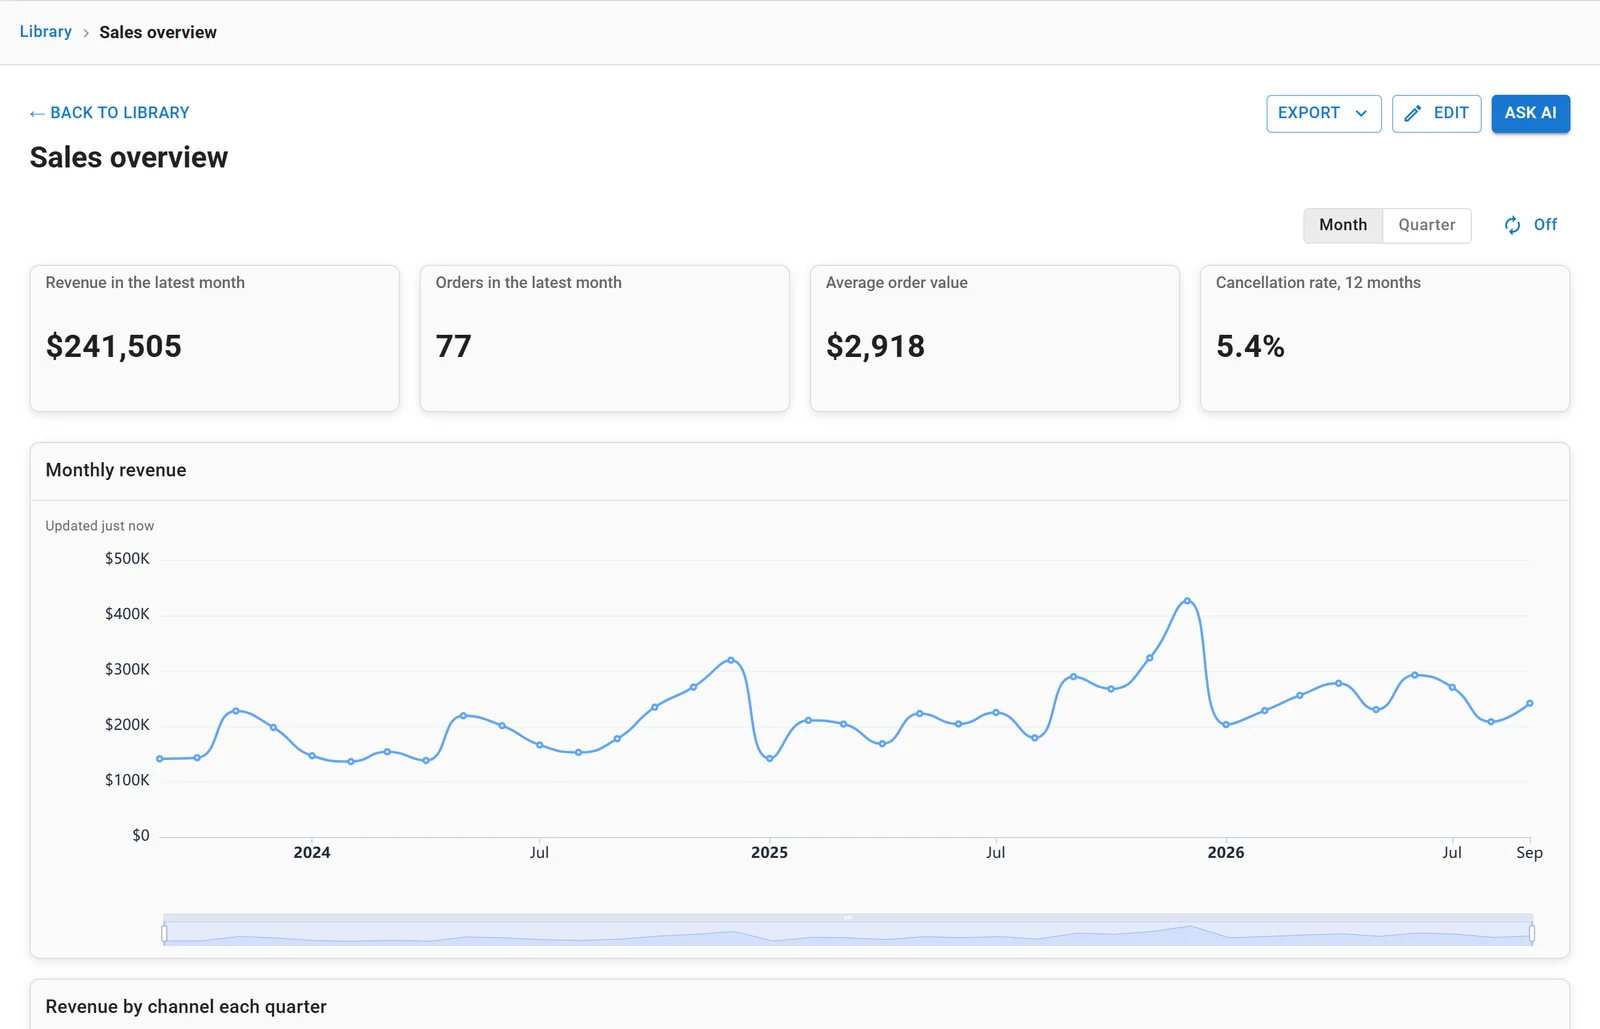
The same pattern built in Fastero on invented data: four headline numbers across the top, then the trend.
2. Sales and Marketing: competitor and regional comparison
The same sample's YTD Category page compares three manufacturers month by month with lines, adds a matrix of manufacturers by region with conditional formatting, and a map of the year-to-date variance by state. The map answers where; the lines answer when. Both line charts use the same colour for each manufacturer, which is one of Microsoft's rules: "Be consistent with the colors you use for dimension values within charts as well."
3. Sales and Marketing: customer sentiment
A third page, Sentiment, reuses the overview's grid for brand health: a sentiment score and the gap to competitors in cards, sentiment by district, and industry sentiment by month and region. Same layout, new subject, so readers learn the page once.
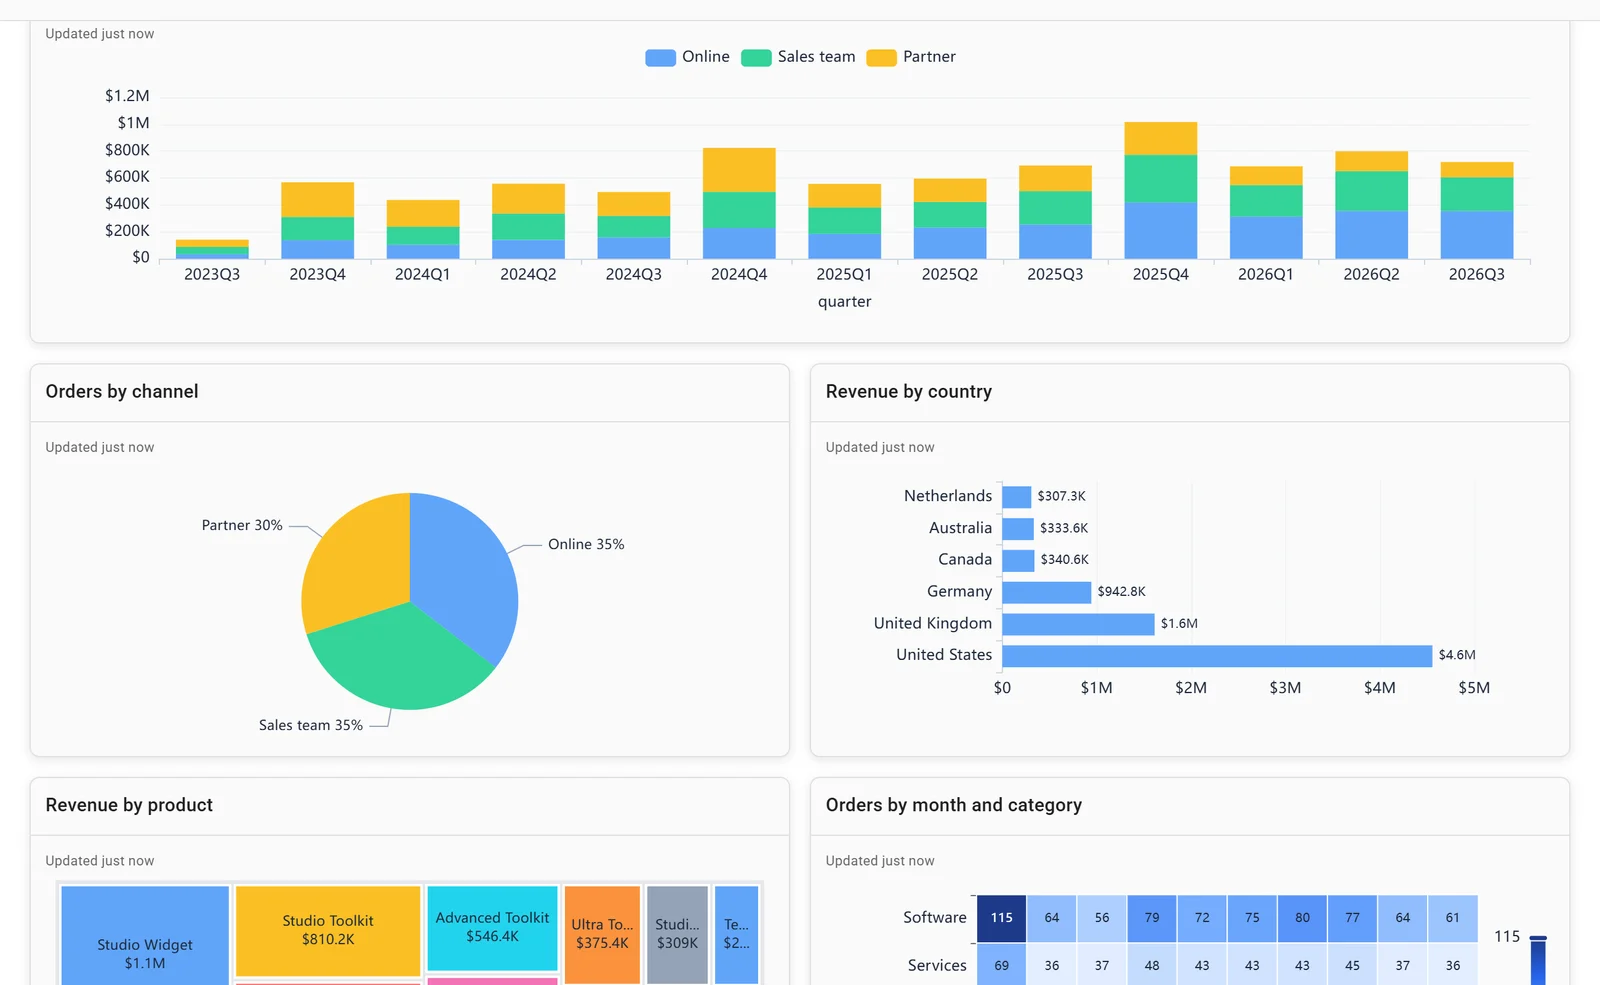
Breakdowns below the headline: by channel, country, product and month, on invented data.
4. Competitive Marketing Analysis
Same fictitious company, a different reader: "The VanArsdel Chief Marketing Officer (CMO) created this report to keep an eye on the industry and the company's market share, product volume, sales, and sentiment." It's a good model when the question is "are we winning?" rather than "how much did we sell?".
5. Retail Analysis and Store Sales
"The metrics compare this year's performance to last year's for sales, units, gross margin, variance, and new-store analysis." This year against last year is the backbone of every retail dashboard. Store Sales is the 2026 redesign of the same idea, built to work on phones.
Sales pipeline examples
6. Opportunity Analysis and Revenue Opportunities
Pipeline dashboards answer three questions: how much is in the pipeline, where is it stuck, and how much will close. In both samples, a software company with direct and partner sales channels, "The sales manager created this dashboard to track opportunities and revenue by region, deal size, and channel." The Playground's report-design showcase uses a pipeline report too, with revenue by month and opportunity status, opportunities by industry, and a combo chart for revenue and opportunity counts, to demonstrate report themes and dark mode. The 2026 Revenue Opportunities refresh "Combines a Shape Map with a report page tooltip and a combo chart to add context for pipeline analysis."
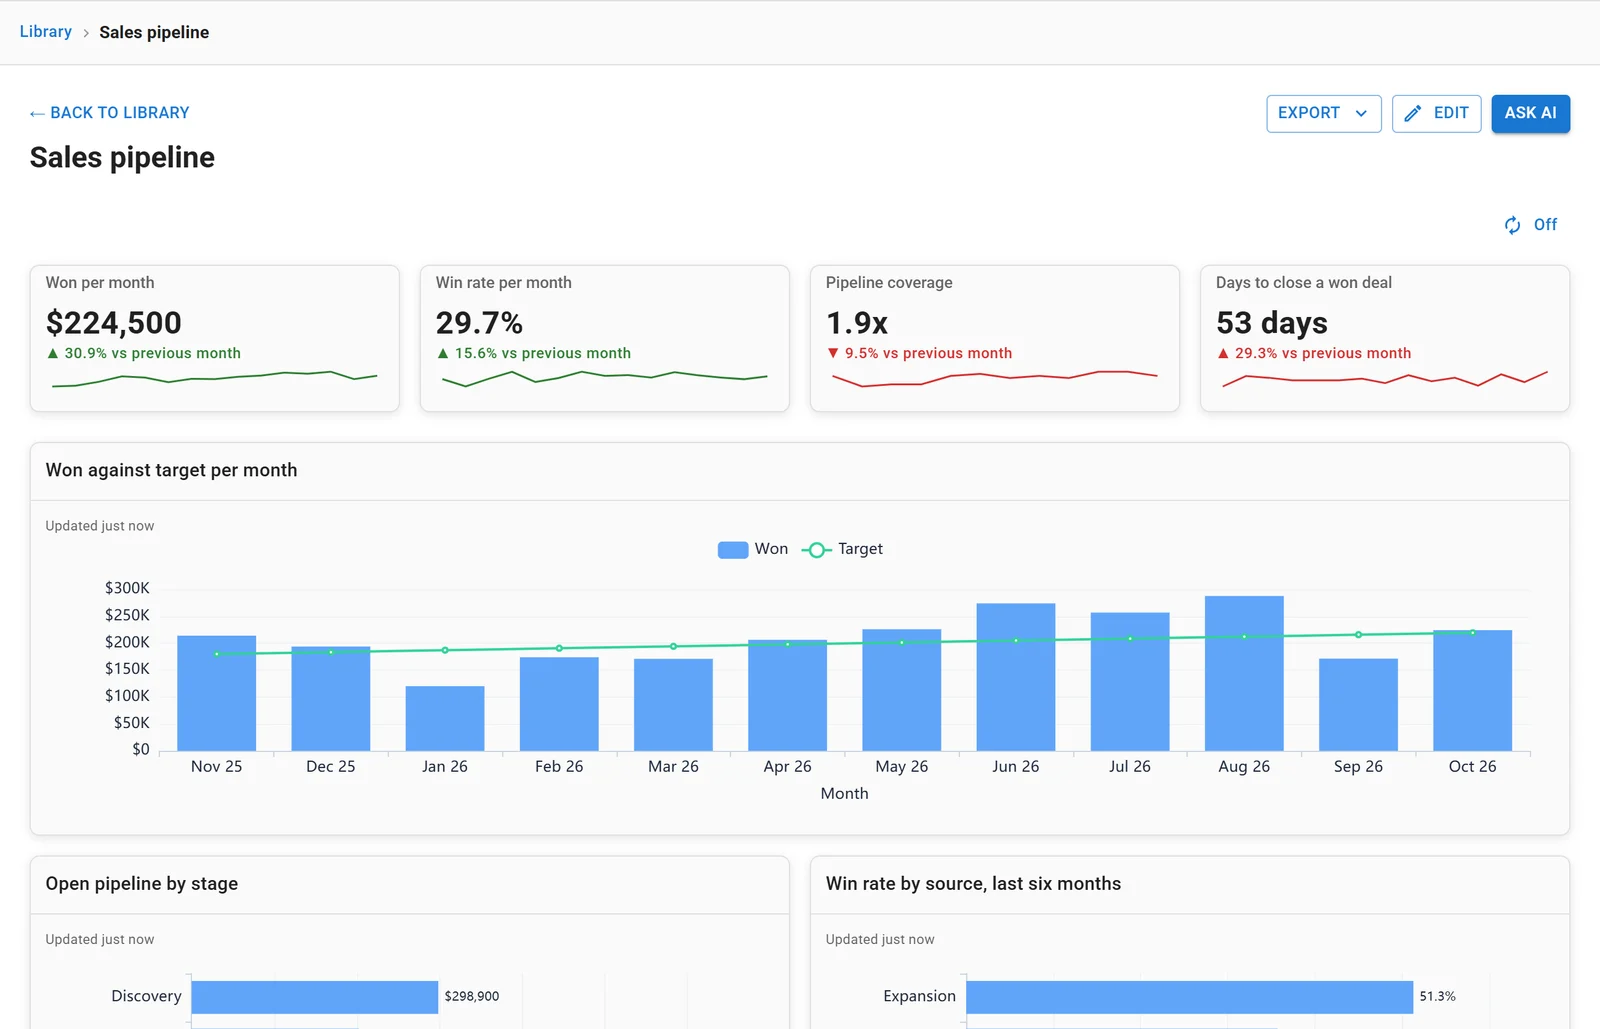
A pipeline dashboard on invented data: won against target, win rate, coverage and time to close.
Finance examples
7. Customer Profitability
"A CFO created this dashboard to see key metrics about their five business unit managers (executives), products, customers, and gross margins (GM)." The executive pattern: a few numbers per manager, with gross margin as the common thread.
8. IT Spend Analysis and Corporate Spend
IT Spend "analyzes the planned vs. actual costs of an IT department." Plan against actual, with the variance highlighted, is the core finance layout. The 2026 Corporate Spend redesign "Uses conditional formatting, a button slicer, informative card reference labels, and field parameters for a more adaptive experience."
9. The Financial sample workbook
Not a report but the simplest data to practise on: "This workbook has a table of sales and profit data sorted by market segment and country/region." Most Power BI tutorials start here.
HR examples
10. Human Resources and Employee Hiring and History
"This sample looks at new hires, active employees, and employees who have left." The 2026 Employee Hiring and History version "Uses color, line and marker styles, custom tooltip text, and conditional formatting to direct attention to key workforce trends." HR dashboards are mostly flows (in, out, net) by month and department, and these show how to keep that readable.
Operations examples
11. Supplier Quality Analysis and Procurement Analysis
Supplier Quality: "Two primary metrics are at play in this analysis: total number of defects and the total downtime that these defects caused." Procurement analyses "a manufacturing company's spending on vendors by category and location." Both are good models for dashboards built around a cost and its causes.
The interactivity example
12. Sales and Returns
If you open only one sample, open this one. Microsoft says it "showcases best practices in report design, storytelling, and user experience" and "Demonstrates features like buttons, drillthrough, conditional formatting, what-if, and customized tooltips." Drillthrough is the feature to study: right-click a product and "The drillthrough page opens, filtered to show only data for the selected item", which is how a page stays simple without losing the detail.
Two more worth a look: Artificial Intelligence, for Power BI's key influencers and decomposition tree visuals, and Regional Sales.
Connect any database. Ask in plain English.
Start free →What the good examples have in common
Microsoft's design guidance is unusually concrete. The rules the samples follow:
- One screen. "Because dashboards are meant to show important information at a glance, having all the tiles on one screen is best." For reports: "Each report page should tell a story at a glance."
- Top left first. "Put the highest level of data at the top left corner and show more detail as you move in the direction the audience uses for reading (left-to-right, top-to-bottom)."
- Fewer visuals. "It's highly recommended you limit the number of visuals on a particular report page to only what is necessary." And: "Drillthrough pages and report page tooltips are great ways to provide additional details without jamming more visuals onto the page."
- No decoration. "Avoid variety for the sake of variety." "Remove unnecessary data labels from your charts."
- Readable numbers. "It's easier for humans to read the value "3.4 million" than "3,400,000.""
- The right chart. "Pie charts are best when there are fewer than eight categories." "Gauge charts are great for displaying the current status in the context of a goal."
- Consistent time. "Don't mix levels of precision and time."
- Phones. "Position the most important visuals at the top of the page" and "Don't use fonts smaller than nine points."
The 2026 refresh also replaced "visuals that are no longer recommended, including Bing Maps and the Q&A visual", and Microsoft notes that "Bing Maps for Power BI is being deprecated", so copy the redesigned samples rather than older screenshots of them.
Dashboard or report?
In Power BI the words mean different things. "A Power BI dashboard is a single page, often called a canvas, that tells a story through visualizations": tiles pinned from one or more reports. A report has pages, filters and interactions. "Dashboards are a feature of the Power BI service. They're not available in Power BI Desktop." Most "dashboard examples" online, Microsoft's samples included, are reports, and that's usually what people mean.
What sharing costs
Building in Power BI Desktop is free. Sharing is where the licences come in: on Microsoft's US pricing page, Power BI Pro is $14.00 and Premium Per User $24.00 per user a month, paid yearly, and the free tier says "Upgrade to Pro or Premium to share reports". To create dashboards in workspaces, "You need a Power BI Pro or Premium Per User (PPU) license".
That's the main reason teams look at alternatives for simple dashboards. In Fastero, dashboards come from SQL on your own database, or Claude builds them through Fastero's connector, and viewers are free: editors pay, colleagues who only read don't. Our Power BI alternatives roundup compares the options.
FAQ
Where can I find Power BI dashboard examples for free?
Microsoft publishes 18 sample reports on Microsoft Learn, free to download as .pbix files from its GitHub repository. One can be explored in a browser with no account in the Power BI Embedded Analytics Playground.
Can I view Power BI sample reports without an account?
Yes, in the Embedded Analytics Playground: open the Developer sandbox and choose Use sample. Otherwise you need Power BI Desktop on Windows, or a free Fabric licence for the built-in samples in the Power BI service.
What's the difference between a Power BI dashboard and a report?
A dashboard is one page of tiles pinned from reports, available only in the Power BI service. A report has several pages, with filters and interactions, and can be built in Power BI Desktop.
What makes a good Power BI dashboard?
By Microsoft's own guidance: the most important numbers top left, everything on one screen, only the visuals you need, detail in drillthrough pages and tooltips, consistent colours, and readable numbers.
Is Power BI free?
Power BI Desktop is free for building reports. Sharing needs Power BI Pro at $14 or Premium Per User at $24 per user a month, paid yearly, on Microsoft's US pricing.
Can I use Microsoft's sample data in my own work?
Check the notice first. Most sample data belongs to obviEnce, which allows copying "for your internal reference purposes" and requires its copyright notice on visualisations. The GitHub repository's code is MIT-licensed, but the data notice is separate.
Related reading:
- Best Power BI alternatives
- Power BI MCP server
- Power BI vs Metabase
- Metabase dashboard examples
- Grafana dashboard examples
- KPI dashboard examples
Sources: Microsoft: sample reports overview (updated 4 September 2026), samples for Sales and Marketing, Retail Analysis, Customer Profitability, IT Spend, Financial, Human Resources, Supplier Quality, Procurement and Sales and Returns; dashboard design tips, report design tips, optimization guide, mobile reports, drillthrough, dashboards, pricing, screenshot permissions, Embedded Analytics Playground, desktop samples on GitHub. Checked 8 November 2026.
Try Fastero free — dashboards from SQL on your own database, or built by Claude, with free viewers. No credit card required.