For people and agents

Put your agents to work on your data.

Claude Code, Cursor and Fastero's own agent run SQL, build dashboards, deploy Streamlit apps and send the Monday report. Your team signs in and sees the work.

claude — ~/acme-analytics

>

Works with the agents and apps you already use

  • Claude Code
  • claude.ai
  • Cursor
  • Codex
  • VS Code
  • Slack

From first connection to the Monday report

The whole loop, in the order you'd do it. Every step works from Claude or from Fastero.

01 — Connect Claude

One line in Claude Code. One connector in claude.ai.

The key acts as you, in one workspace, with your role. Revoke it and it's over.

See the install line →
zsh

$ claude mcp add --scope user --transport http fastero https://api.fastero.com/api/v1/mcp --header "Authorization: Bearer fst_pat_…"

Added HTTP MCP server fastero with URL: https://api.fastero.com/api/v1/mcp to user config

$ claude

✻ Welcome to Claude Code

> /mcp

fastero · ✔ connected

claude.ai · Settings · Connectors

Fastero

Custom connector
Connected

02 — Connect your data

Your database, once.

Postgres, BigQuery, Snowflake, MySQL, Google Sheets or a file, and the tools you already run: Stripe, HubSpot, Salesforce, QuickBooks, Xero. Enter the password in Fastero and it stays there: your agent sees the data, never the password.

All integrations →
app.fastero.com / Data sources
FasteroData sources

Connect a database

Postgres
BigQuery
Snowflake
MySQL
Sheets
CSV
Hostdb.acme.internal
Port5432
Databaseanalytics
Userreadonly
Test connection✓ Connected · 42 tables
claude — ~/acme-analytics

⏺ fastero - fastero_list_connections (MCP)

  ⎿  analytics (postgres)

⏺ Connected to analytics. I can query it now; the password stays in Fastero.

03 — Ask anything

Every answer shows its work.

Ask in Claude, Cursor or Fastero. The chart appears right in the conversation, and every number links to the query that made it.

Explore asking →
claude — ~/acme-analytics

> Which channels brought the most signups last month?

⏺ fastero - fastero_run_sql (MCP)(sql: "select channel, count(*)…")

  ⎿  4 rows

⏺ Organic search led: 412 signups. Paid 268, referral 141, direct 96.

✻ Charting… (esc to interrupt)

Signups by channel

Which channels brought the most signups last month?

Thought for 12s ›

FasteroRun SQLFasteroShow chart

Signups by channel, October

Organic search led with 412 signups, almost double paid ads. Referrals grew fastest, up 31% on September.

Signups by channel · OctoberFastero
Organic412Paid268Referral141Direct96
Show SQLOpen in Fastero ↗Save to a dashboard
Reply to Claude…
app.fastero.com / Ask AI
FasteroAsk AI

Which channels brought the most signups last month?

Organic search, with 412 of 917 signups.

View SQLPin to dashboard

04 — Build the dashboard

One more sentence and it's a dashboard.

Each chart starts as a question. Your agent builds it on live data; you or your team can change it after.

See seven real dashboards →
Acme / Signups

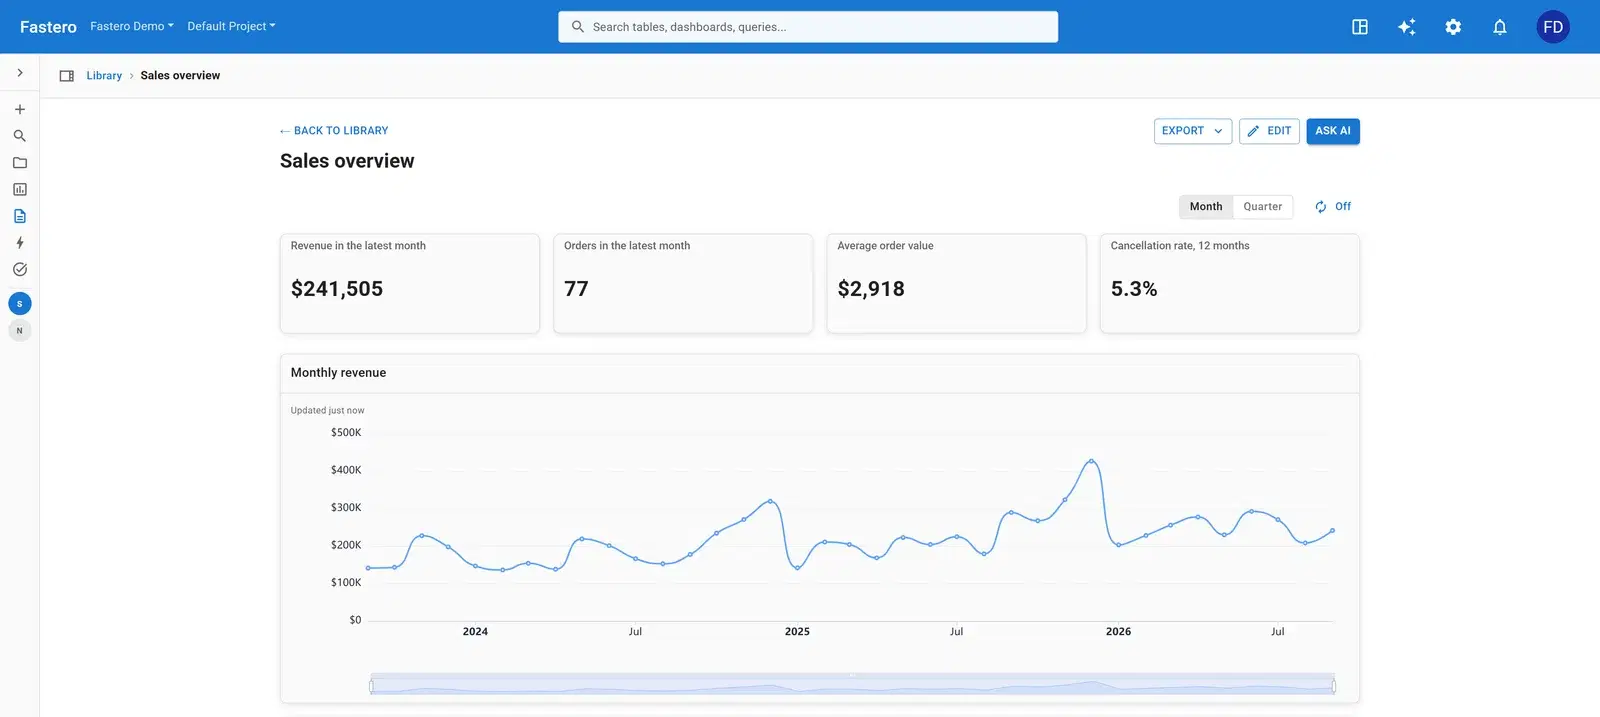
1,284

▲ 9% vs last week

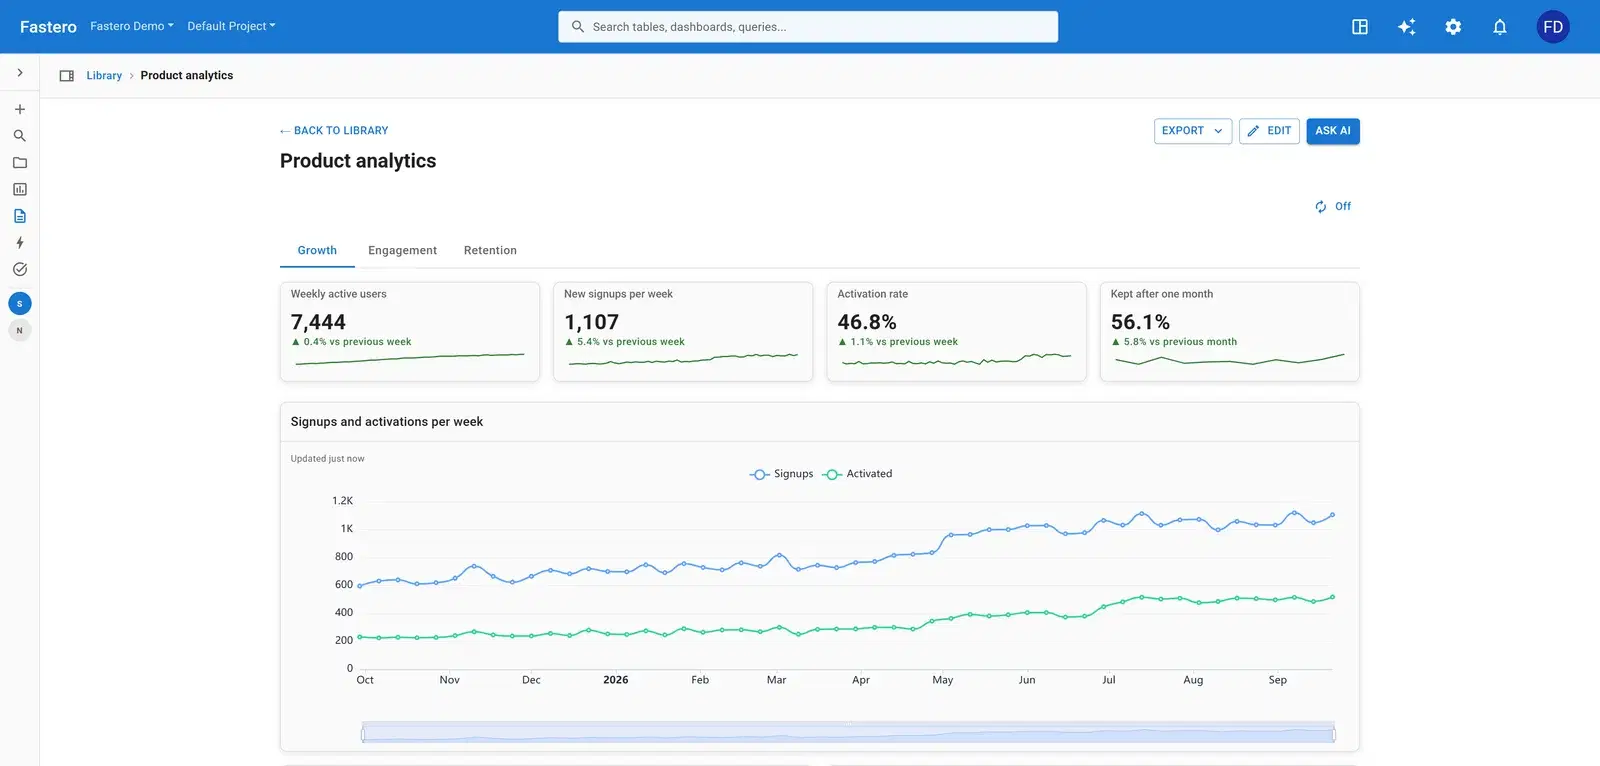
Track signups week by week
Acme / Retention

38%

kept after one month

How many users stay a month?
Acme / AI agents

$0.21

average cost per run

research-agent$0.42support-bot$0.18sql-helper$0.09
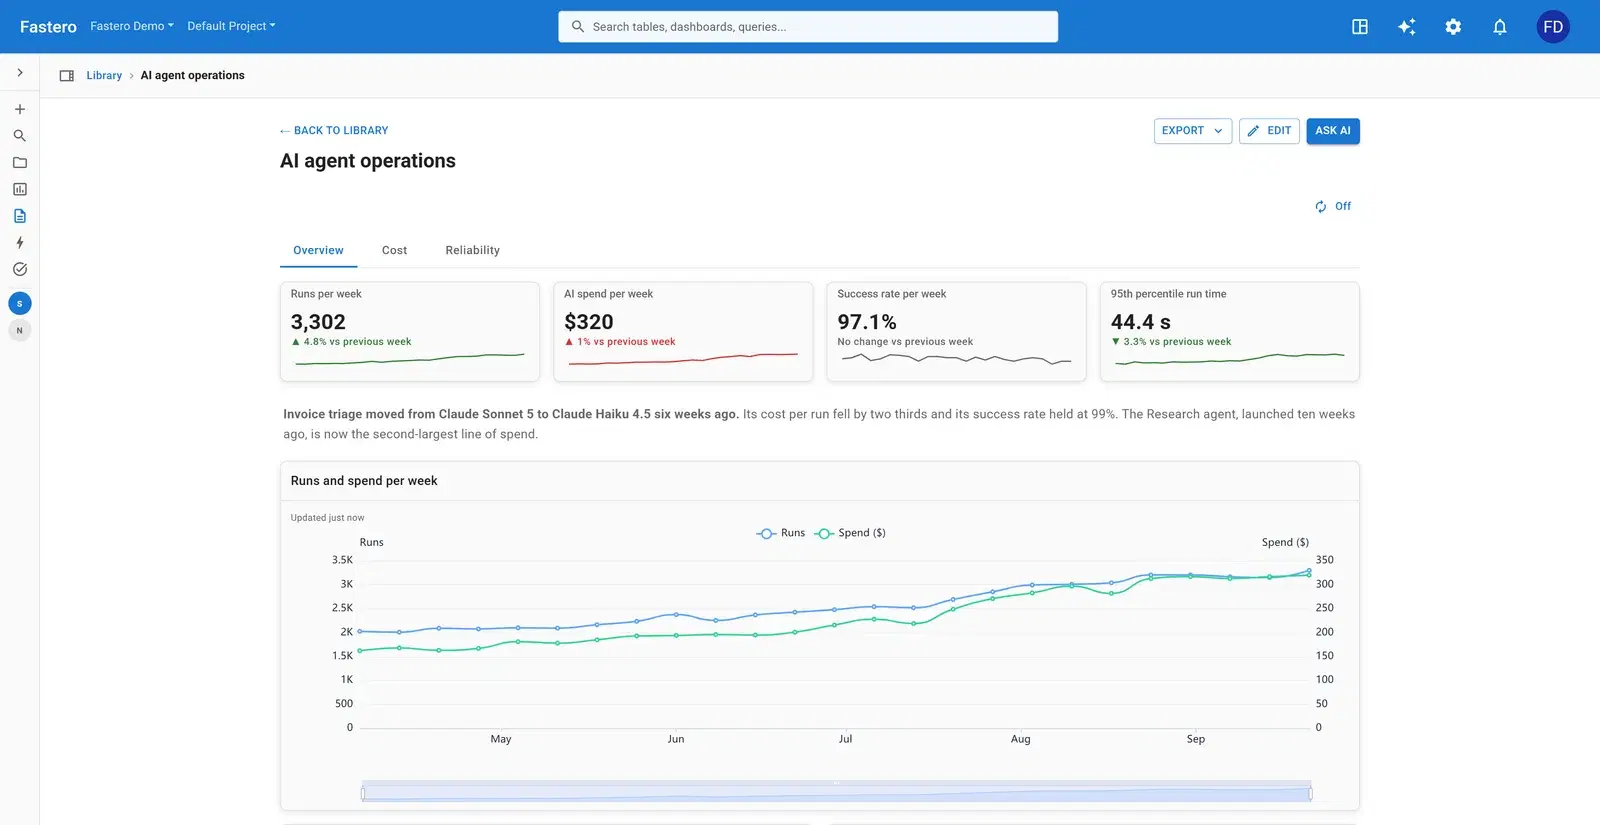
What do our agents cost per run?
Acme / Solar fleet

94%

of forecast this week

Compare output with the forecast

05 — Share it

Your team signs in and sees it.

Invite colleagues or clients. They see only what you shared, and it's current when they look. Or send a public link.

See a client report →
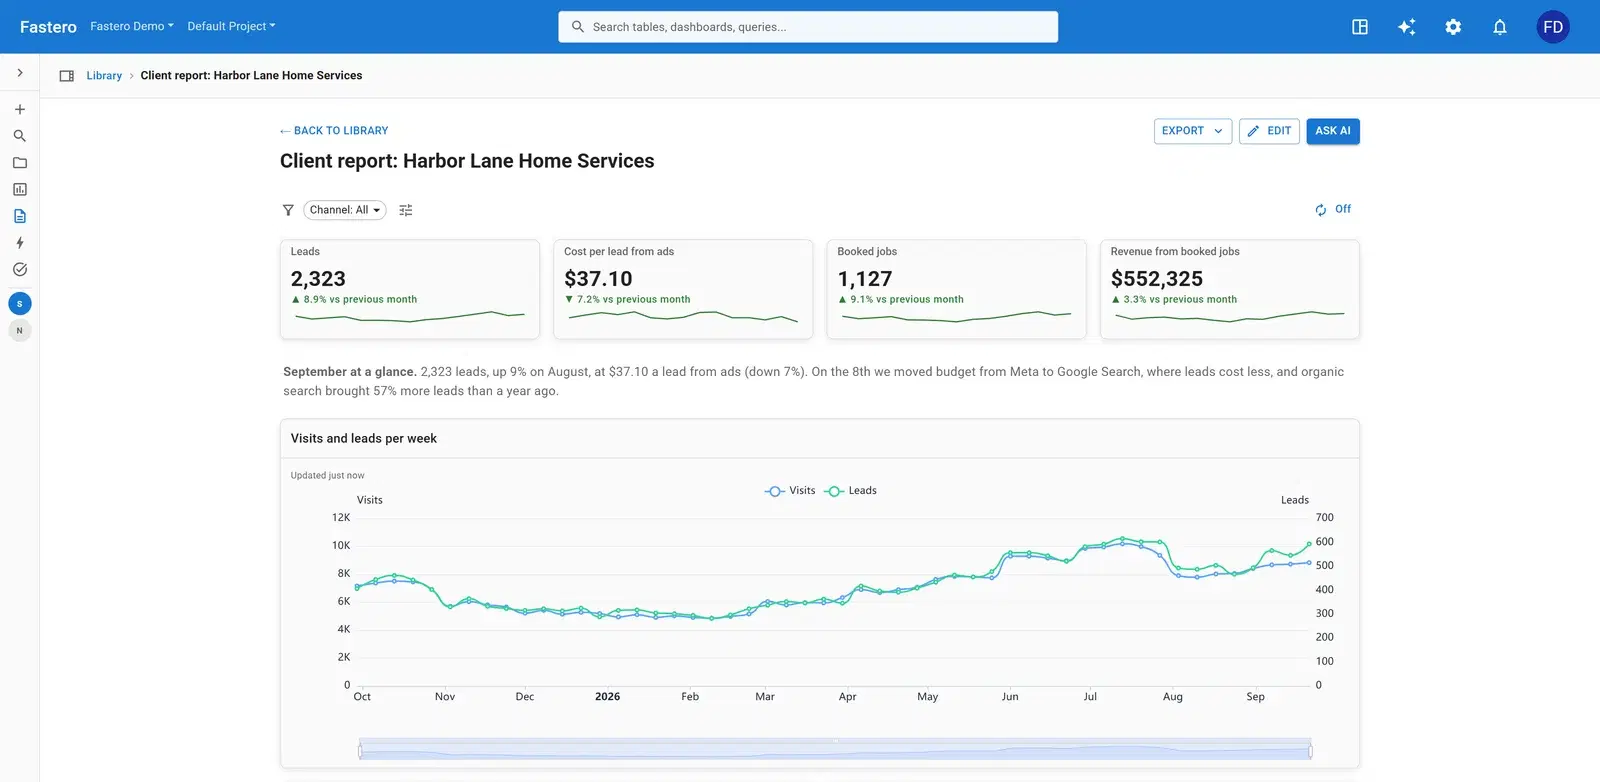
app.fastero.com / Monthly client report
A monthly client report in Fastero: leads, cost per lead from ads, booked jobs and revenue, each against the previous month, with a written summary and visits and leads per week
Share “Monthly client report”
maya@acme.comViewer ▾Invite
  • YouYouOwner
  • MCMaya Chenopened it today, 9:02Viewer
  • JRJon ReyesinvitedViewer
Public linkCopy link

06 — Keep watch

The report you rebuild by hand, every single week.

Alerts when a number moves. The report every Monday.

Ask once and it keeps running: an email when signups drop, the dashboard in everyone's inbox at 9:00, charts that redraw when the data changes.

Alerts & schedules →
claude — ~/acme-analytics

> Email me if weekly signups drop more than 20%

⏺ fastero - fastero_create_alert (MCP)

  ⎿  Alert “Signups drop” is on

> And send Growth overview to the team every Monday at 9

⏺ fastero - fastero_schedule_dashboard_email (MCP)

  ⎿  Every Monday at 09:00

Inbox

Mon 9:00 · Fastero

Growth overview, week 42

Signups

1,284

▲ 9%

Activated

412

▲ 4%

Open the dashboard →

07 — Go further

For teams that speak Python.

When a dashboard isn't enough, open the notebook, run the deeper analysis and publish the result as a Streamlit app, behind the same login.

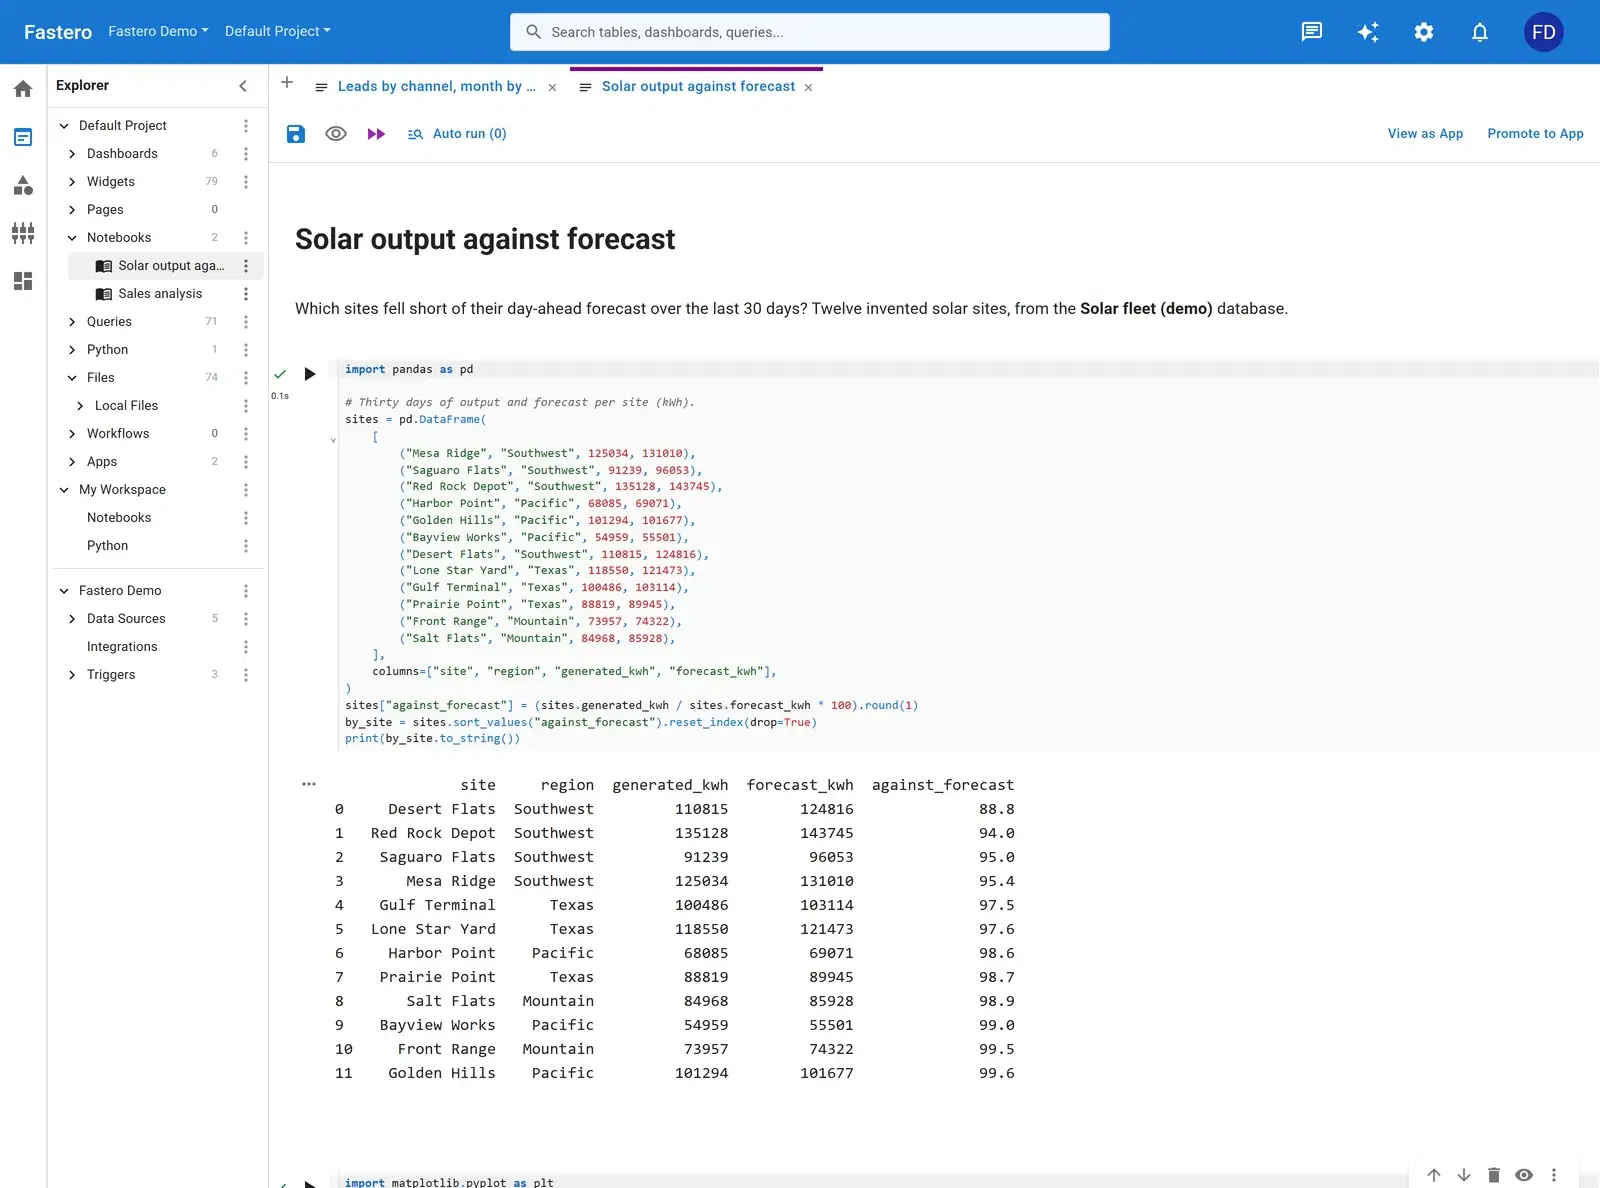
Notebook · Solar output against forecast
A Jupyter notebook in Fastero comparing solar output with the forecast, with a chart
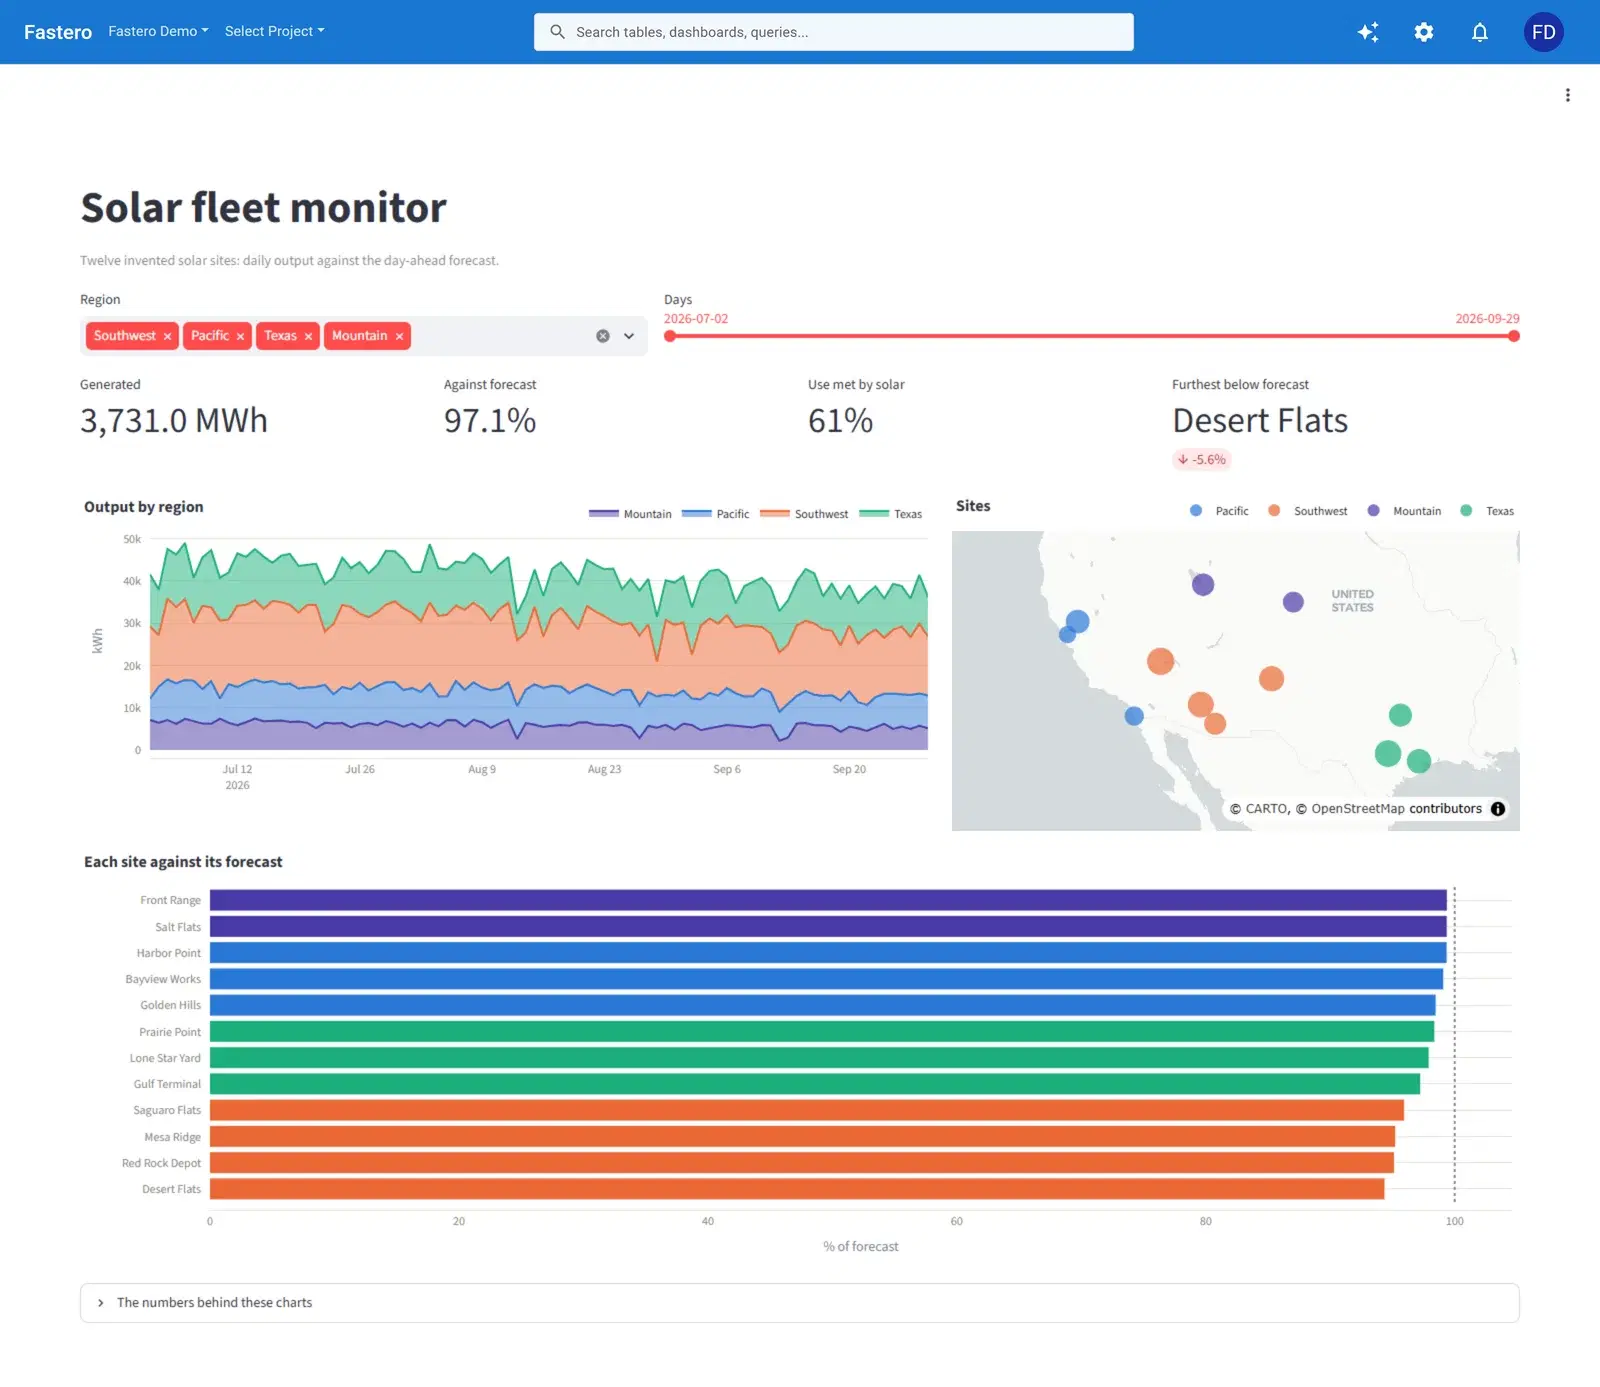
Solar fleet monitorRunning · always on
A Streamlit app, Solar fleet monitor, running in Fastero with region and date filters, headline numbers, a map and charts
  • Run Python notebooks

    Open the notebook beside the data, inspect it, and keep the analysis next to the dashboards it feeds.

    See the workbench →
  • Publish Streamlit apps

    Turn a one-off analysis into an app your team opens, behind the same login, with your secrets injected.

    See Streamlit hosting →
  • Put it on a schedule

    Run scripts and notebooks every morning, every hour or when the data changes, with each run’s log a click away.

    See Python jobs →

Integrations

Built around the tools you already run.

Connect in minutes. Fastero reads from your business apps, databases, and files, then turns the signal into an answer, alert, or workflow.

Databases and files

Existing inputs
PostgreSQLMySQLBigQuerySnowflakeGoogle Sheets+ CSV and Excel uploads

Agents work with your permissions. Never more.

  • The key acts as you

    Your role, in one workspace. Revoke the key and access ends.

  • Single sign-on

    Sign in through your identity provider.

  • Role-based access

    Control who can see and run what, per project.

  • Audit logs

    Every query, alert and action is logged.

  • Bring your own model

    Run the AI on your own provider keys if you prefer.

Common questions

Fair questions, straight answers.

How is this different from just asking Claude?

Claude can query your data and draw a chart in the chat. Fastero is where the result lives after the chat ends: a dashboard on live data that your team opens next week, with logins, roles and a schedule. Claude works inside Fastero through MCP, with your permissions.

How does Fastero get access to my data?

You connect each source yourself: databases with standard credentials, business tools in a couple of clicks. Fastero queries your systems where they live, and you can disconnect any source at any time.

Does the agent see my database password?

No. You enter the credentials once, in Fastero, and agents reach the database only through Fastero's tools: they get results, never the password. Their key acts as you, in one workspace, and revoking it ends their access.

Do I need a data team or a warehouse?

No. If you can sign in to your tools, you can connect them. Fastero works directly against the systems you already run; a warehouse is supported, not required.

How long does setup take?

Connecting a source takes a few minutes, and adding Fastero to Claude Code is one command. Your first dashboard can come out of the same conversation.

What does it cost to start?

Nothing. The Free plan has no time limit and needs no card, and every new account gets 14 days of Pro. Nothing is charged when the 14 days end: your workspace moves to the Free plan.

Act on your data faster.