 Fastero Dev Team
A client report has one job: show the client what they paid for and what happens next, in a few minutes of reading. Most templates bury that under every metric the ad platforms export. This one starts from what the client reads, then lists the numbers for each service, and ends with what the tools that send it cost.
The short answer: a client report template is the fixed layout you fill with each client's numbers every month. Put a two-sentence summary first, then the three to five results the client pays for (leads, sales, booked jobs) against last month, what each cost, where they came from, a 12-month trend and next steps. Service sections follow: SEO (Search Console clicks, impressions, average position), paid ads (spend, conversions, cost per conversion, ROAS) and social (reach, engagement rate). Send it monthly, on the same day. Google's Data Studio does it for free; AgencyAnalytics costs $20 per client a month billed yearly, and DashThis starts at $44 a month.
Fastero
Connect your database. Ask questions. Get dashboards.
Postgres, BigQuery, Snowflake, and 10+ sources — live-connected, AI-powered, no dashboard builder learning curve.
Try free →The eight sections of a client report
| # | Section | What goes in it |
|---|---|---|
| 1 | Cover | The client, the period, your name |
| 2 | Summary | Two sentences: what happened, and what you'll do next |
| 3 | Results | Three to five outcome numbers, each against the previous period and the target |
| 4 | Cost | Spend, and cost per lead or per sale |
| 5 | Channels | Where the results came from |
| 6 | Service sections | SEO, paid ads, social, website: one section per service you sell |
| 7 | Trend | The last 12 months, so one slow month isn't read as failure |
| 8 | Next steps | What you'll change, and anything you need from the client |
Three rules make the difference between a report clients read and one they file:
- Outcomes first. "Booked jobs and revenue first, clicks and impressions far below." A client who pays for leads wants leads at the top.
- The summary is the report. "A short summary at the top — what happened and what you'll do next — is the part most clients read."
- Cost per lead from paid leads only. "Divide ad spend by leads from paid channels." Dividing by every lead, organic ones included, flatters the ads.
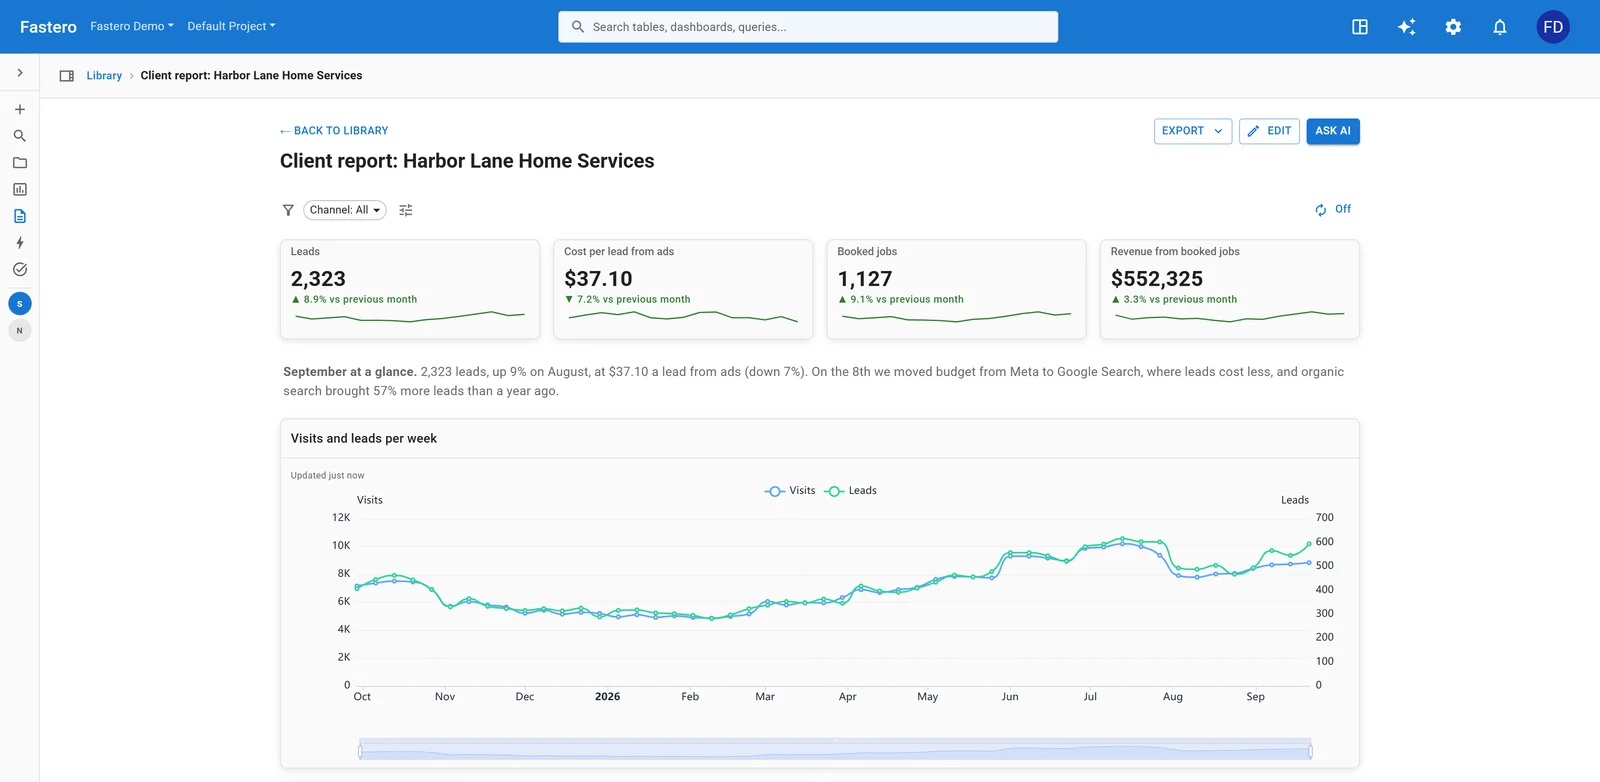
An example monthly client report, on an invented home-services business: results first, the summary beside them.
KPIs by service
| Service | The numbers to report | Where they come from |
|---|---|---|
| SEO | Impressions, clicks, click-through rate and average position; rankings for the agreed keywords; organic sessions; backlinks gained and lost; technical issues found and fixed | Google Search Console, your rank tracker, GA4 |
| Paid ads | Spend, conversions, cost per conversion, impressions, clicks, CTR, CPC, ROAS | Google Ads, Meta Ads, LinkedIn Ads |
| Social | Reach, engagement rate, total engagement, top posts, follower growth | Each network's analytics |
| Website | Sessions, users, engaged sessions, key events (GA4's name for conversions) by channel and landing page | GA4 |
AgencyAnalytics' SEO template, for example, reports "impressions, clicks, click-through rate, and average position" from Search Console, and its PPC template starts "with a summary of key metrics like conversions, cost, impressions, clicks, CTR, CPC, and cost per conversion". Pick the few that tie to what the client pays for, and leave the rest in an appendix.
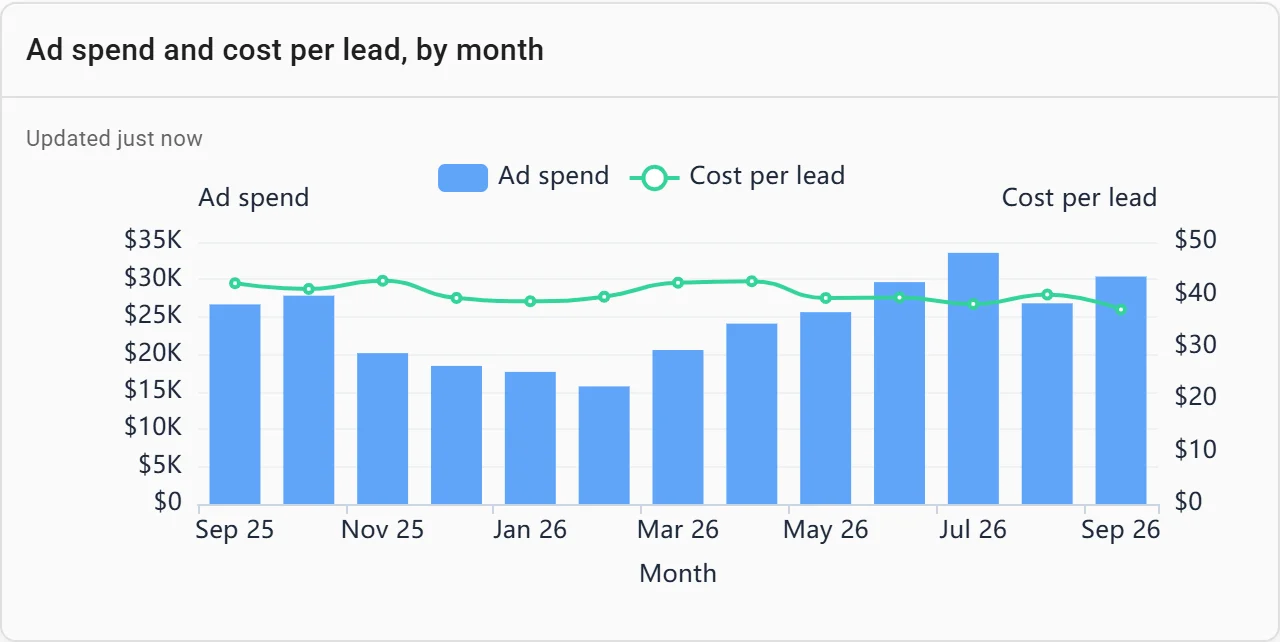
Spend against cost per lead, month by month: the chart that answers "are the ads getting more expensive?"
How often to send it
Monthly is the default, and the vendors' templates are built around it: "Scheduled monthly reports ensure your agency never misses a deadline." Send it on the same day each month, so the client knows when to look. Weekly makes sense during a launch or a big campaign, as a short note rather than the full report. Whatever the cadence, a scheduled email beats a link the client has to remember to open.
Tools that fill and send a client report
Prices from each vendor's own page on 11 November 2026. Some showed euros to our European connection; those are marked.
| Tool | How it charges | Entry price | Free? | White-label |
|---|---|---|---|---|
| Data Studio (Google) | Free; Pro per user per project | $0; Pro $9 per user per project a month | Yes | No custom domain; brand the report itself |
| AgencyAnalytics | Per client | $20 per client a month, billed yearly | 14-day trial | Included with every client |
| DashThis | Per dashboard, now also per data source | $44 a month, billed yearly | 14-day trial | Logo, no DashThis branding, own domain and sender email |
| Swydo | Per data source | €69 a month billed yearly, 10 data sources included (euro price) | 14-day trial | Included |
| Whatagraph | Two plans | Max from €699 a month billed yearly (euro price); Prime on request | Demo only | On Max; a custom report domain is a Prime add-on |
| Databox | Per platform plan | $399 a month billed yearly, or $499 monthly | No free plan; 14-day trial | A paid add-on |
A few details that change the bill:
- Per client or per source. AgencyAnalytics charges "$20 per client", so ten clients cost $200 a month on yearly billing. DashThis counts dashboards: "Users usually create one dashboard per client." Swydo counts data sources: its entry plan "includes 10 data sources and an unlimited number of clients and users."
- Databox dropped its free plan. Asked "Do you offer a free plan?", its pricing page now answers: "No. Every account starts with a 14-day trial of the Platform plan instead". Older comparisons still list it as free.
- Data Studio's free limits. "Data Studio is available at no charge for creators and report viewers." Without Pro, "the highest frequency you can set a schedule is once per day", and a schedule takes "no more than 50 recipient addresses". Non-Google sources such as Meta Ads usually need a paid connector: Supermetrics starts at €39 a month billed yearly for "2 data sources of your choice", and Porter Metrics at $12.50 per account.
- Everyone has an AI connector now. AgencyAnalytics lists "MCP access (ChatGPT & Claude)" with every client, so Claude can read the same numbers the report shows.
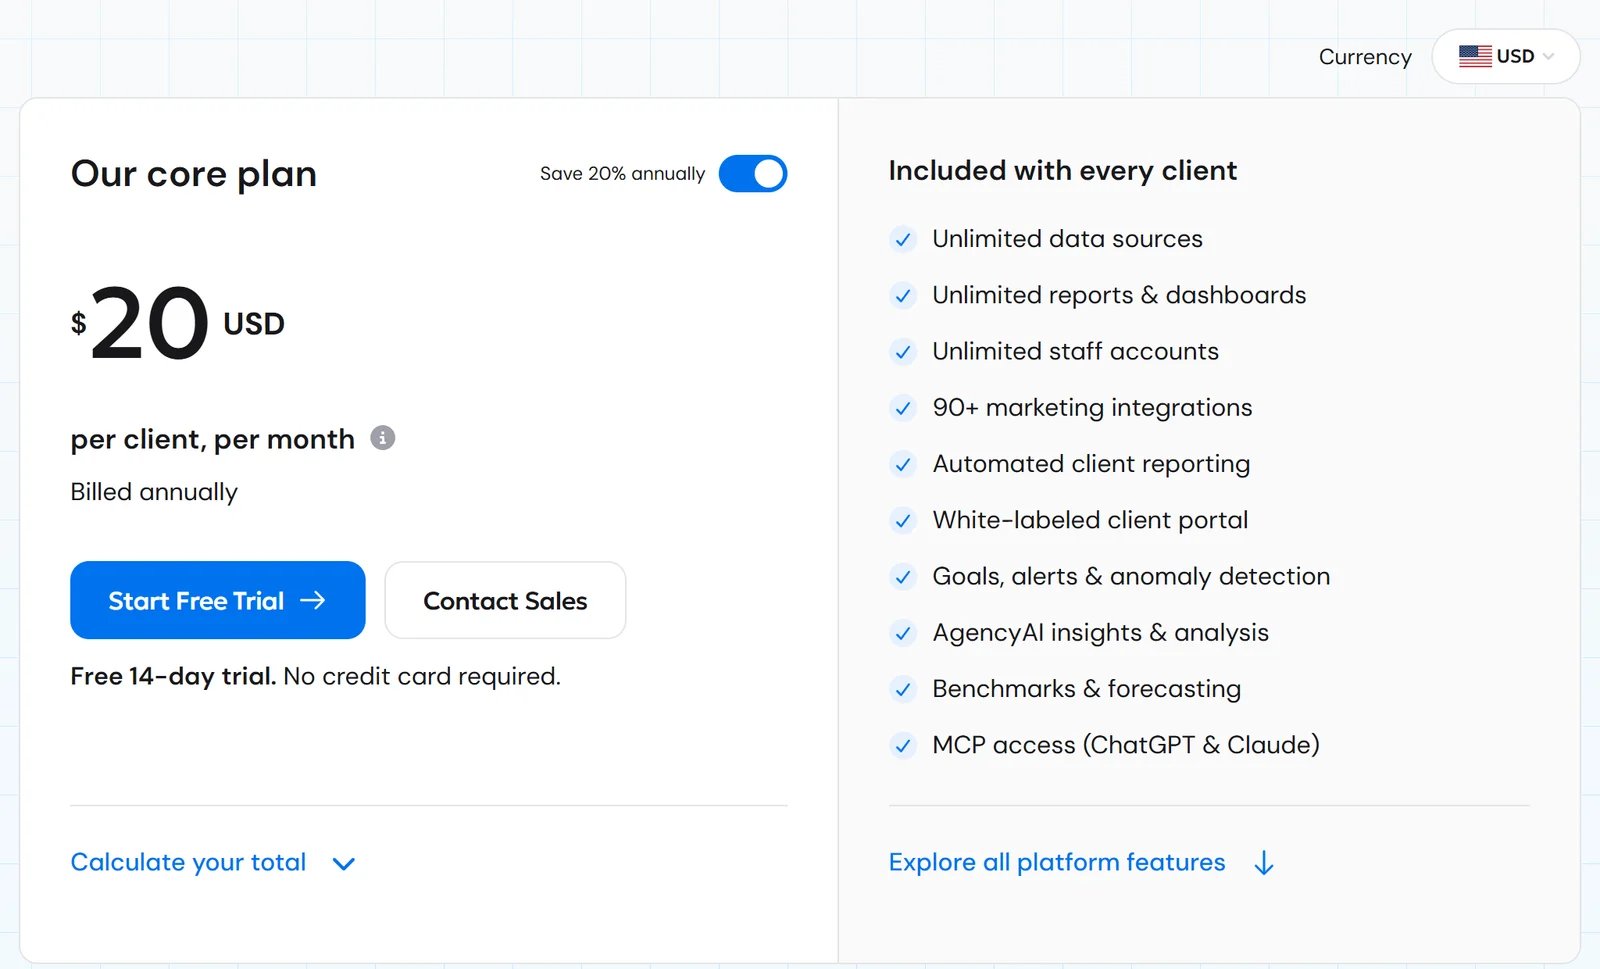
AgencyAnalytics' single plan, priced per client, on 11 November 2026.
Connect any database. Ask in plain English.
Start free →When the client's numbers aren't in an ad platform
The tools above are built for marketing agencies, and they shine when the data lives in Google Ads, Meta and GA4. Many freelancers and agencies report on something else: the client's own database, their CRM export, their booking system or a spreadsheet of jobs. Then a marketing connector doesn't help, and the report needs SQL behind it.
Fastero is an AI and data platform where people and AI agents work together on a team's data, and its monthly client report example shows the setup. Connect the client's database, and every number on the report is a saved query you can open and check. Then two things a client report needs:
- Each client sees only their report. "Give each client their own workspace in Fastero and invite them to it: they sign in and land on their report, and see nothing of your other clients."
- It arrives without anyone opening it. "In Fastero, each recipient gets a PDF of the whole report, run fresh that morning, on the day and time you choose."
The example page ends with the prompt that builds the report from your data, and Claude can do the same through Fastero's connector. More on AI report generators, AgencyAnalytics alternatives and free dashboard templates.
FAQ
What should a client report include?
A two-sentence summary, the three to five results the client pays for against last month, what they cost, where they came from, a 12-month trend and next steps. Add one section per service you deliver, such as SEO or paid ads.
Is there a free client report template?
Yes. Google's Data Studio is free and its Report Gallery has marketing templates made by Google. You can also start from an example such as Fastero's monthly client report, which comes with its SQL and the prompt to rebuild it on your data.
How often should agencies send client reports?
Monthly, on the same day each month, is the norm. Add a short weekly note during launches or big campaigns.
What KPIs go in an SEO client report?
Search Console impressions, clicks, click-through rate and average position, rankings for the agreed keywords, organic sessions and conversions, backlinks gained and lost, and technical issues fixed.
What does white-label reporting mean?
The report carries your agency's brand instead of the tool's: your logo, colours, domain and sender email. AgencyAnalytics and Swydo include it; Databox sells it as an add-on, and Whatagraph puts a custom report domain on its top plan.
What is the best client reporting software for agencies?
For Google-only clients, Data Studio, which is free. For many marketing channels, AgencyAnalytics (per client) or DashThis (per dashboard). For clients whose numbers live in a database rather than ad platforms, a SQL-based tool such as Fastero.
Sources
Read on 11 November 2026:
- Pricing: AgencyAnalytics, DashThis, Swydo, Whatagraph, Databox, Supermetrics, Porter Metrics
- Google: Data Studio, Schedule report delivery
- AgencyAnalytics report templates: SEO, PPC, Social media, Monthly