Dashboard example
Monthly Client Report Example: A Marketing Report an Agency Sends Every Month
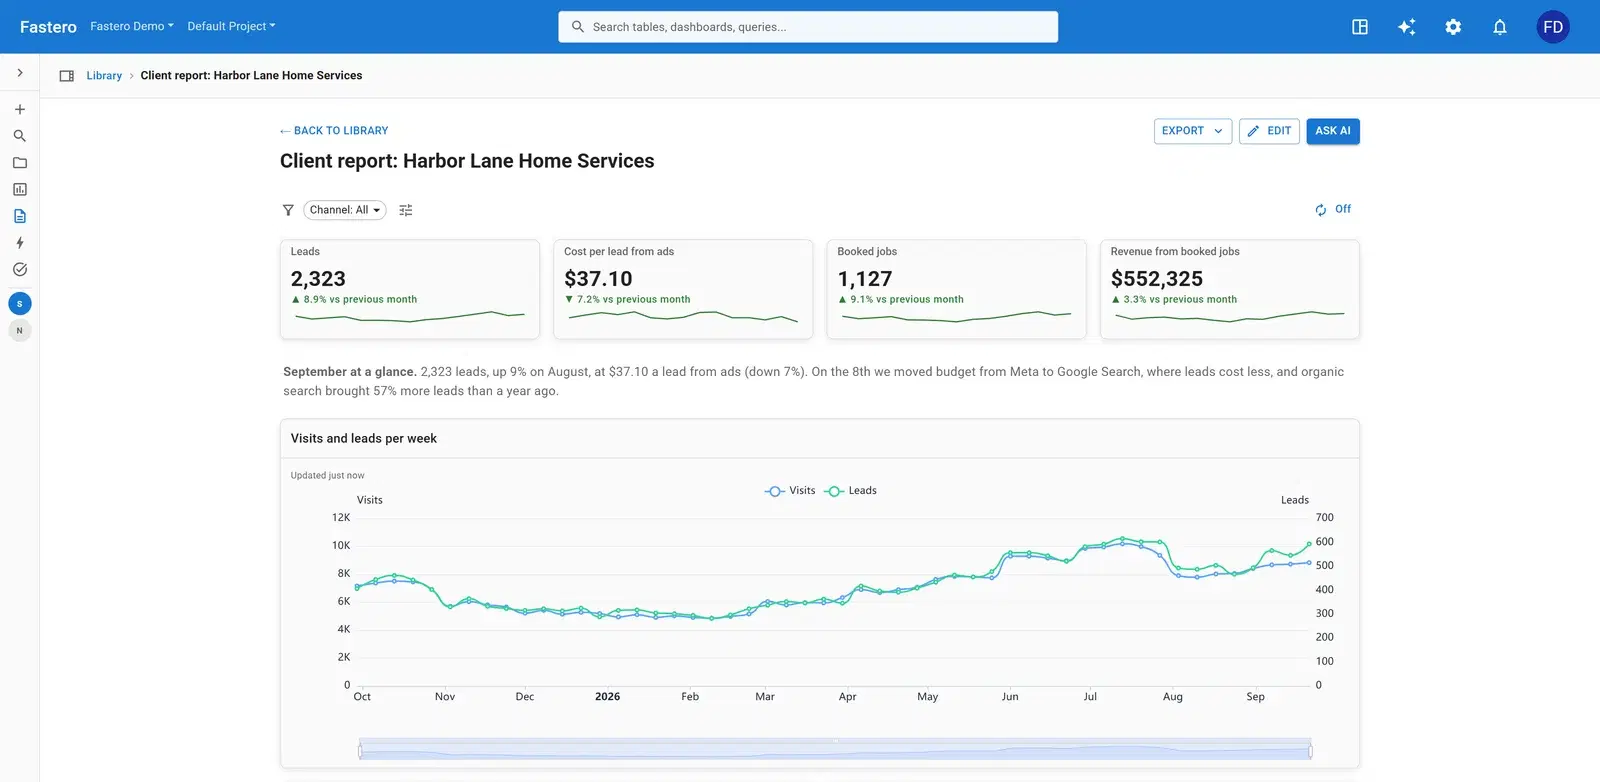
An agency's monthly report has one job: show the client that the money they spend turns into business. This one does it for an invented home-services company — leads, what each lead costs, booked jobs and the revenue they brought — and then shows which channels, campaigns and areas they came from.
What's on it
Daily visits, leads, booked jobs and ad spend by channel; daily spend, clicks and leads by campaign; visits by landing page; leads by service area; and booked jobs and revenue by service each month.
- Leads
- Cost per lead from ads
- Booked jobs
- Revenue from booked jobs
- A written summary of the month
- Visits and leads per week
- Leads by channel, month by month
- Where this month's leads came from
- Ad spend and cost per lead, by month
- Cost per lead by campaign, this month
- Visits by landing page, last 90 days
- Leads by area, on a map
- Booked jobs by service and month
- Campaigns this month: spend, clicks, leads, cost per lead and booked jobs
- A channel filter across the whole report
The charts that matter, and how they're worked out
Leads by channel, month by month
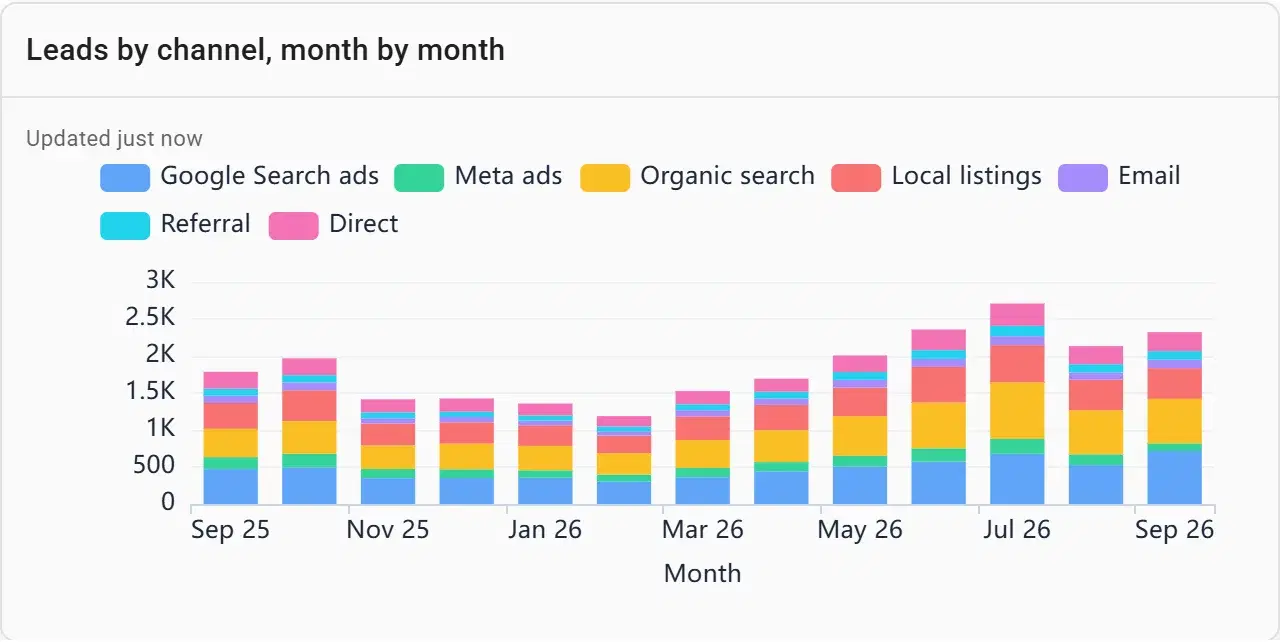
A year of months shows the season before anyone mistakes a slow January for a failing campaign, and the stack shows which channels carry it.
Ad spend and cost per lead, by month
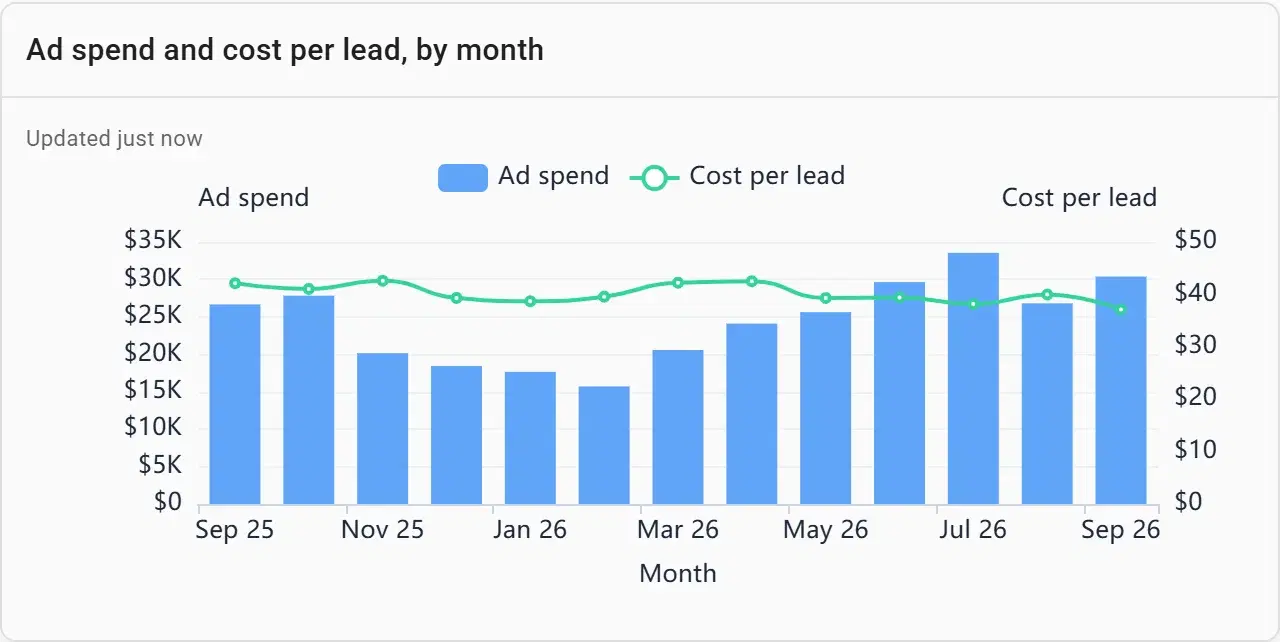
Spend and what it buys on one chart. Cost per lead divides ad spend by the leads from paid channels only — dividing by every lead would flatter the ads with organic results.
SELECT date_trunc('month', day) AS month,
       round(sum(ad_spend) / nullif(sum(leads) FILTER (WHERE ad_spend > 0), 0), 2) AS cost_per_lead
FROM channel_daily
GROUP BY 1
ORDER BY 1
Leads by area, last 90 days
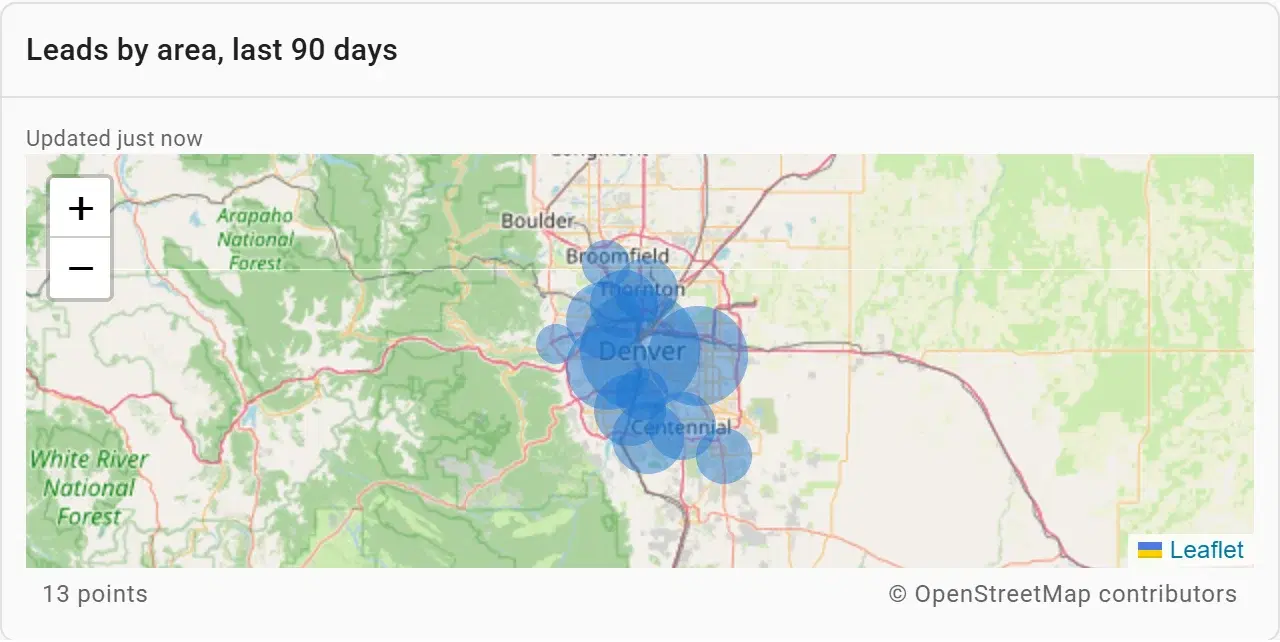
For a local business, where leads come from decides where to spend next. A map makes the gaps obvious.
Campaigns this month
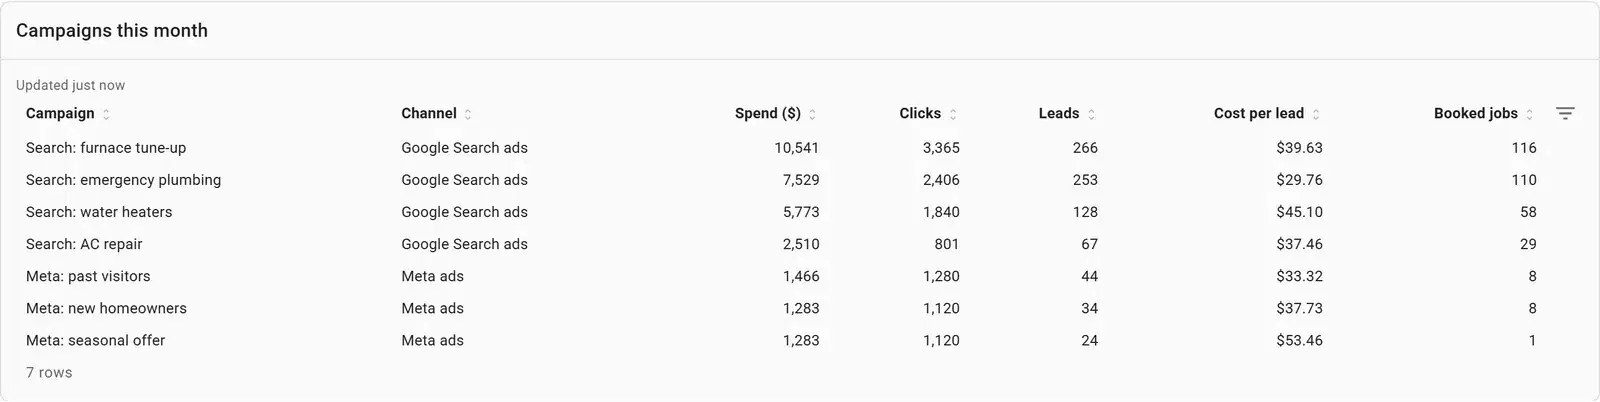
The table the client’s owner actually asks for: every campaign with its spend, leads, cost per lead and the jobs it booked.
Build one from your data
- Connect your database or upload a file in Fastero — or point Claude at it through Fastero's connector.
- Paste the prompt below, with your own table and column names.
- Check the numbers against a figure you trust, and adjust any chart by asking or by editing it.
- Share it with your team, or schedule it to arrive by email.
Build a monthly client report from this client's marketing data: leads, cost per lead from ads, booked jobs and revenue from booked jobs as number cards against the previous month; visits and leads per week; leads by channel month by month; ad spend and cost per lead by month; cost per lead by campaign this month; visits by landing page; leads by area on a map; booked jobs by service and month; and a table of this month's campaigns. Add a channel filter and a short written summary of the month.
What makes a good monthly client report
Lead with outcomes
Booked jobs and revenue first, clicks and impressions far below. The client pays for business, not traffic.
Cost per lead from paid leads only
Divide ad spend by leads from paid channels. Mixing in organic leads makes the ads look cheaper than they are.
Twelve months, not one
Month by month for a year shows the season, so a quiet month isn’t mistaken for a problem.
Write two sentences
A short summary at the top — what happened and what you’ll do next — is the part most clients read.
Same report, same day
The value is in the routine: the same layout, sent on the same day each month, so the client compares like with like.
Questions people ask
What should a monthly client report include?
The outcomes the client cares about (leads, booked jobs or sales, revenue), what they cost (cost per lead or per sale), where they came from (channels, campaigns, areas), the trend over the past year, and a short written summary with next steps.
How do I send client reports automatically?
Build the report once, then schedule it. In Fastero, each recipient gets a PDF of the whole report, run fresh that morning, on the day and time you choose.
Can each client see only their own report?
Yes. Give each client their own workspace in Fastero and invite them to it: they sign in and land on their report, and see nothing of your other clients.
Can I build this from my clients’ ad and analytics data?
Yes, if the data sits in a database, a Google Sheet or a connected source. Connect it, paste the prompt above and adjust the metrics to the client’s business.
More dashboard examples
Your data, this dashboard, in minutes.
Connect a database or upload a file, describe the dashboard, and share it with your team. Free plan, no card needed.