Dashboard example
Cohort Retention Dashboard Example: How to Build and Read a Retention Table
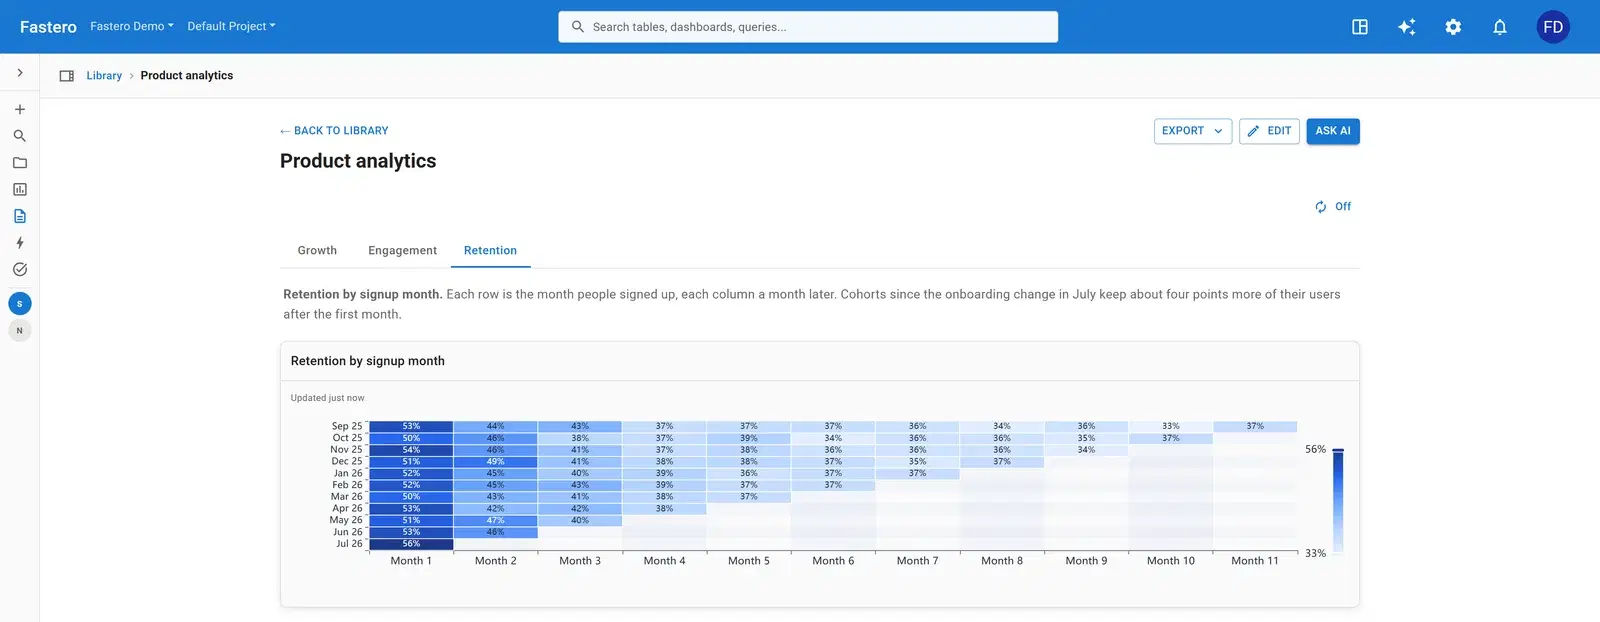
A cohort retention table groups people by the month they signed up and shows what share is still active each month after. It answers the question a single retention number can’t: are newer users staying longer than older ones? This example comes from the retention tab of an invented product’s dashboard.
What's on it
Two tables are enough: users, with the date each signed up, and events, with a row each time a user did something that counts as being active.
Retention
- A note on what changed and when
- Retention by signup month: rows are signup months, columns are months since signup
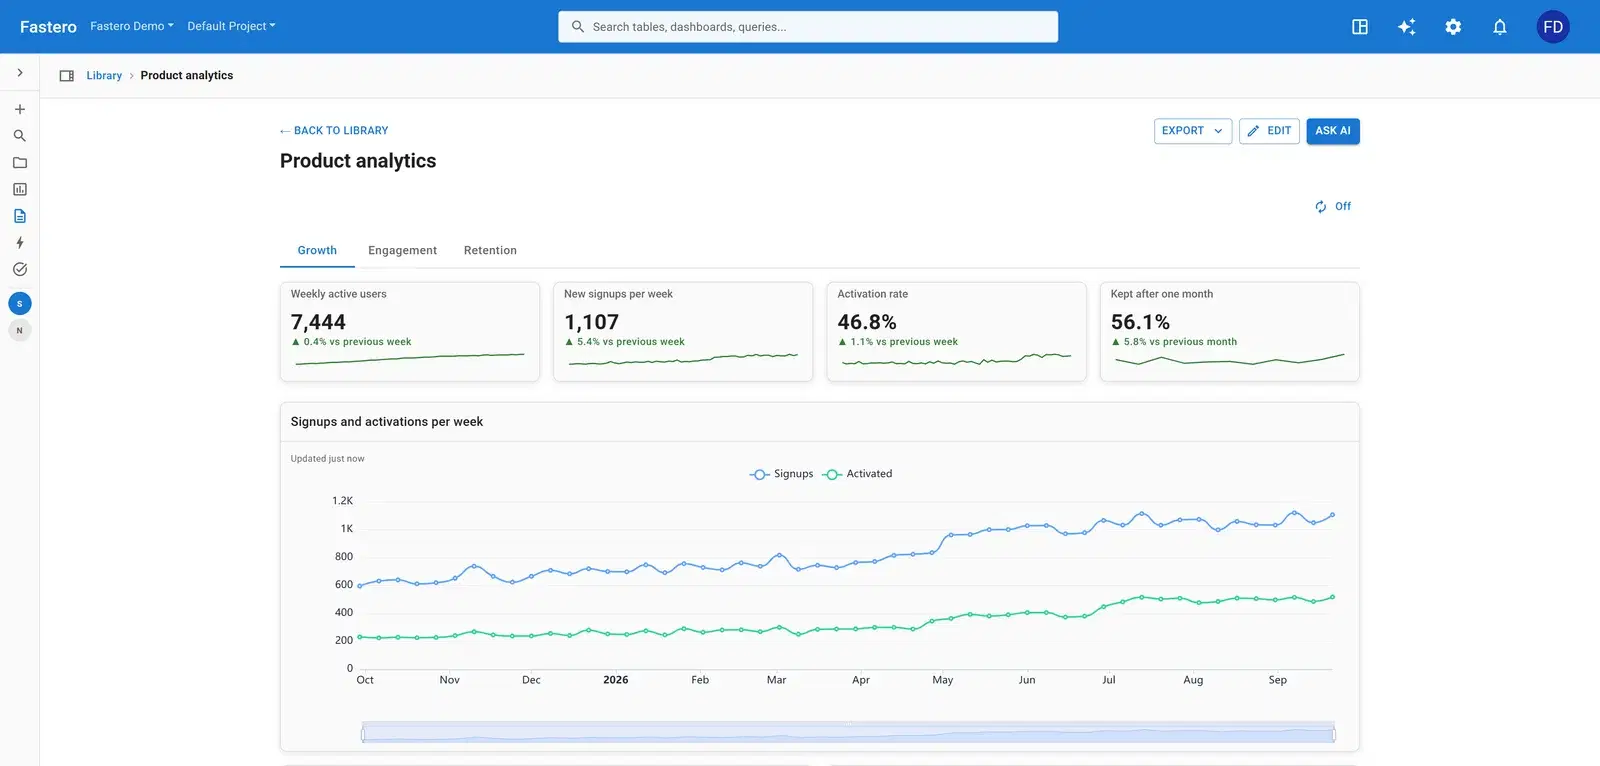
Growth
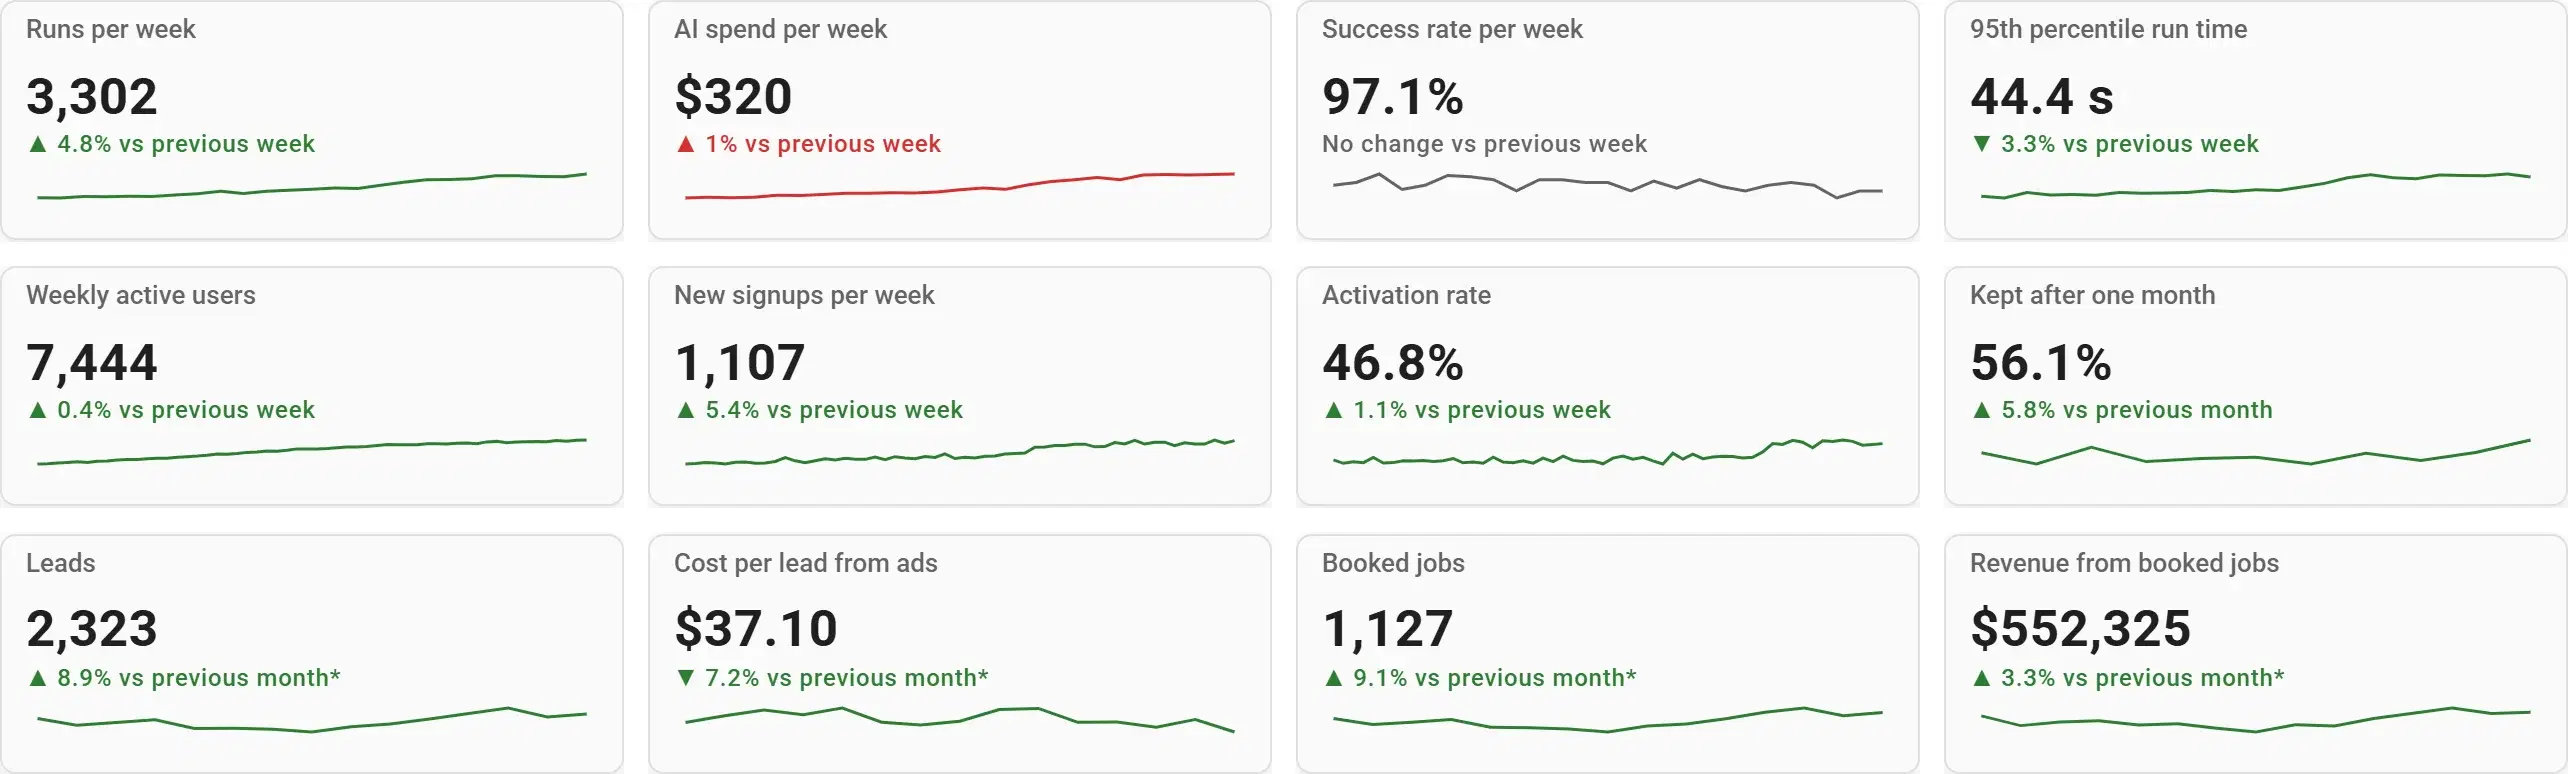
- Kept after one month, as a number card with its trend
The charts that matter, and how they're worked out
Retention by signup month
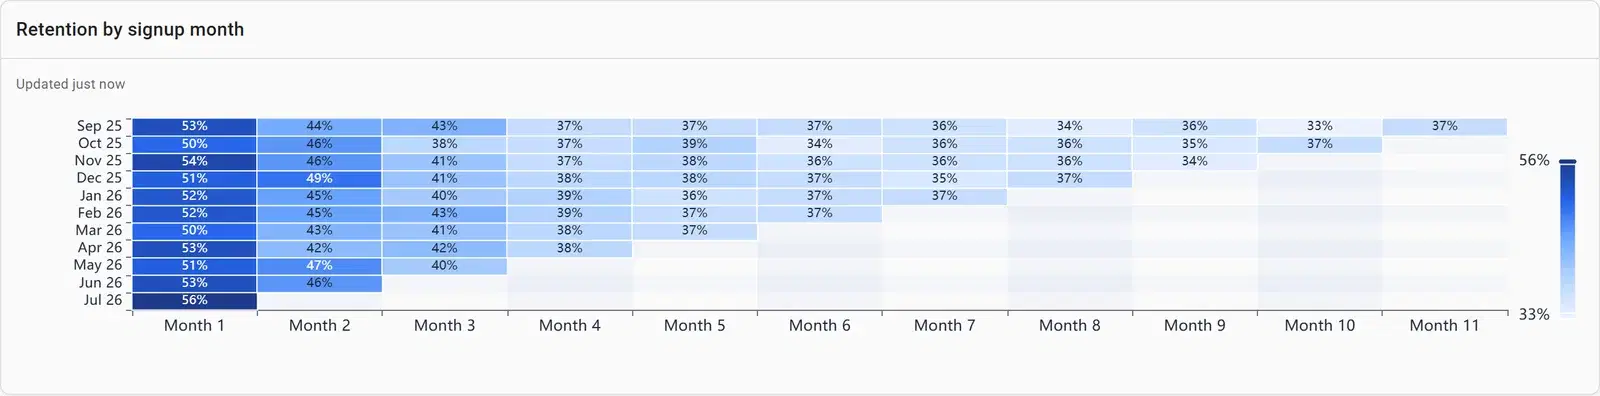
Read it down a column, not along a row. Column "Month 1" compares every cohort’s first month; if the newest rows are darker, recent changes are working. Along a row you see one cohort fade, which every product does.
WITH cohorts AS (
  SELECT user_id, date_trunc('month', signed_up_at) AS cohort
  FROM users
),
active AS (
  SELECT DISTINCT user_id, date_trunc('month', occurred_at) AS month
  FROM events
),
sizes AS (
  SELECT cohort, count(*) AS cohort_size FROM cohorts GROUP BY cohort
)
SELECT c.cohort,
       (extract(year FROM a.month) - extract(year FROM c.cohort)) * 12
         + extract(month FROM a.month) - extract(month FROM c.cohort) AS month_number,
       count(DISTINCT a.user_id) AS retained,
       s.cohort_size,
       round(100.0 * count(DISTINCT a.user_id) / s.cohort_size, 1) AS kept_pct
FROM cohorts c
JOIN active a ON a.user_id = c.user_id AND a.month >= c.cohort
JOIN sizes s ON s.cohort = c.cohort
GROUP BY c.cohort, month_number, s.cohort_size
ORDER BY c.cohort, month_number
Kept after one month
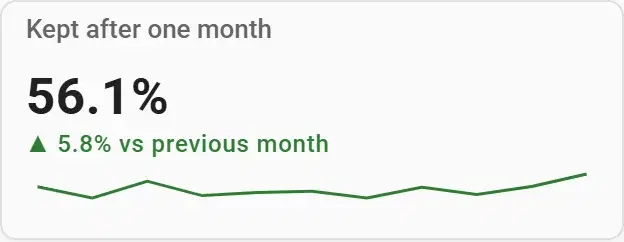
The heatmap’s first column as a single number for the growth tab, so the weekly review sees it without opening the retention view.
Build one from your data
- Connect your database or upload a file in Fastero — or point Claude at it through Fastero's connector.
- Paste the prompt below, with your own table and column names.
- Check the numbers against a figure you trust, and adjust any chart by asking or by editing it.
- Share it with your team, or schedule it to arrive by email.
From our users table (user_id, signed_up_at) and events table (user_id, occurred_at), build a monthly cohort retention table: one row per signup month, one column per month since signup, each cell the share of that cohort active in that month. Show it as a heatmap, add the cohort sizes, and add a number card for the share kept after one month.
What makes a good cohort retention dashboard
Say what "active" means
Logging in, running a report, sending a message — pick the action that shows real use and keep it fixed, or the table shifts every time someone redefines it.
Leave out the current month
A month that has only just started always looks like a collapse. Count complete months only.
Show cohort sizes
A cohort of 40 people swings ten points on a handful of users. Readers need the size to know how much to trust a cell.
Mark product changes
Note the month an onboarding change or a pricing change shipped, so a better column has a cause.
Monthly for most products
Weekly cohorts suit products used daily; monthly cohorts suit most B2B tools and keep the table readable.
Questions people ask
What is cohort analysis?
Cohort analysis groups people by when they started — usually their signup month — and tracks each group over time. In a retention table, each row is a cohort and each column a month since signup, so you can compare how well different cohorts are retained.
How do you calculate retention by cohort?
For each signup month, count the users in it, then for each later month count how many of them were active. Divide the second by the first. The SQL above does this from a users table and an events table.
Should I use weekly or monthly cohorts?
Monthly for most products, especially B2B tools used a few times a week. Weekly cohorts suit consumer products used daily, where a month hides too much.
How do I read a cohort retention heatmap?
Down each column, to compare cohorts at the same age: darker recent rows mean newer users stay longer. Along a row you see a single cohort’s decay, which flattens out once the people who were going to leave have left.
More dashboard examples
Your data, this dashboard, in minutes.
Connect a database or upload a file, describe the dashboard, and share it with your team. Free plan, no card needed.