Dashboard examples
Seven real dashboards, and how to build yours.
Not mock-ups: each of these is a working dashboard in Fastero, built from saved queries over invented data. Every page lists what is on the dashboard, shows how its key numbers are worked out in SQL, and gives the prompt that builds one like it from your own data.
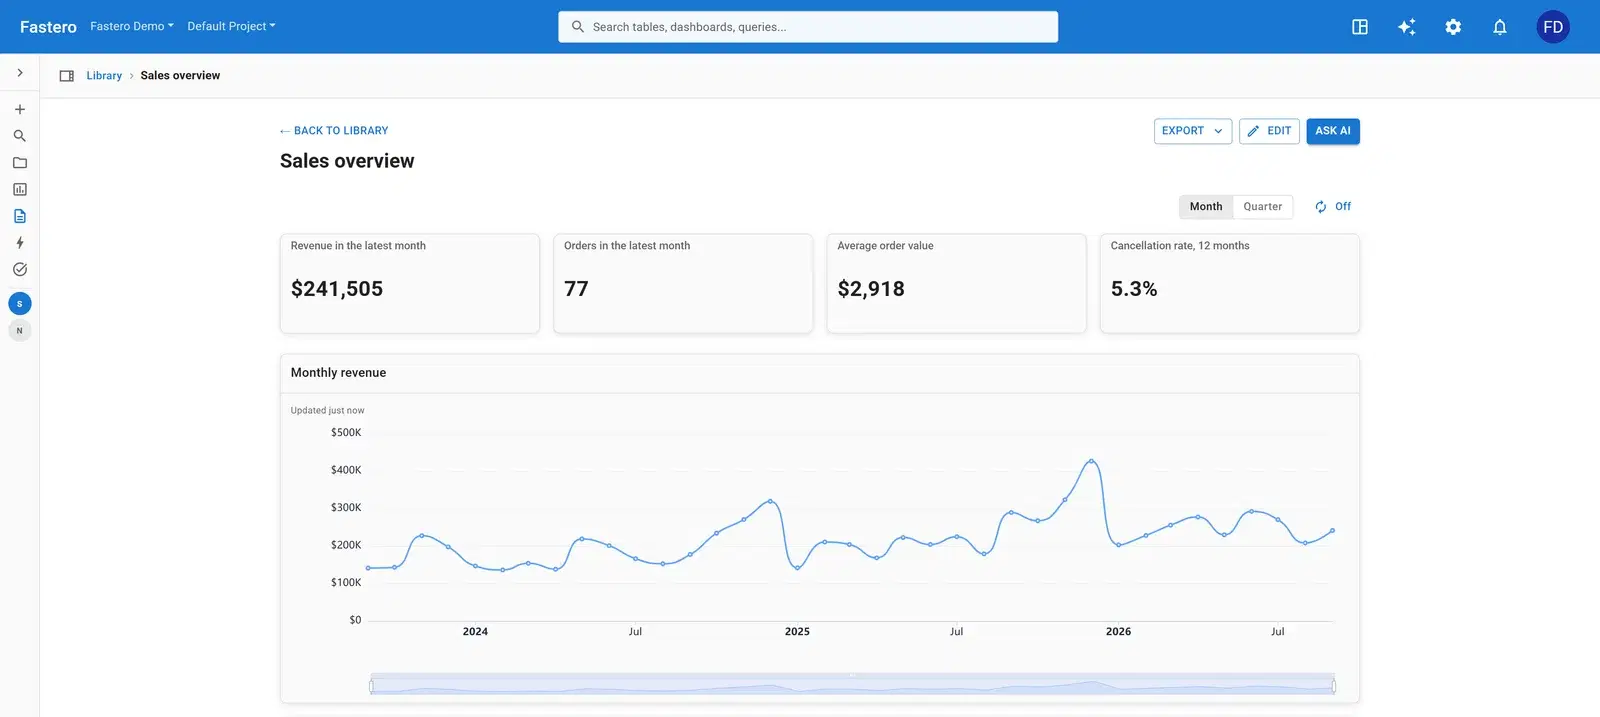
Executive dashboard
A real executive dashboard, built on invented sales data: four headline numbers, the revenue trend and the breakdowns leaders ask about next — with the SQL behind each number and the prompt to build one from your data.
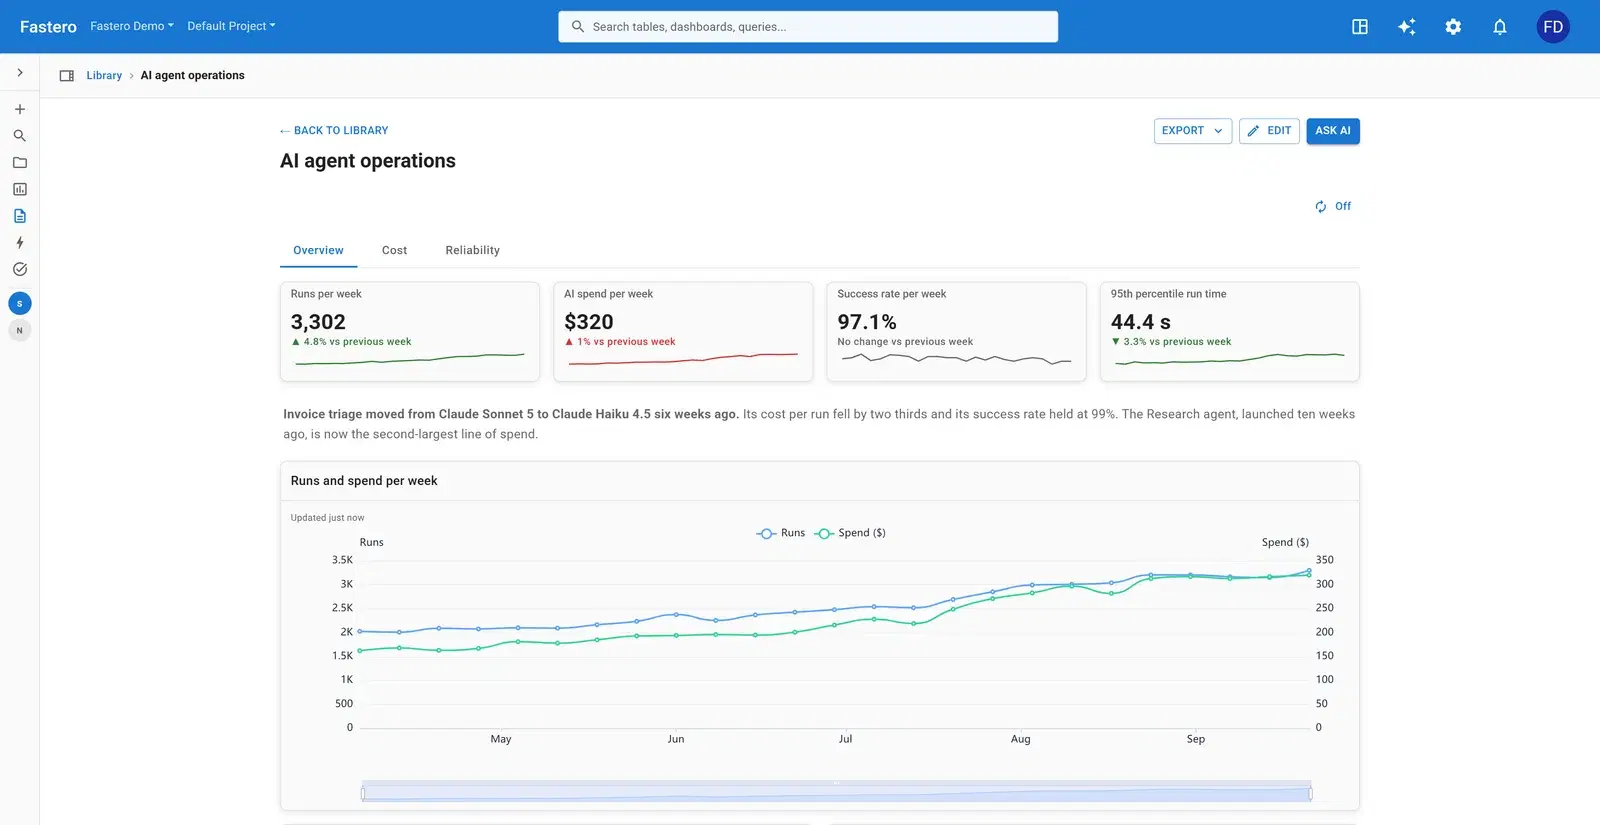
AI agent dashboard
A real AI agent operations dashboard, built on invented data for five agents: runs, spend, success rate and run time, cost per run by agent and model, failures and tool errors — with the SQL and the prompt to build one from your run log.
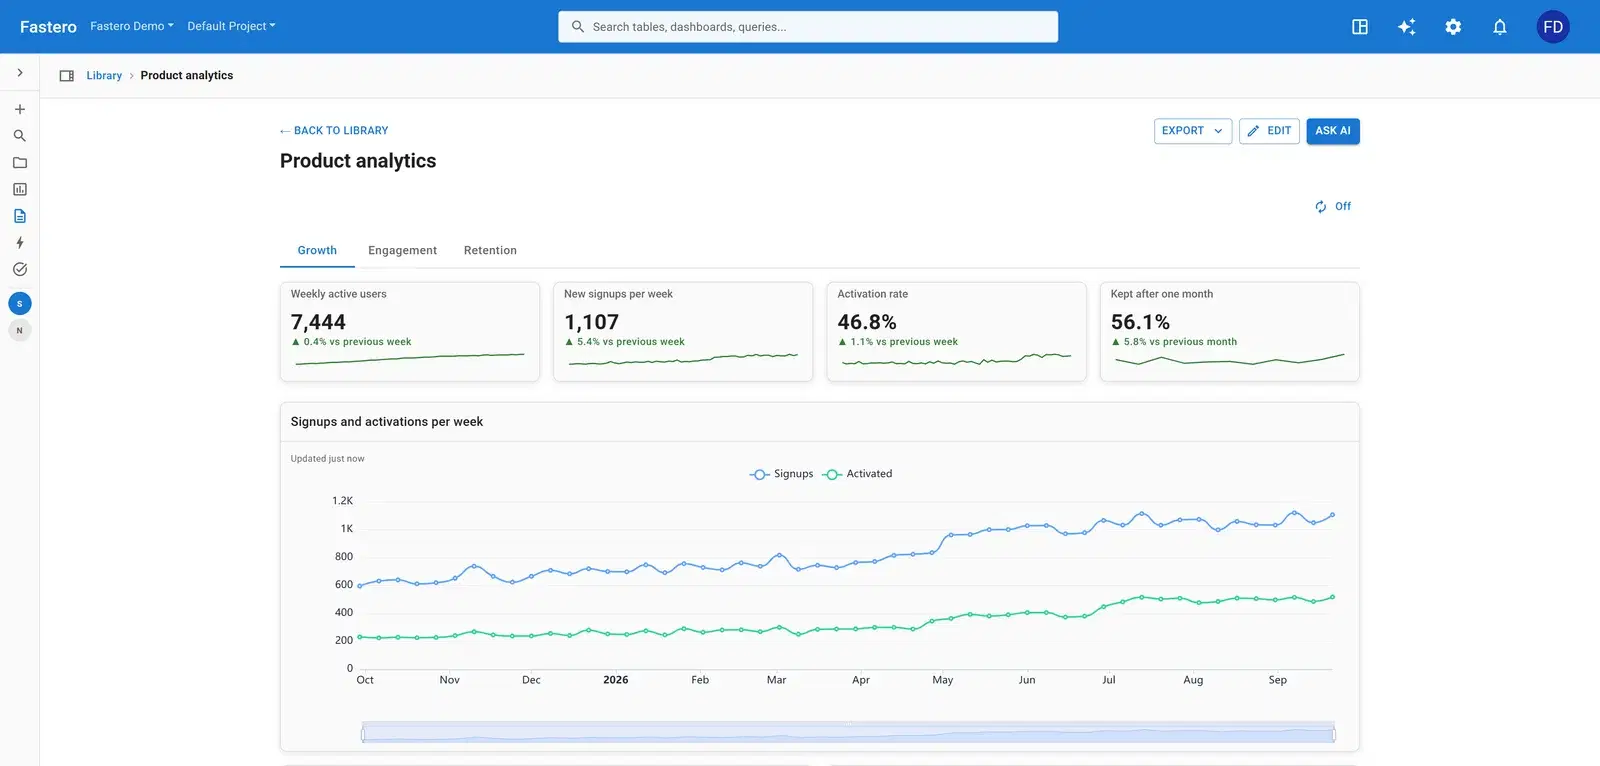
SaaS dashboard
A real SaaS product dashboard, built on invented data: weekly active users, signups and activation, the signup funnel, feature adoption and seats in use — with the SQL behind the key numbers and the prompt to build one from your product data.
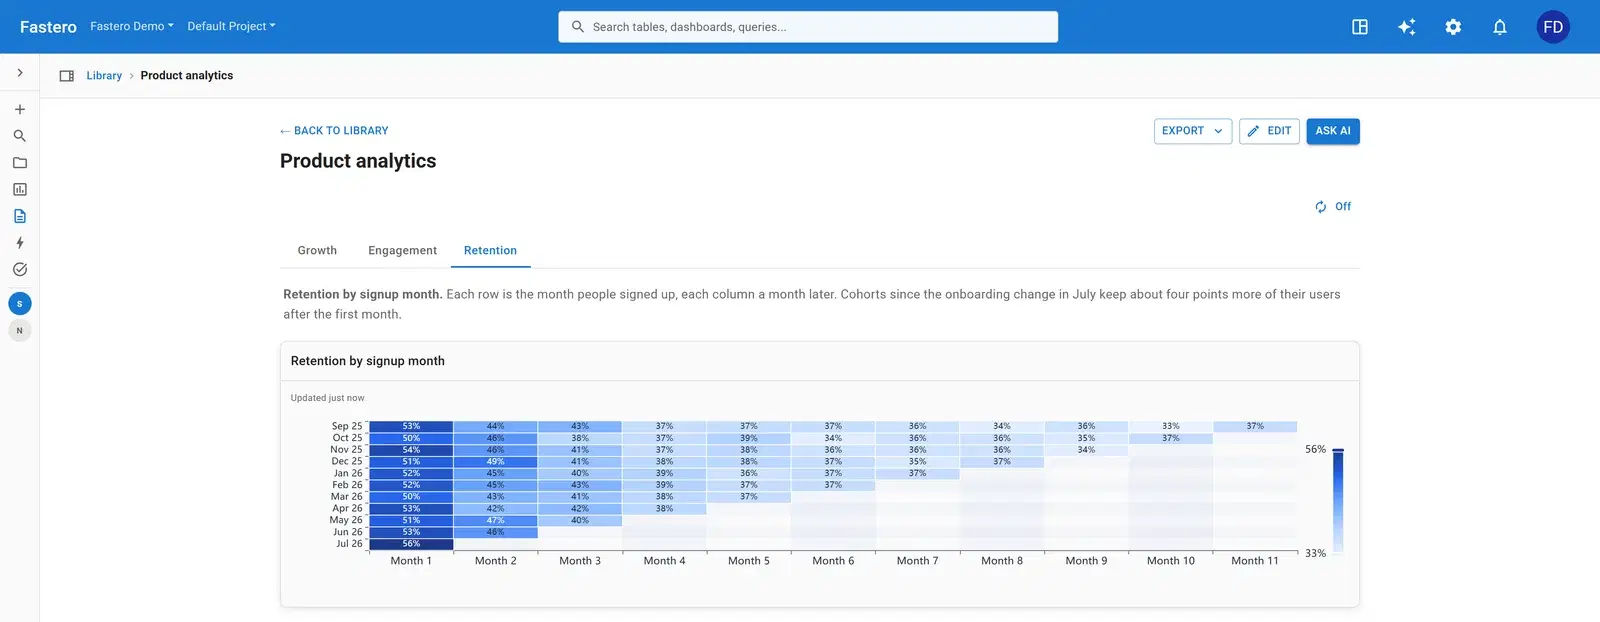
Cohort retention dashboard
A real cohort retention dashboard, built on invented data, with how to read it and the SQL to build a monthly retention table from your users and events — tested on sample data — plus the prompt to build one in Fastero.
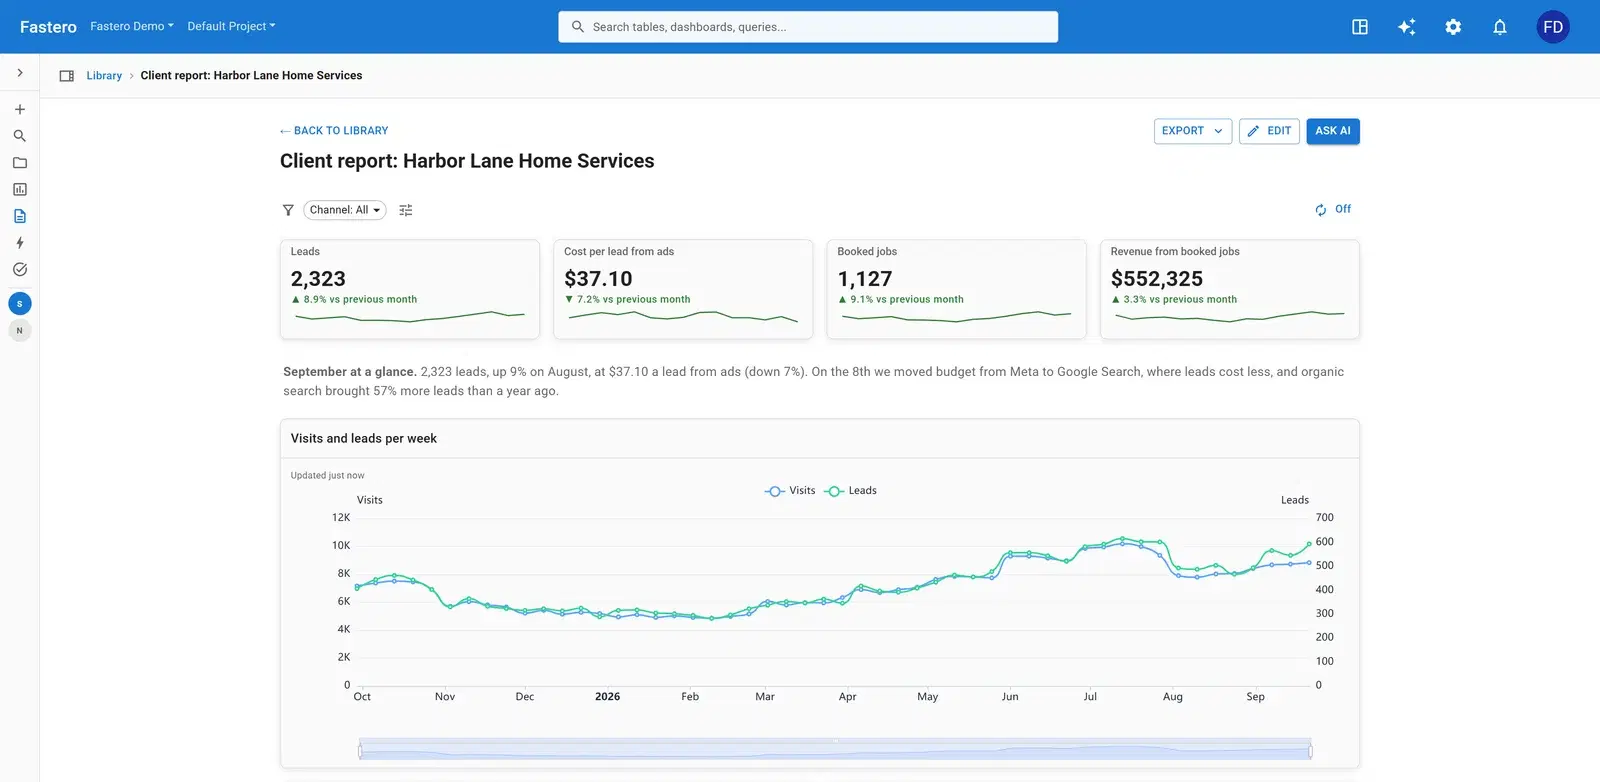
Monthly client report
A real monthly client report for an invented home-services business: leads, cost per lead, booked jobs and revenue, channels, campaigns, landing pages and service areas — with the SQL and the prompt to build your clients' reports in Fastero.
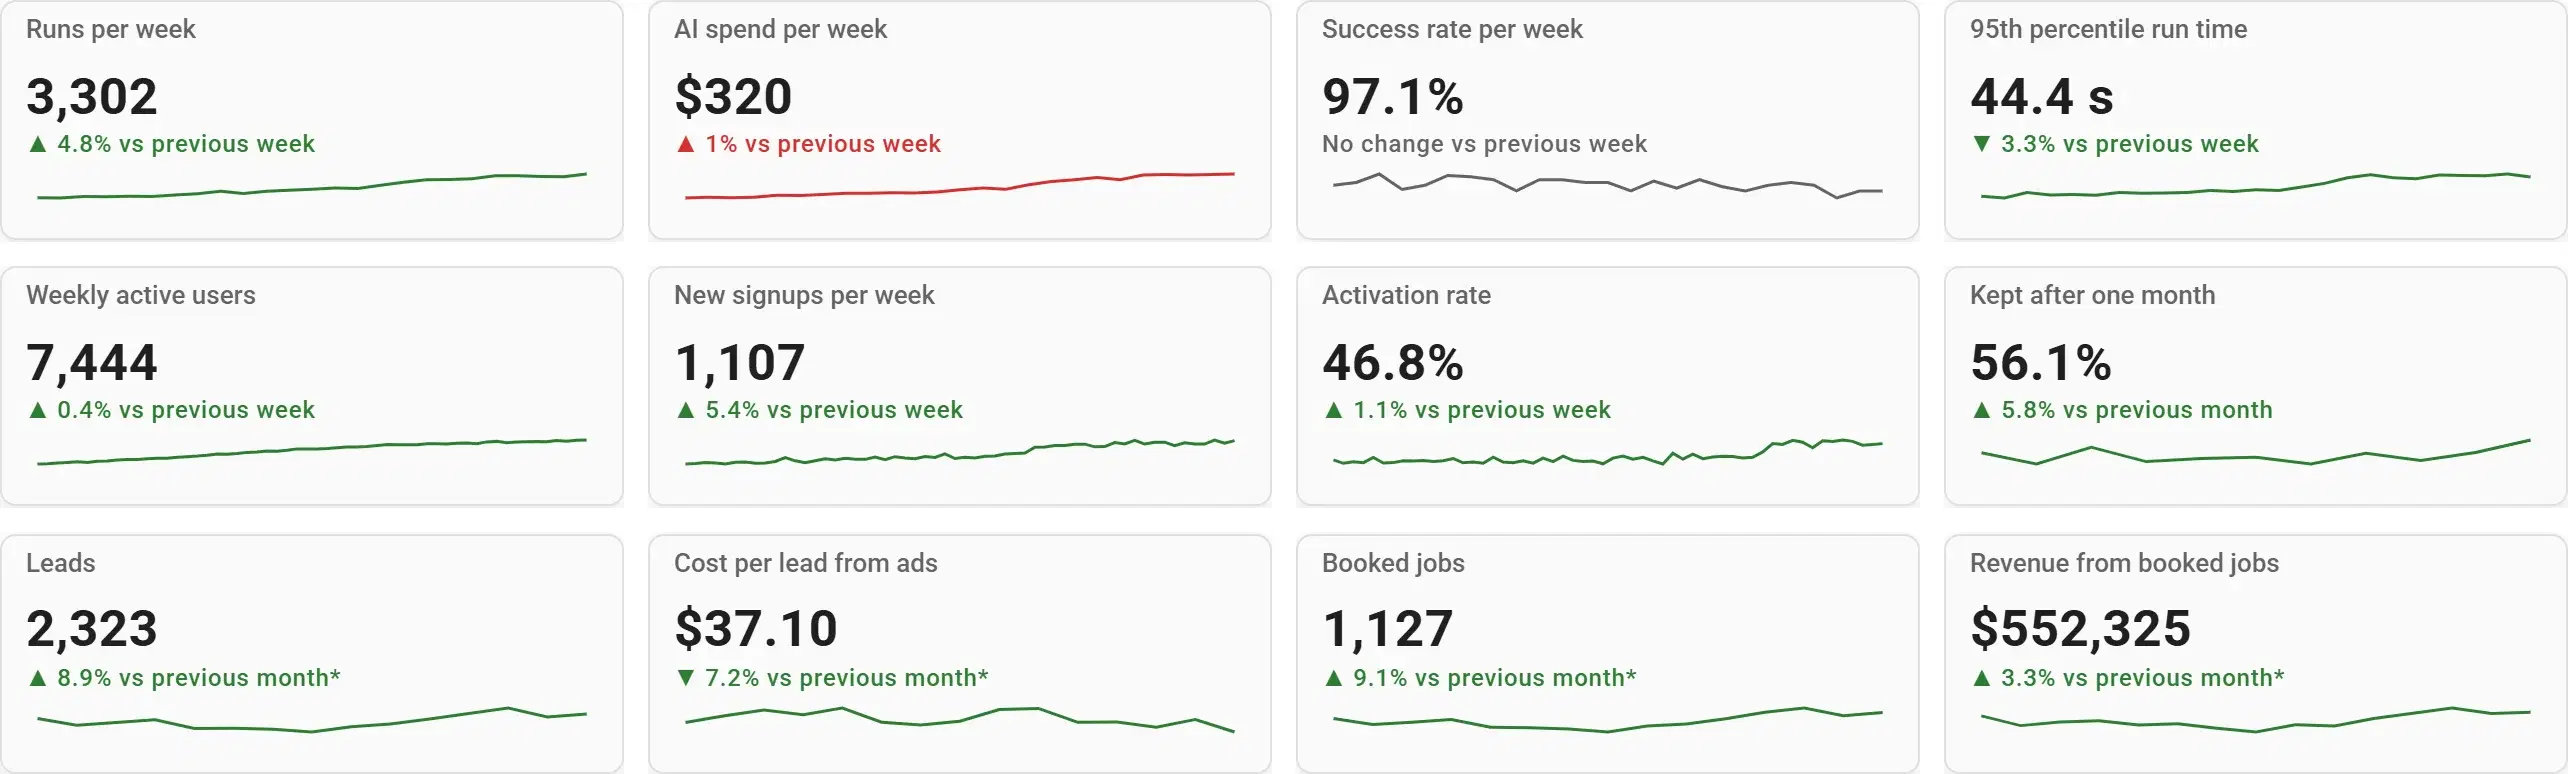
KPI dashboard
KPI dashboard examples from five real dashboards built on invented data — sales, AI agents, a SaaS product, a client report and a solar fleet — with how each KPI is defined, compared and summarised, and the prompt to build yours.
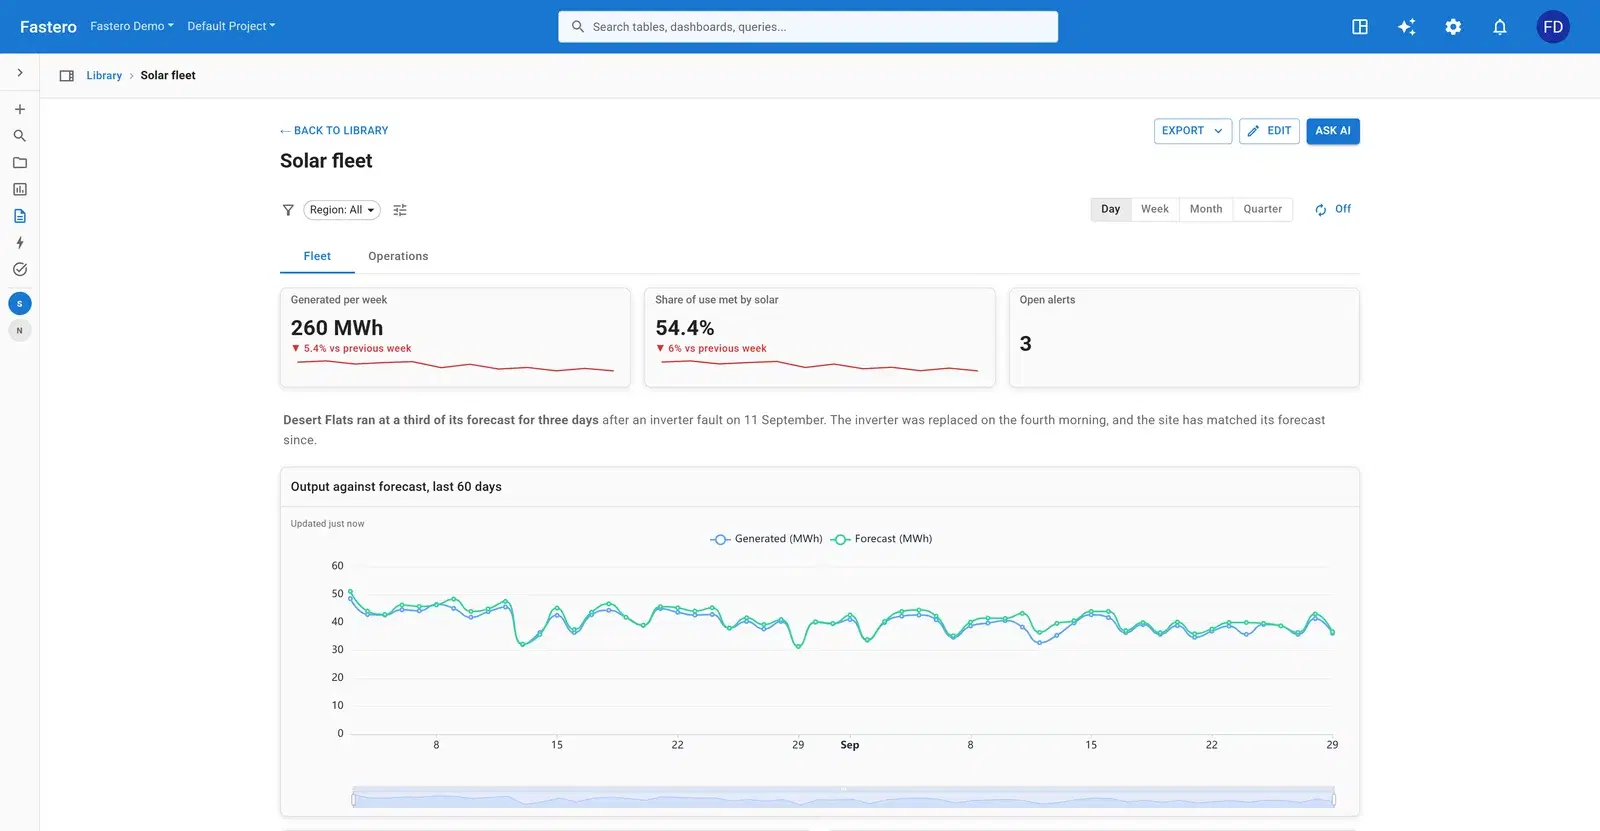
Energy monitoring dashboard
A real energy monitoring dashboard for an invented fleet of twelve solar sites: output against forecast, capacity factor, yield by site, output by hour and alerts — plus the same data in a Streamlit app and a notebook, with the SQL and the prompt.
Build one from your data
- Connect your database or a Google Sheet, or upload a file.
- Describe the dashboard in plain English — or paste the prompt from the example closest to what you need.
- Check the numbers, then adjust any chart by asking or by editing it.
- Invite your team, or schedule the dashboard to arrive by email every Monday.
Working in Claude? The same dashboards can be built from a conversation through Fastero's Claude connector. For the steps without AI, see how to create a dashboard.
Questions people ask
Are these dashboard templates?
They are worked examples rather than files to download. Each page lists every chart, shows how the key numbers are calculated in SQL and gives the prompt that builds a dashboard like it from your own data in Fastero, so the result fits your tables instead of someone else’s.
How were these dashboards made?
Each was built in Fastero’s demo workspace through its MCP server — the same tools Claude uses through Fastero’s connector — from saved SQL queries over invented data. The data is dated from today, so the numbers move; the pictures are captioned "Sample data".
What data do I need to build one?
A database Fastero can connect to, such as Postgres or MySQL, a Google Sheet, or a file you upload. Each example lists the tables it reads, and the prompt names the columns it expects.
Can I share a dashboard with people who don’t use Fastero?
Invite them to your workspace — viewers are free — or schedule the dashboard to arrive by email as a PDF. Each invited person signs in and sees the live dashboard.
Describe it, and get the dashboard.
Free plan, no card needed. Every new account gets 14 days of Pro.