 Fastero Dev Team
Metabase is the open-source BI tool many teams install first: point it at a database, build charts with a point-and-click query builder or SQL, and arrange them into dashboards. The best example dashboards aren't in a gallery somewhere. They ship inside Metabase itself, and you can open them in five minutes.
The short answer: "Every new Metabase comes with an example dashboard, E-commerce insights", in a collection called Examples: three tabs, four filters and about 22 charts on an invented shop's data. Metabase's X-rays will also build a dashboard from any table in one click, which you can save and edit. We ran the current version, Metabase 65 (released 3 November 2026), with Docker and took the screenshots below. Open Source Metabase is free to self-host under the AGPL; Metabase Cloud starts at $100 a month.
Fastero
Connect your database. Ask questions. Get dashboards.
Postgres, BigQuery, Snowflake, and 10+ sources — live-connected, AI-powered, no dashboard builder learning curve.
Try free →How we got these
One Docker command starts a local Metabase with its bundled Sample Database of invented orders, products, people and reviews:
docker run -d -p 3000:3000 --name metabase metabase/metabaseIt was ready in about 20 seconds. After the setup wizard (your name, an email and a password), the Examples collection holds the dashboard below. The sample data's dates run into 2029; they're invented and move with time, so don't read them as real years. For anything beyond a trial, note Metabase's warning about this setup: "Metabase ships with an embedded H2 database that uses the file system to store its own application data." Move that to Postgres or MySQL before people depend on it.
1. E-commerce Insights: the overview tab
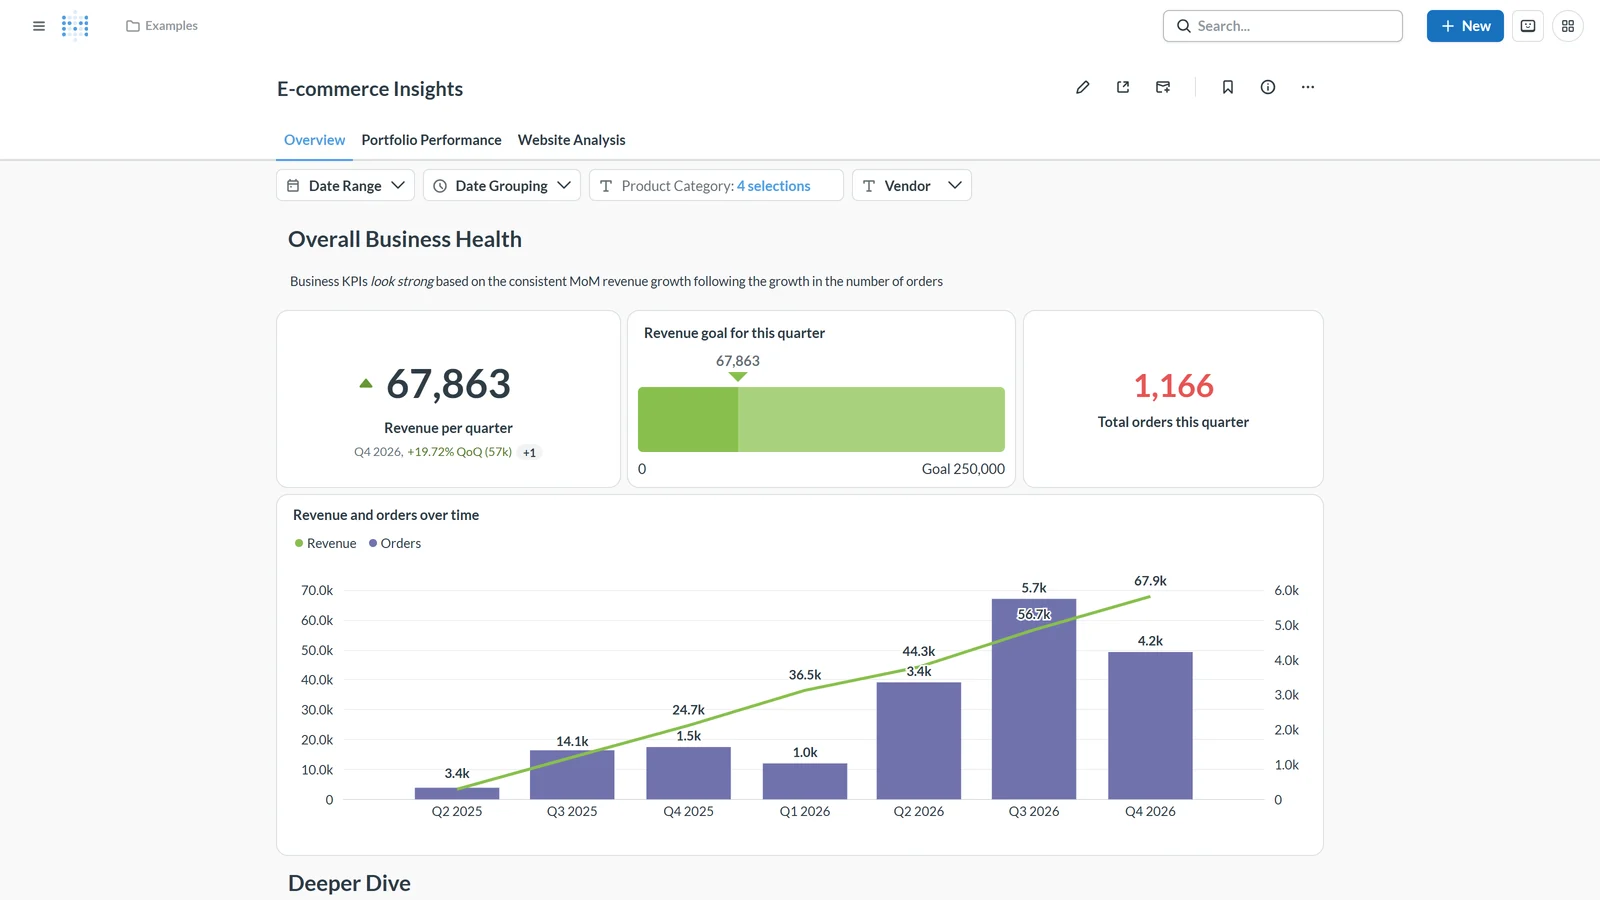
What it does well:
- The conclusion is written down. A text card under "Overall Business Health" says what the numbers mean before you read them.
- Every number has context. Revenue shows its change on the previous quarter, the goal card shows how far there is to go, and orders sit beside them.
- Filters in one row at the top, applying across all three tabs. Metabase separates two kinds: "Filters determine what data to show." and "Parameters determine how to show the data." Date Grouping is the second kind: it changes how the charts group time, not which rows they include.
Below the fold, a "Deeper Dive" section adds a donut of revenue by category, stacked revenue by category over time, orders against a goal line, and a pivot table with conditional formatting.
2. A filter in use
Picking only "Gizmo" in the Product Category filter re-runs every card on the tab: revenue per quarter drops from 67,863 to 15,576, orders from 1,166 to 277, and the chart rescales.
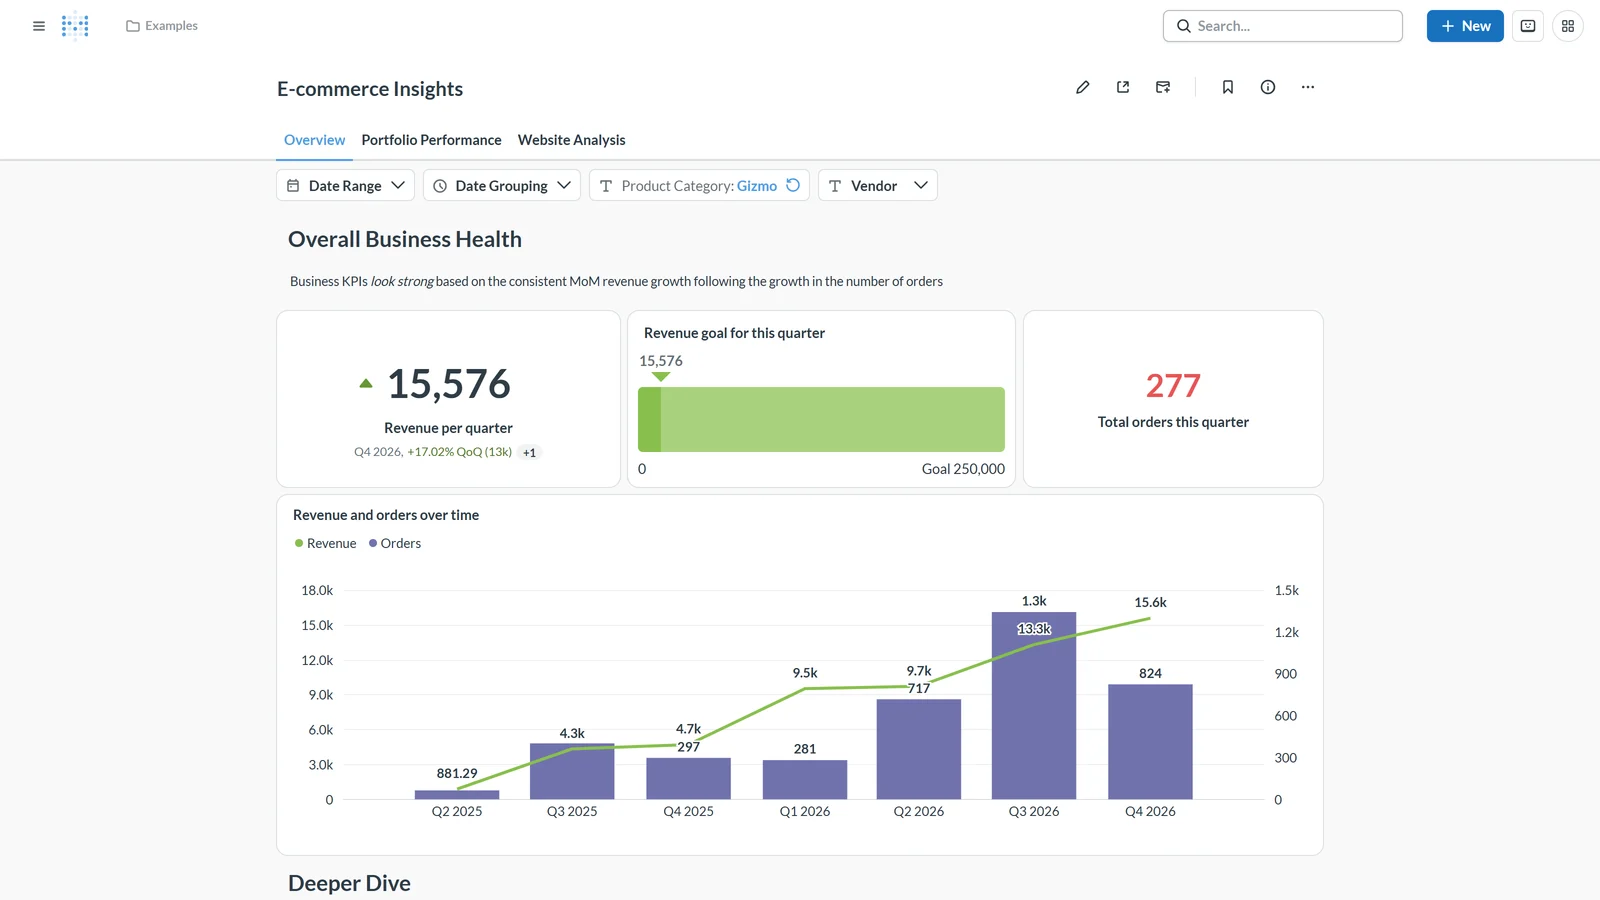
"Dashboard-level widgets can connect to cards on the entire dashboard, across all tabs." You wire each filter to the cards it should affect when you add it, and a card that isn't wired ignores it, which is worth checking when two numbers on one dashboard disagree.
3. Portfolio Performance tab
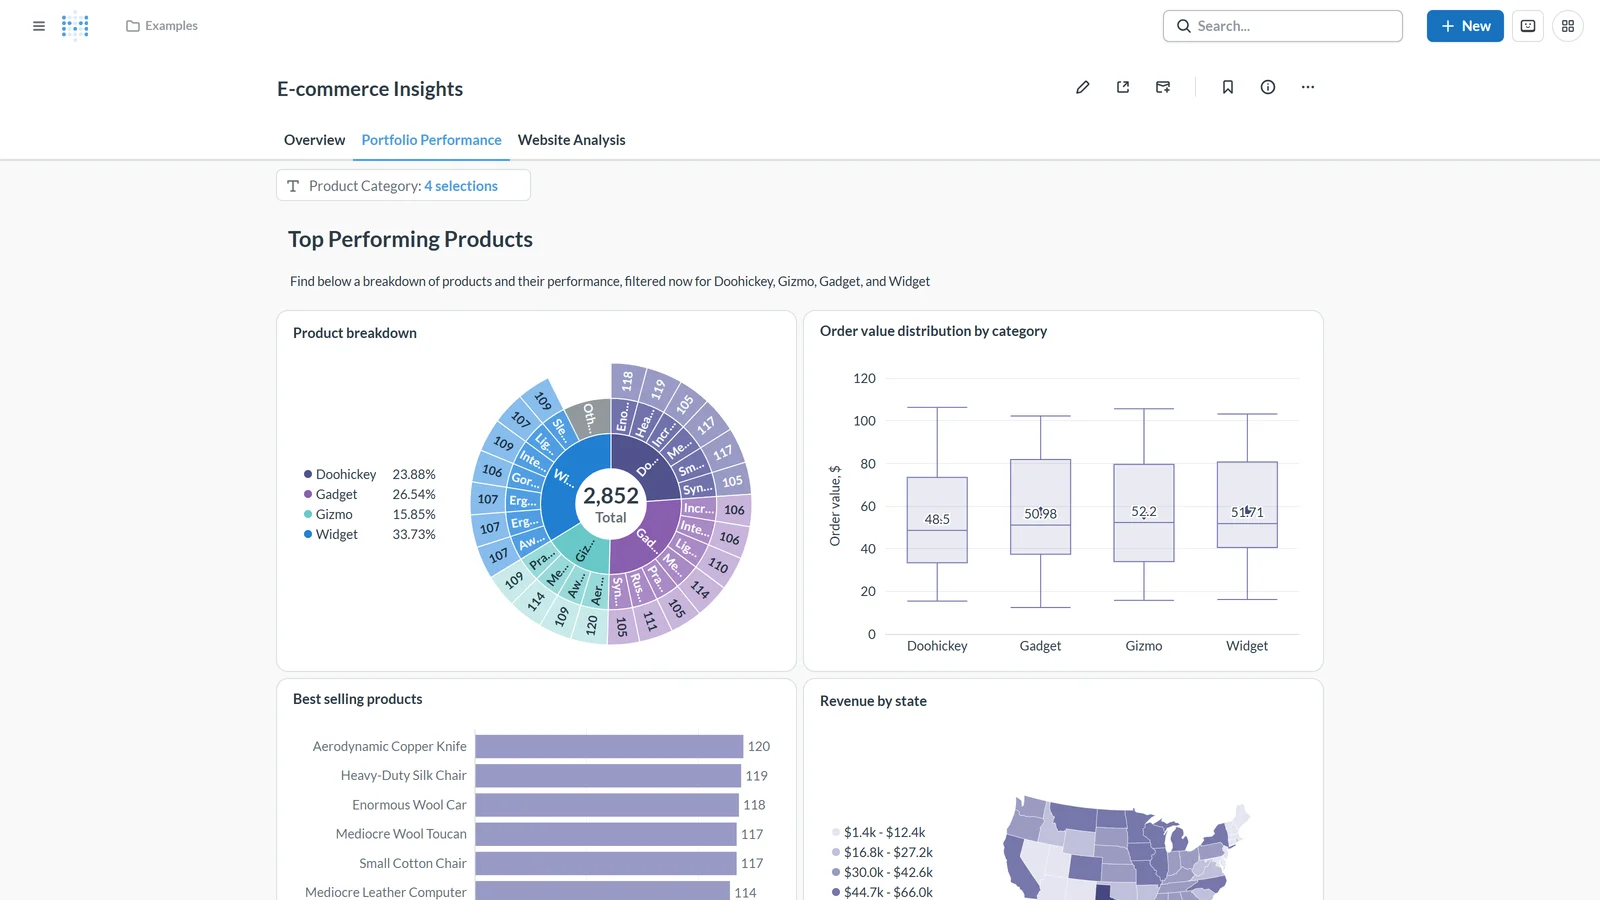
A sunburst of the product range, a box plot of order values by category, best-selling products and revenue by state. Two details worth copying: clicking a bar in "Best selling products" filters the rest of the dashboard to that product (Metabase calls this click behaviour), and the text card repeats the current filter, "filtered now for Doohickey, Gizmo, Gadget, and Widget", so a screenshot passed around still says what it shows.
4. Website Analysis tab
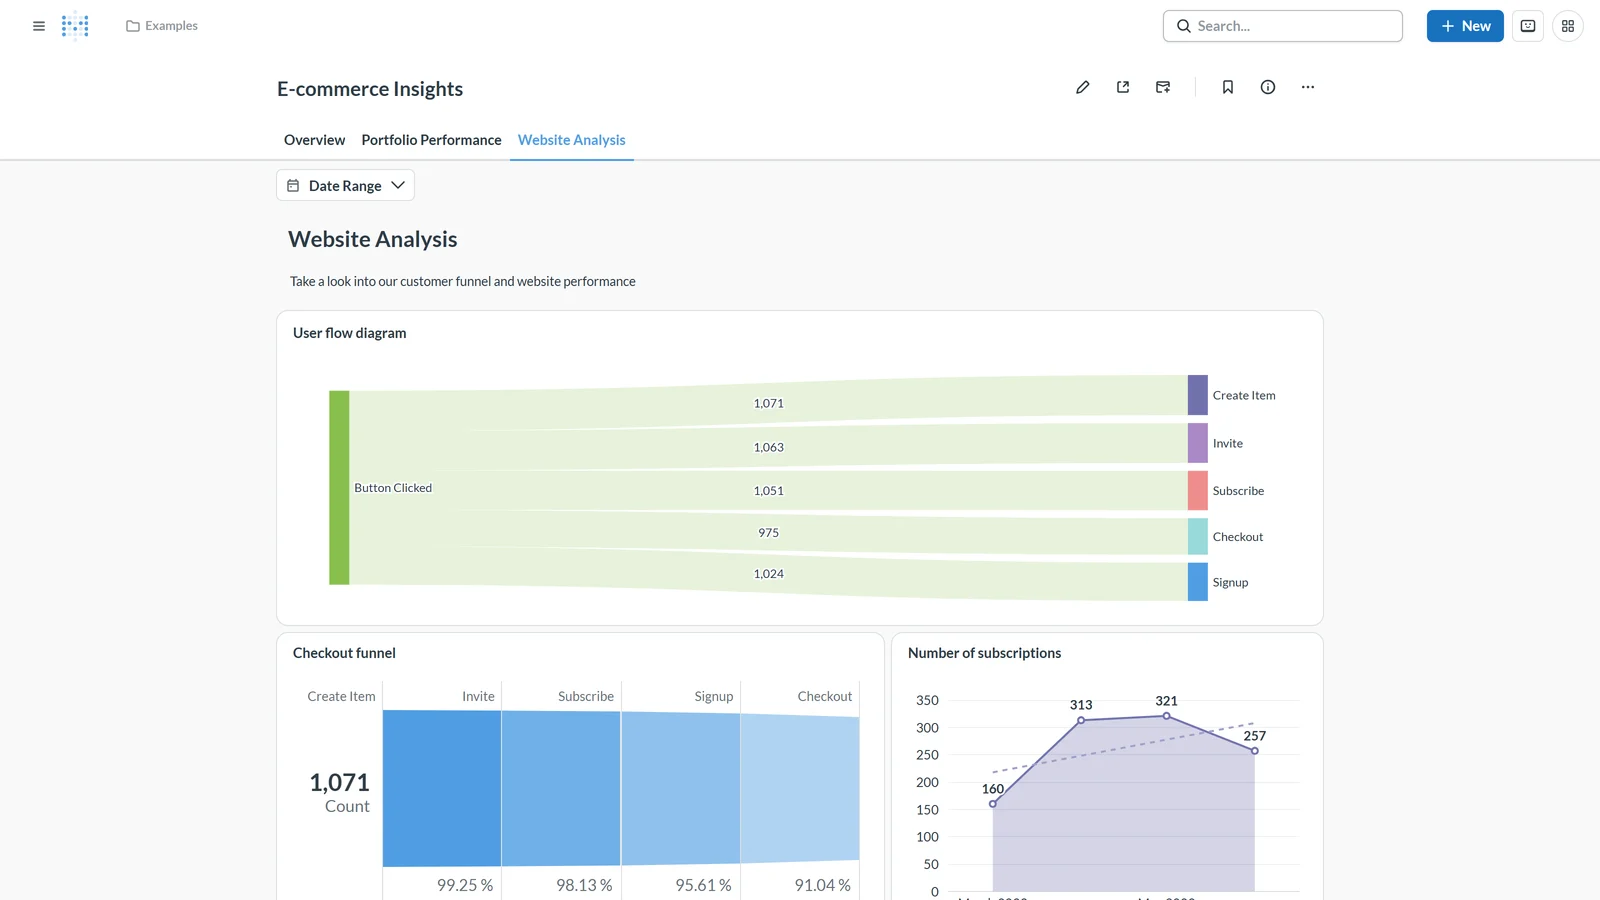
Product-analytics charts on the same dashboard: a Sankey diagram of how visitors move between pages, a checkout funnel and a subscriptions trend. Tabs are what make one dashboard work for three audiences without becoming a wall of charts: "You can add multiple tabs to a dashboard to keep your cards organized."
5. An X-ray: a dashboard in one click
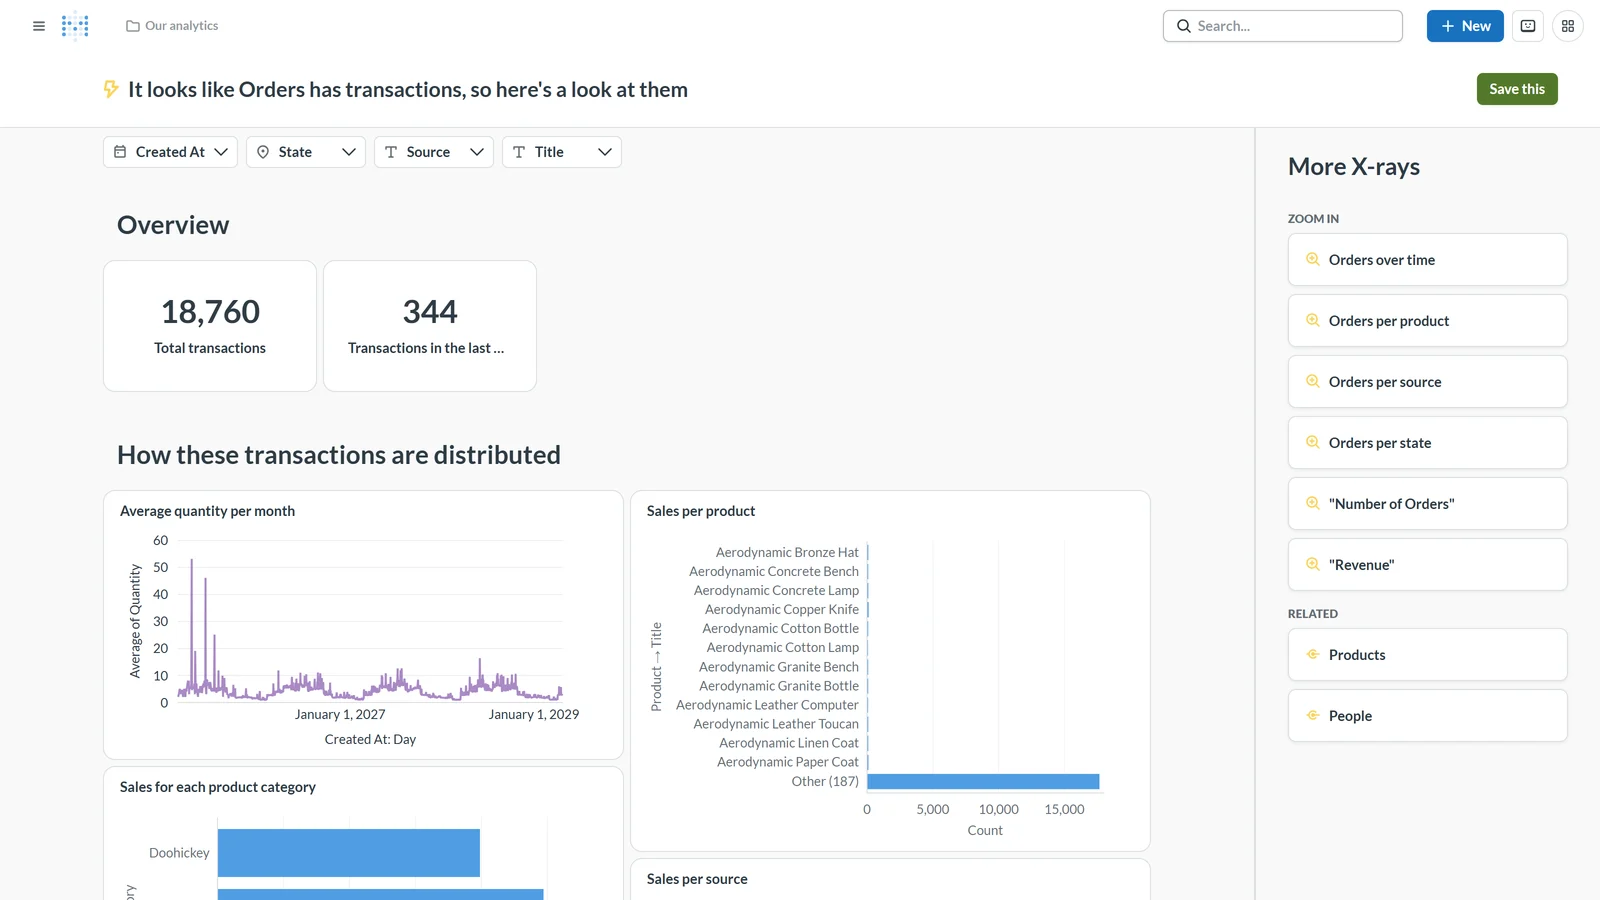
"X-rays are a way to get automatic insights and explorations of your data." On a fresh install the home page offers eight of them on the sample tables. The Orders X-ray builds filters, two headline numbers and a page of distributions on its own, with a panel of related X-rays to zoom into:
Zooming into "Orders over time" gives the time-pattern dashboard most teams build by hand: transactions per day, by day of the week, by hour, by month of the year and by quarter.
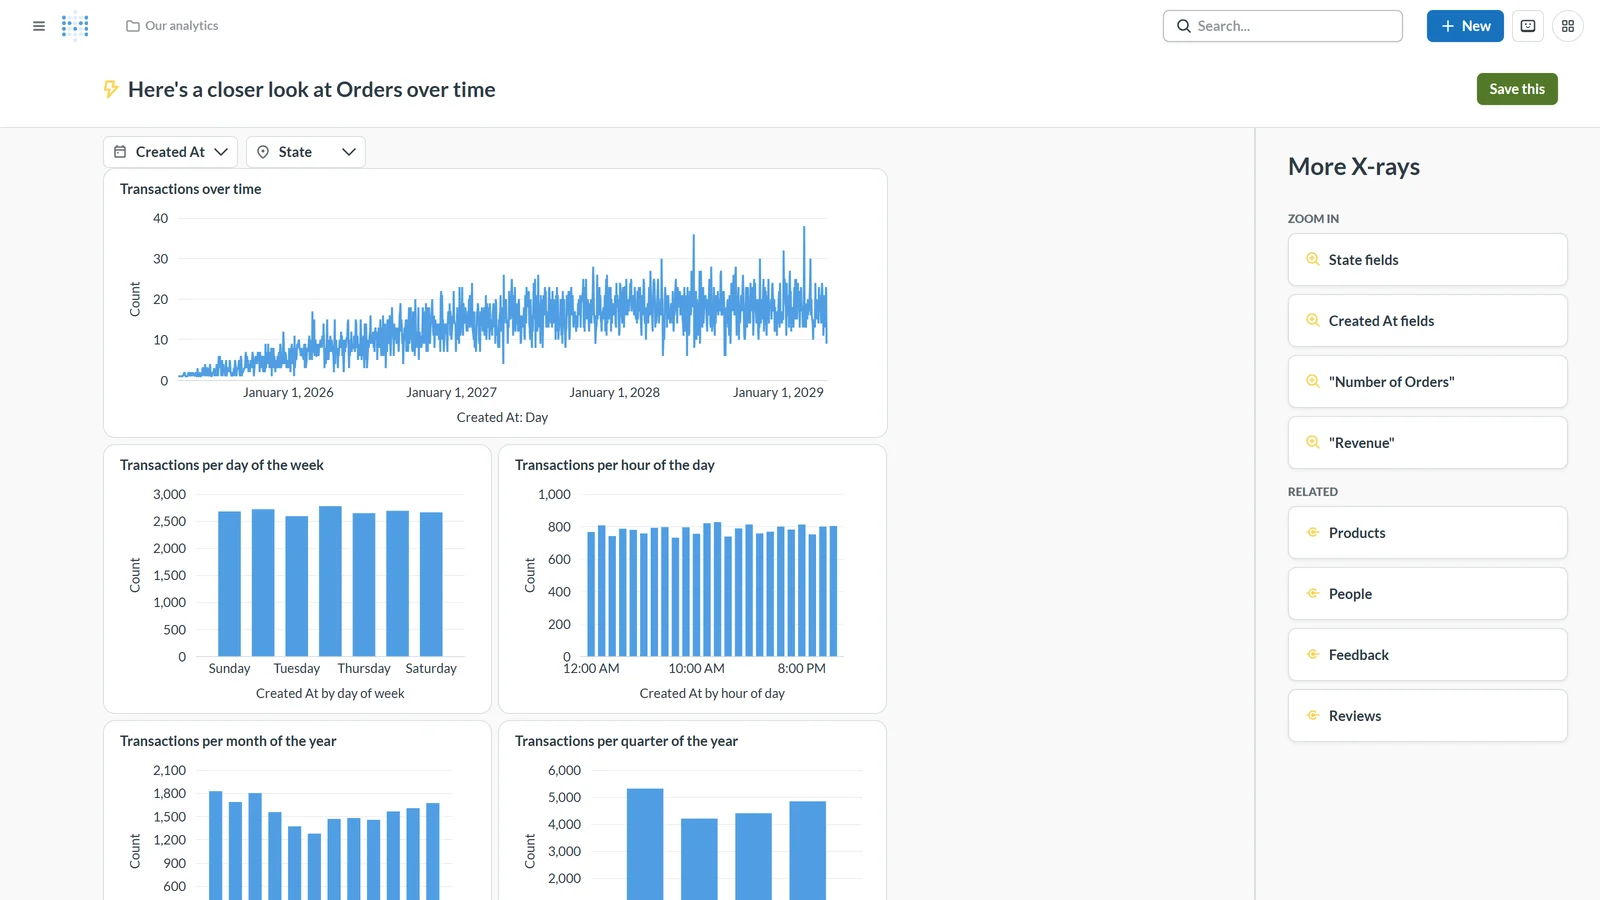
Two honest caveats. X-rays guess, and they don't always guess the same: loading the Orders X-ray again 20 minutes later gave different filters and a monthly chart instead of a daily one. And on tables without a clear measure, such as Products and Reviews, they mostly chart when rows were added. Treat them as a first draft: "you can save its cards and filters as a dashboard by clicking the green Save this button", then delete what doesn't help.
6. Building a chart with the query builder
"Metabase includes a graphical query builder that lets you build interactive charts by building a query step by step from building blocks like filters and summaries." This question takes the Orders table, keeps only the Gadget category, and sums order totals by month:
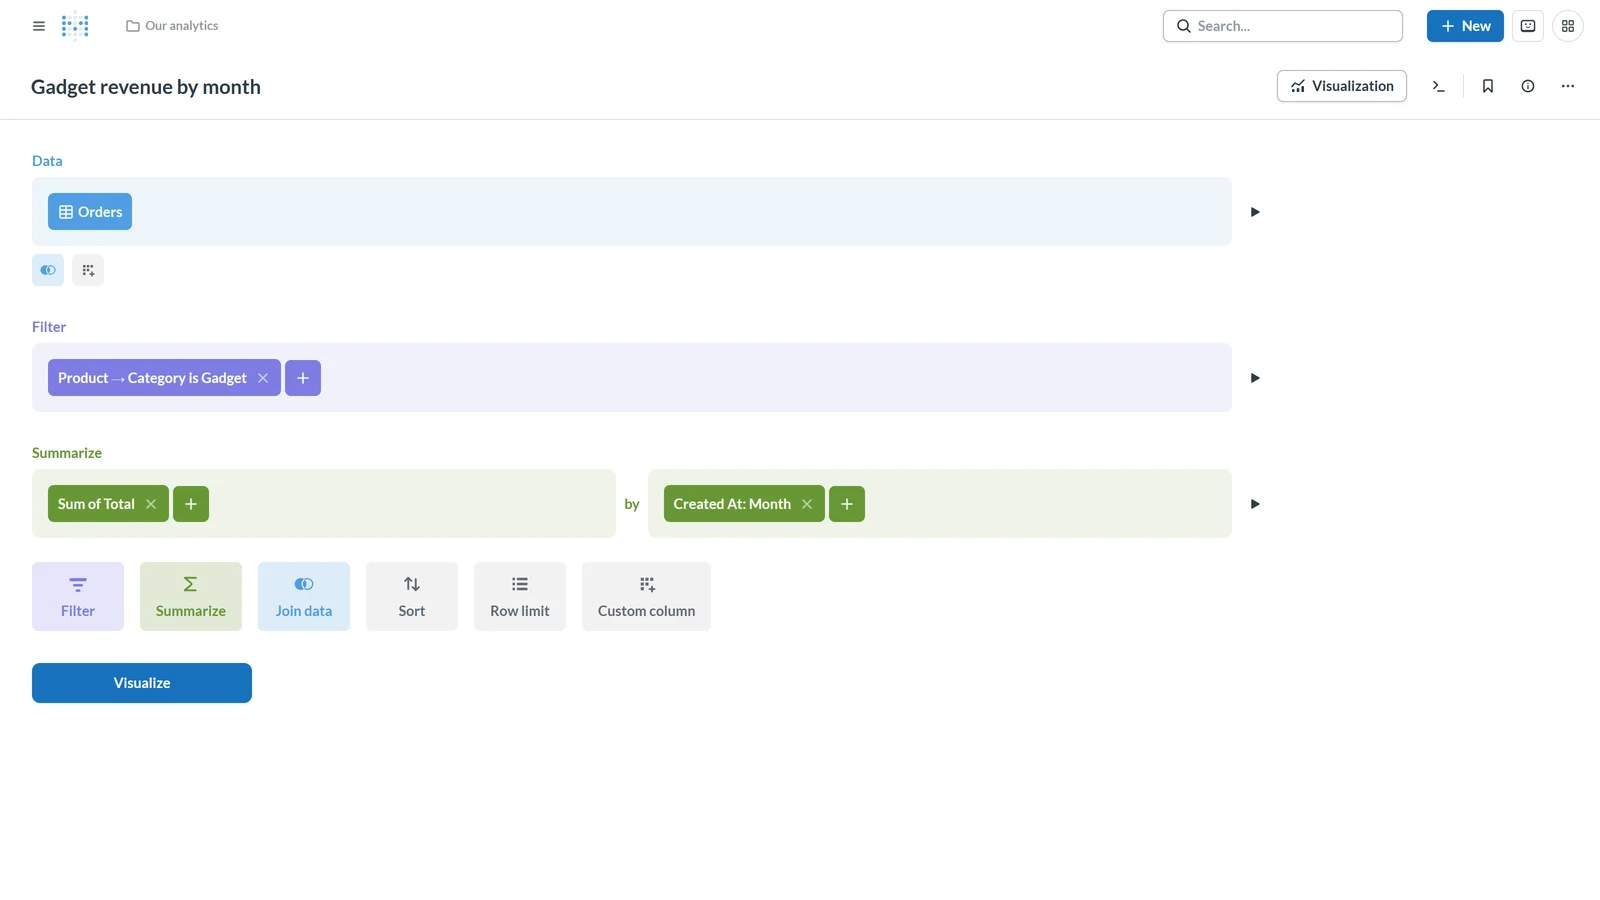
Save it, add it to a dashboard, and wire it to the dashboard's filters. Metabase's own advice is to "Prefer GUI questions to native queries" where you can.
Connect any database. Ask in plain English.
Start free →More examples to look at
- metabase.com/dashboards: a gallery of template dashboards by team and use case, such as sales pipeline, budget against actuals, accounts-receivable ageing and ad spend pacing, organised by team.
- metabase.com/examples: real public dashboards built by Metabase users, including UNESCO and Cal.com. "Explore real life examples built by real Metabase users."
What Metabase says makes a good dashboard
Metabase's guide to dashboards is short and practical:
- "Business intelligence dashboards should help inform decisions." If nobody would act differently after reading a card, drop it.
- "Often what you really need is just a mix of time series and tables."
- "it's better to have a dashboard that requires some scrolling than to omit relevant and critical signals." That's a different view from Power BI's one-screen rule; Metabase's tabs and sections make long dashboards readable.
- "you'll probably end up putting your most important cards at the top left."
How to build your own
- Start Metabase (the Docker command above, or Metabase Cloud) and connect your database.
- Open Examples → E-commerce Insights to see the pieces, or X-ray one of your own tables and click Save this.
- Build questions with + New → Question: pick a table, filter, summarise, choose a chart, save.
- Create a dashboard, add the questions, and use sections ("templates with headings and pre-arranged cards") for a quick KPI grid.
- Add filters and connect each one to the cards it should change.
- Set up the rest as needed: click behaviour, auto-refresh ("1, 5, 10, 15, 30, and 60 minute intervals"), a PDF export, or a subscription that emails or Slacks the dashboard, "even to people who lack an account in your Metabase."
What Metabase costs in November 2026
| Plan | Price | Users included |
|---|---|---|
| Open Source (self-hosted) | Free, AGPL licence | Unlimited |
| Starter (Cloud) | $100 a month | 5, then $6 per user a month |
| Pro (Cloud or self-hosted) | $575 a month | 10, then $12 per user a month |
| Enterprise | From $20,000 a year | Custom |
Yearly billing takes 10% off. Some dashboard features need Pro or Enterprise, including caching dashboard results and letting each subscriber set their own filter values.
If you'd rather not run a BI server
Metabase rewards the team that hosts it: a server, an application database, upgrades, and someone who builds the questions. If what you need is dashboards from SQL your team already has, Fastero builds them from a query, or lets Claude build them through its connector, with no server to run; editors pay and viewers are free. Our Fastero vs Metabase comparison goes through the trade-offs.
FAQ
Does Metabase come with sample dashboards?
Yes. Every new instance has an Examples collection with the E-commerce Insights dashboard (three tabs, four filters) on the bundled Sample Database, and the home page offers sample X-rays.
What is a Metabase X-ray?
A dashboard Metabase builds automatically from a table or a chart, with filters, summary numbers and distributions. You can save it as an ordinary dashboard and edit it.
Is Metabase free?
The Open Source edition is free to self-host under the AGPL with unlimited users. Metabase Cloud starts at $100 a month for Starter with five users; Pro is $575 a month.
How do I add a filter to a Metabase dashboard?
Edit the dashboard, add a filter of the right type (date, category, ID and so on), and connect it to each card it should filter. Dashboard filters can apply across every tab.
Can Metabase email a dashboard on a schedule?
Yes. Dashboard subscriptions send the results by email or Slack, including to people without a Metabase account. Alerts on a single question can also go to a webhook.
What data is in Metabase's Sample Database?
Invented data for a shop: Accounts, Analytic Events, Feedback, Invoices, Orders, People, Products and Reviews. Its dates move forward over time.
Related reading:
- Best Metabase alternatives
- Metabase vs Power BI
- Grafana dashboard examples
- Power BI dashboard examples
- SQL query examples
Sources: Metabase: dashboards, dashboard filters, interactive dashboards, subscriptions, X-rays, query builder, running on Docker, dashboard best practices, Metabase 65, pricing, licence, template dashboards, examples. Screenshots from Metabase v0.65.3.6 run locally with its Sample Database on 8 November 2026.
Try Fastero free — dashboards from your SQL, or built by Claude, with no BI server to run and free viewers. No credit card required.