 Fastero Dev Team
A KPI dashboard is one screen of the few numbers a team is judged on, each shown against a target or the period before. Most examples online are mockups or stock art and stop at naming the KPIs. Every dashboard below is a real Fastero dashboard, running on a database of invented data, and each comes with how its numbers are calculated and what to leave off.
The short answer: a good KPI dashboard puts four to seven numbers at the top, each compared with last period or a target, then one chart of the main trend, then the breakdowns that explain a change. What goes on it depends on the team: MRR, retention and runway for leadership; pipeline coverage and win rate for sales; cost per customer by channel for marketing; first reply time and satisfaction for support; freshness and failed jobs for a data team. Leave off anything nobody would act on.
Fastero
Connect your database. Ask questions. Get dashboards.
Postgres, BigQuery, Snowflake, and 10+ sources — live-connected, AI-powered, no dashboard builder learning curve.
Try free →What every good KPI dashboard does
The rules are old and well agreed. Stephen Few defined a dashboard in 2007 as a "single-screen display of the most important information needed to do a job, designed for rapid monitoring", and the guides from Microsoft, Tableau and Nielsen Norman Group since say much the same:
- One screen. "Having all the tiles on one screen is best" (Microsoft). Scrolling is for detail, not for the headline numbers.
- Every number is compared with something. Few's test for a lone figure is "Compared to what?" The previous period, a target, or both.
- The most important number top left, where people start reading.
- Four to ten numbers. Most guides land on five to ten per screen, and fewer for executives. No research fixes the count: the limit is what fits on one screen with its comparison.
- Plain charts. Bars and lines read faster than gauges, 3D or pies. Colour shows status, not decoration.
- Each KPI has one definition, written down, so the dashboard and the monthly report agree.
1. Company overview
For founders and leadership: one or two numbers from each team, not a new set of metrics.
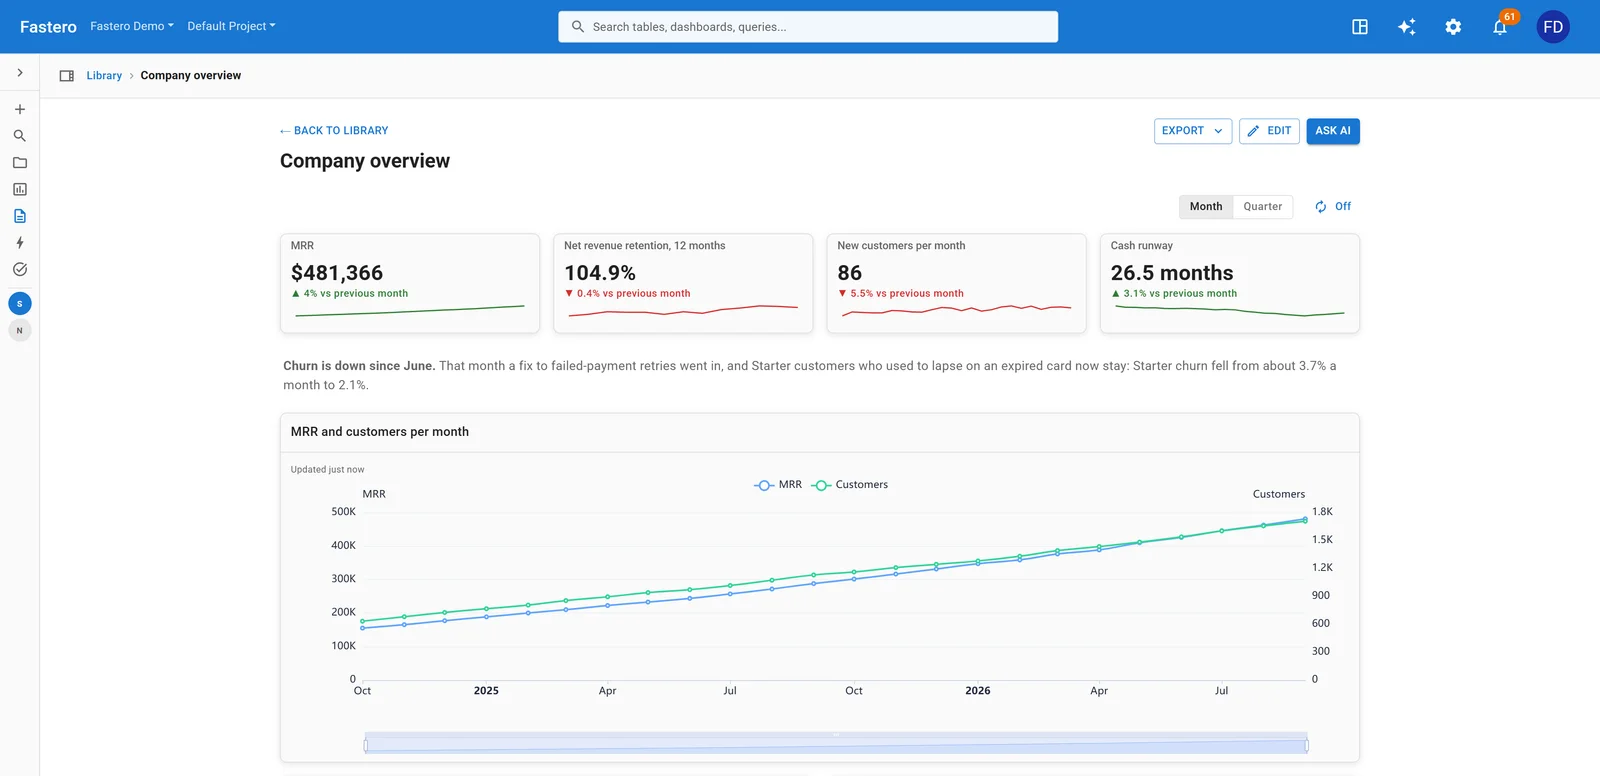
A company overview for a software company. Sample data.
| KPI | How to calculate it |
|---|---|
| MRR | Monthly recurring revenue: the sum of every active subscription's price, normalised to a month |
| Net revenue retention, 12 months | (Starting MRR + expansion + reactivation − contraction − churned MRR) ÷ starting MRR |
| New customers | Customers whose first paid month is this month |
| Cash runway | Cash in the bank ÷ average monthly net burn, in months |
| Won against target | New contract value won this month ÷ the month's sales target |
| Support satisfaction | Tickets rated good ÷ tickets rated |
Leave off: totals that only ever go up, such as signups to date, and anything a team reviews in more detail on its own dashboard. The overview is for spotting which team to ask about.
2. Subscription revenue (SaaS)
For finance and founders at a subscription business.
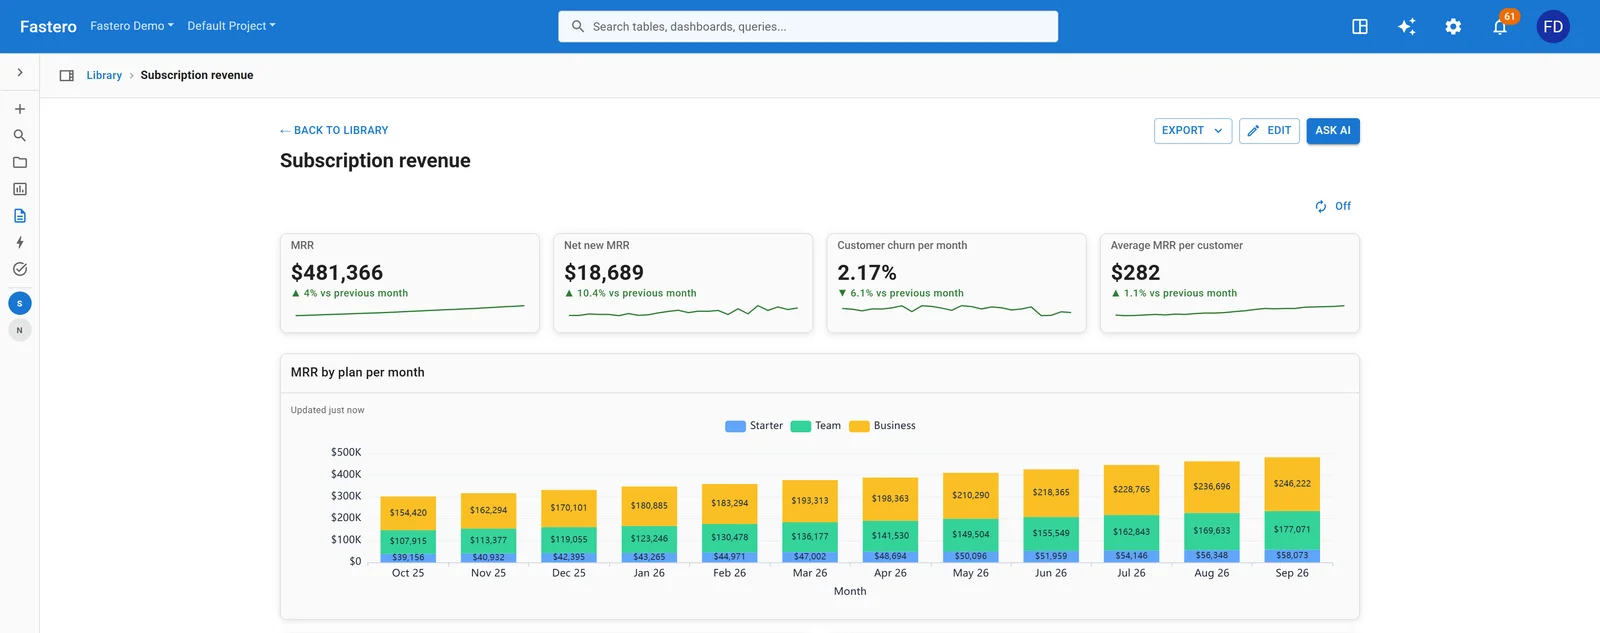
MRR by plan for the last twelve months, under the four numbers that sum it up. Sample data.
| KPI | How to calculate it |
|---|---|
| MRR | Sum of active subscriptions, monthly-normalised; excludes tax, free plans and one-off charges |
| Net new MRR | New + expansion + reactivation − contraction − churned MRR |
| Customer churn | Customers lost this month ÷ customers at the start of the month |
| Revenue churn | (Churned MRR + contraction MRR) ÷ MRR at the start of the month |
| Net revenue retention | As above; gross revenue retention is the same without expansion and reactivation |
| Average revenue per customer | MRR ÷ active customers |
Leave off: lifetime value while the business is young. Stripe's own formula divides revenue per customer by the churn rate, and churn is unsteady at low volume, so the result moves more than the business does.
3. Sales pipeline
For a sales team and its manager, reviewed weekly.
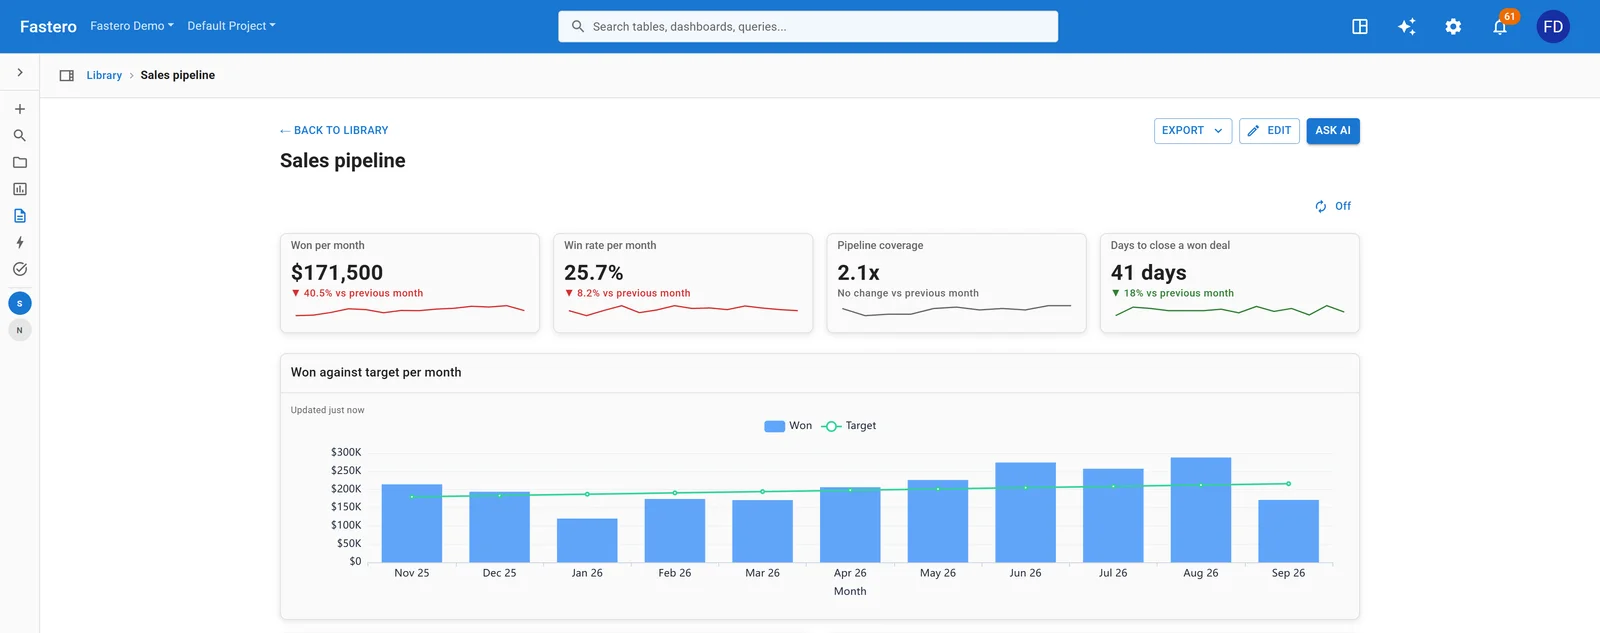
Deals won against the monthly target. Sample data.
| KPI | How to calculate it |
|---|---|
| Won this month | Sum of closed-won deal values; count only whole months |
| Win rate | Deals won ÷ deals closed (won plus lost) in the period; say which denominator you use |
| Pipeline coverage | Open pipeline ÷ the target for the next period; three to four times is the usual rule of thumb |
| Days to close | Median days from a deal's creation to closed-won |
| Average deal size | Closed-won value ÷ closed-won deals |
| Sales velocity | Open opportunities × average deal size × win rate ÷ days to close, which gives revenue per day |
Leave off: activity counts such as calls and emails on the headline view. They belong on a rep's own page, if anywhere.
4. Sales and orders
For a business that sells products: what sold, through which channel, to whom.
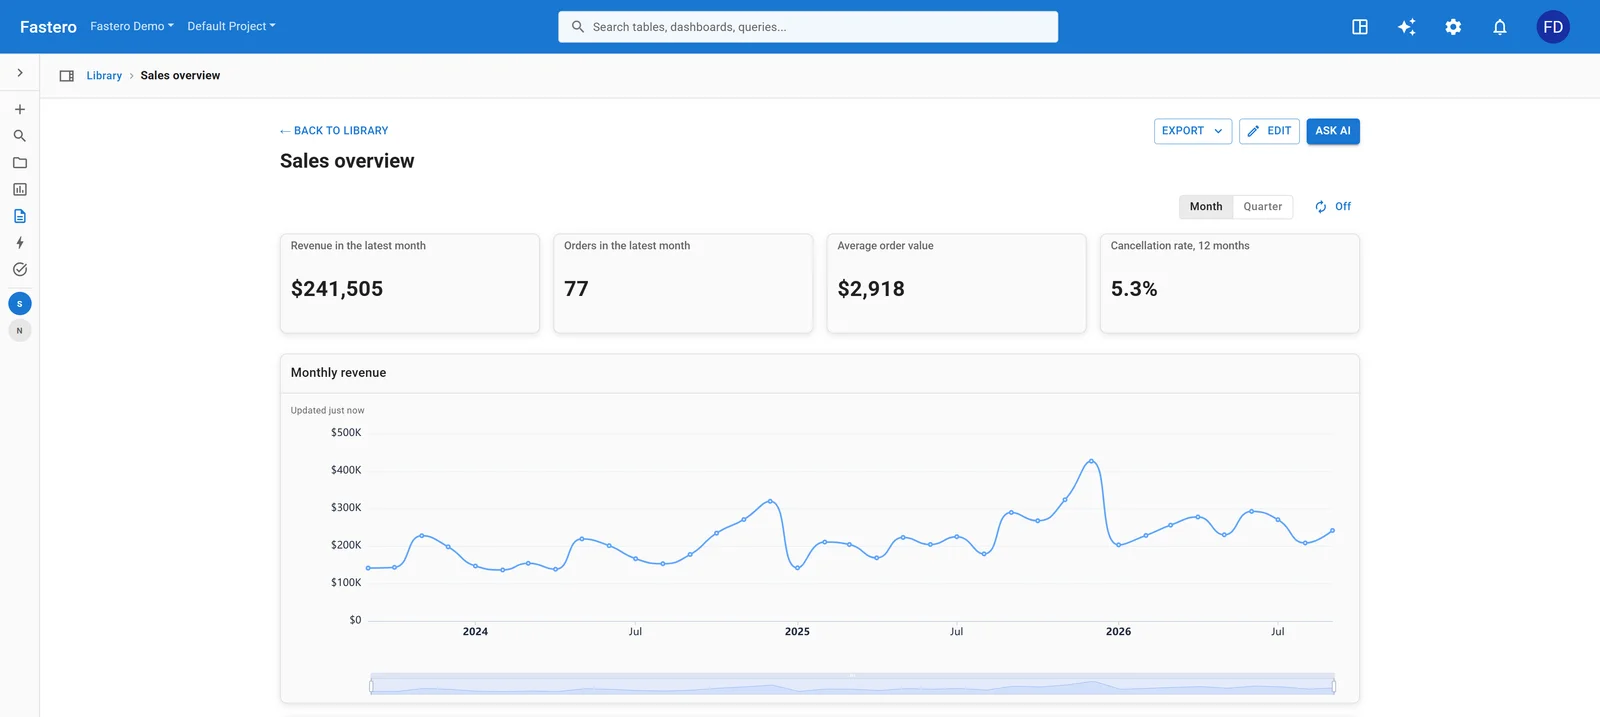
Revenue, orders and products from a sales database. Sample data.
| KPI | How to calculate it |
|---|---|
| Revenue | Sum of order totals, net of refunds |
| Orders | Count of completed orders |
| Average order value | Revenue ÷ orders |
| Revenue by channel | Revenue grouped by where the order came from |
| Top products | Products ranked by revenue, not by units |
| Repeat customers | Customers with more than one order ÷ customers who ordered |
Leave off: cancelled and test orders, filtered out of every number rather than shown as a separate figure.
5. Marketing performance
For a marketing team that spends money to bring in customers.
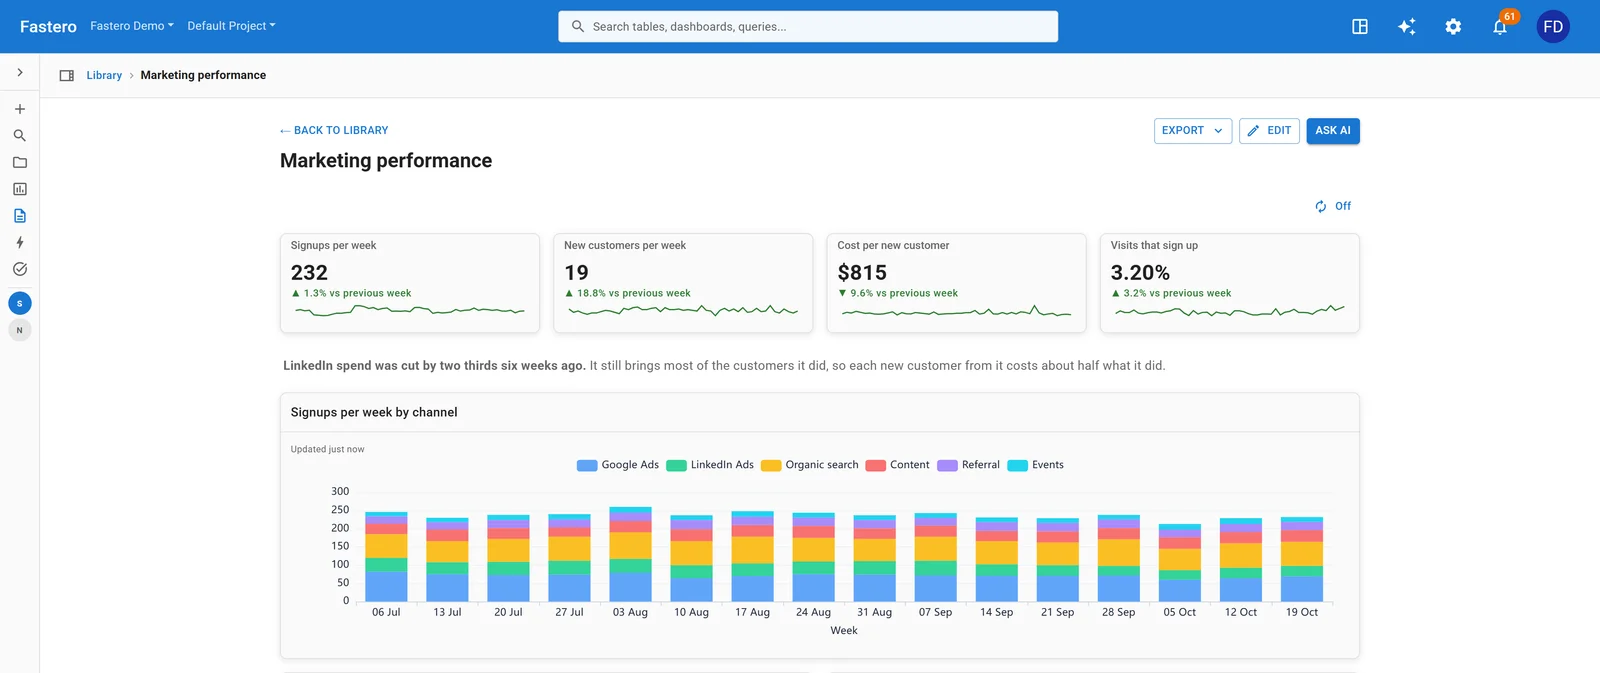
Signups by channel each week, with what a new customer costs. Sample data.
| KPI | How to calculate it |
|---|---|
| Signups | Accounts created in the period |
| New customers | First payments in the period, by the channel that brought them |
| Cost per new customer (CAC) | Marketing spend ÷ new customers; blended across all channels, or paid channels only |
| Visit to signup rate | Signups ÷ visits |
| Cost per customer by channel | Each paid channel's spend ÷ the customers it brought |
| Return on ad spend | Revenue attributed to ads ÷ ad spend |
Leave off: impressions and follower counts on their own. They are inputs, and a channel can grow them while bringing in no one.
6. Agency client report
For an agency or freelancer reporting to a client every month. The client wants to know what changed and why, in one screen.
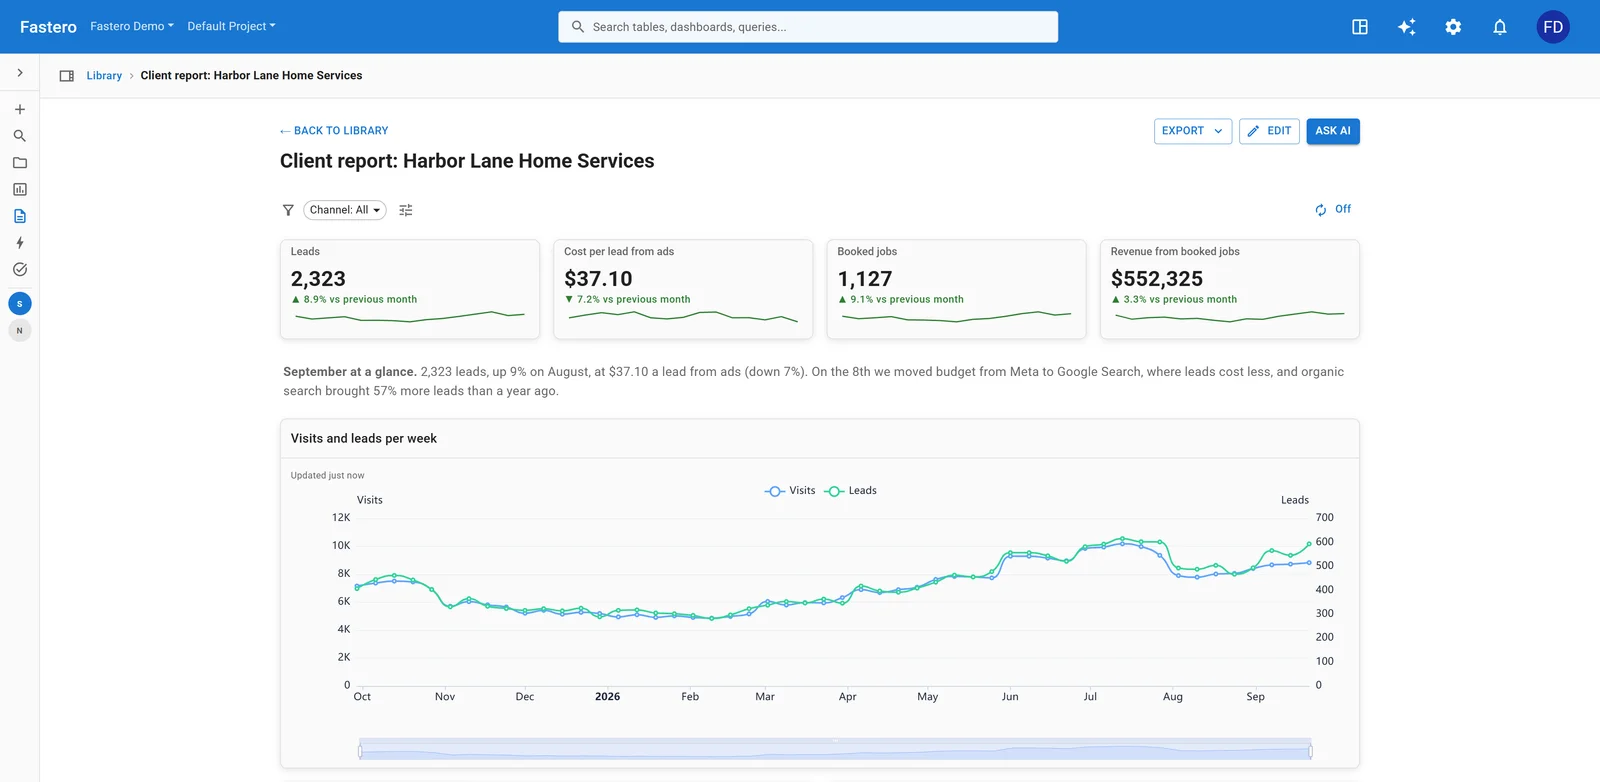
A monthly report for a home-services client, with the month summarised in words. Sample data.
| KPI | How to calculate it |
|---|---|
| Leads | Form fills and calls, from every channel |
| Cost per lead from ads | Ad spend ÷ leads from paid channels |
| Booked jobs | Leads that became paid work |
| Revenue from booked jobs | The client's revenue from those jobs |
| Leads by channel | Leads grouped by source: search ads, social, organic, referral |
| Search clicks and position | From Google Search Console: clicks, impressions, average position |
Leave off: the agency's own activity (posts published, keywords tracked). Write two sentences on what changed instead: AgencyAnalytics' guide puts it simply, "What clients really want is clarity."
7. Product usage and retention
For a product team: are people finding the value, and do they come back?
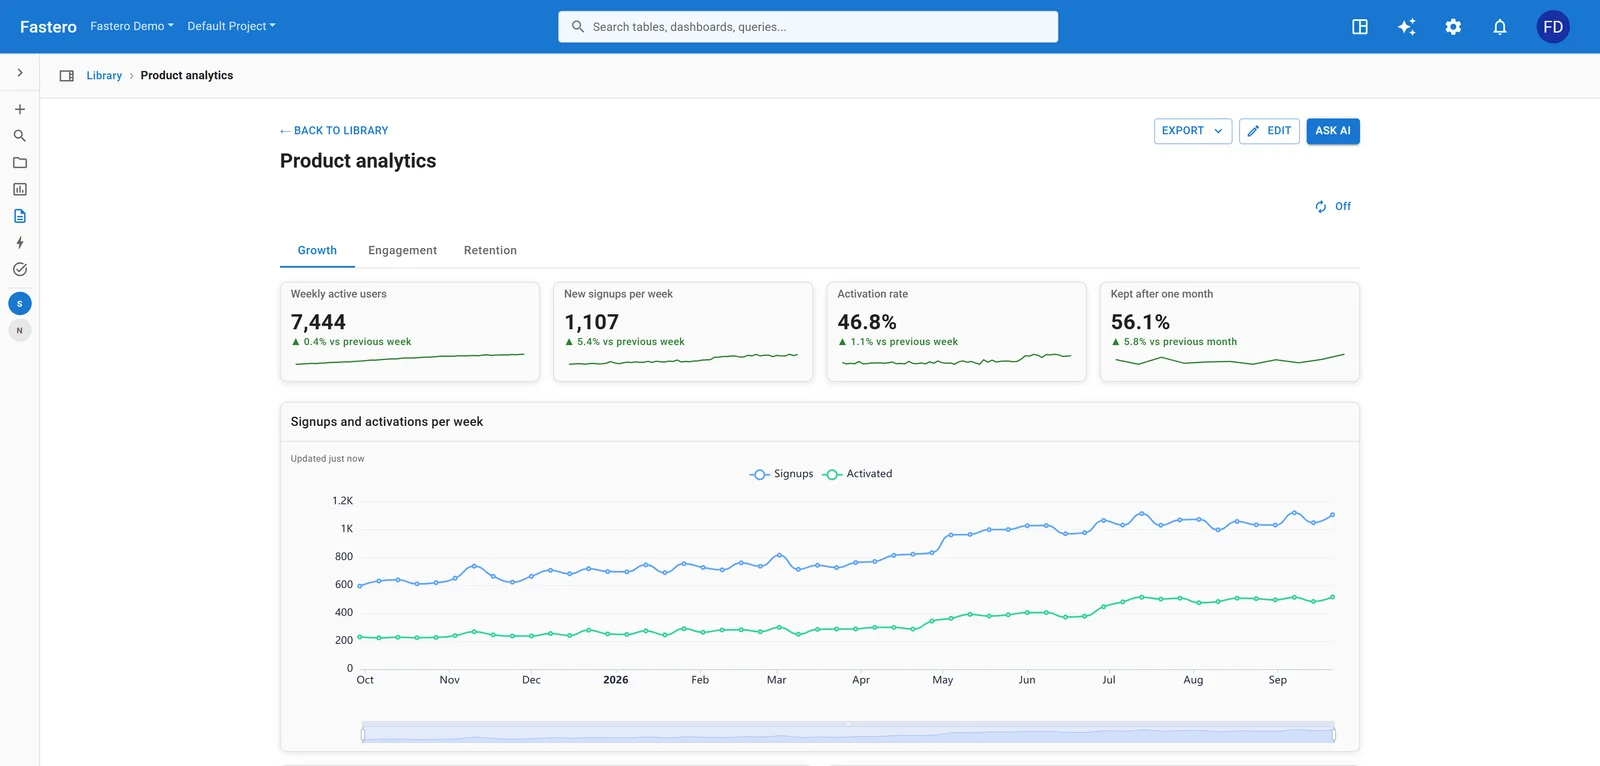
Growth, activation and retention for a software product. Sample data.
| KPI | How to calculate it |
|---|---|
| Weekly active users | Distinct users who did a meaningful action in the week, not just logged in |
| Activation rate | New users who reached the product's first key action ÷ new users |
| Retention after one month | Users from a signup month still active a month later ÷ that month's signups |
| Stickiness | Average daily active users ÷ monthly active users |
| Feature adoption | Users of a feature in the period ÷ active users |
| Retention by signup month | A grid: each signup month against each month after |
Leave off: total signups to date, and page views. Neither says whether anyone got what they came for.
8. Customer support
For a support lead, checked daily.
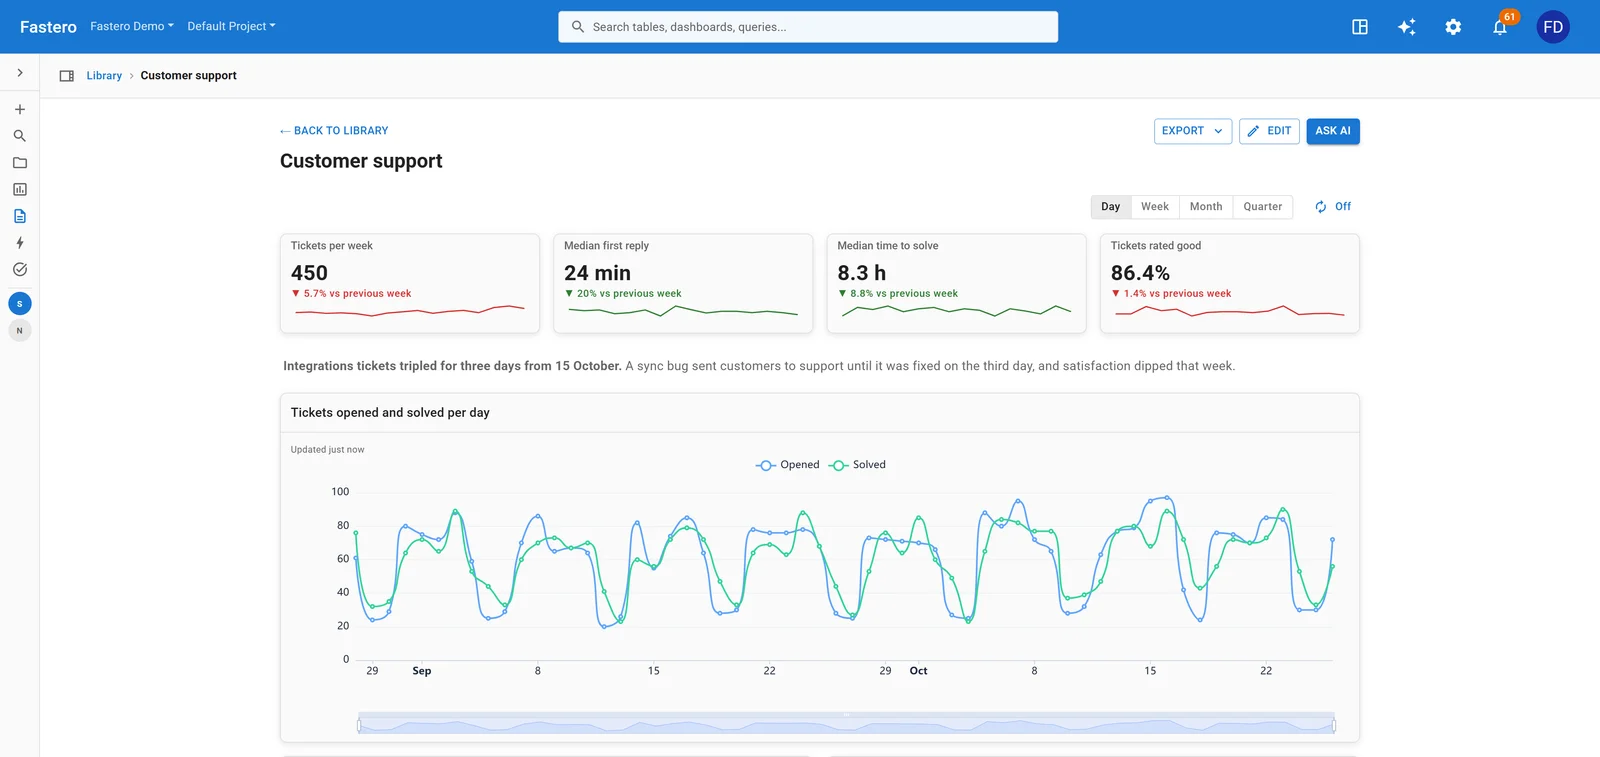
Tickets, reply times and satisfaction. Sample data.
| KPI | How to calculate it |
|---|---|
| Tickets | New tickets in the period, against tickets solved |
| Median first reply | Median time from a ticket's creation to the first reply from an agent |
| Median time to solve | Median time from creation to the ticket being solved |
| Satisfaction (CSAT) | Ratings marked good ÷ all ratings; show how many rated, too |
| Solved in one reply | Tickets solved with a single agent reply ÷ tickets solved |
| Backlog | Open tickets, and how many are older than your target |
Leave off: averages for times. A few tickets left open for weeks drag an average up; the median shows the typical customer's wait.
Connect any database. Ask in plain English.
Connect database →9. Finance: cash and runway
For a founder or finance lead, monthly.
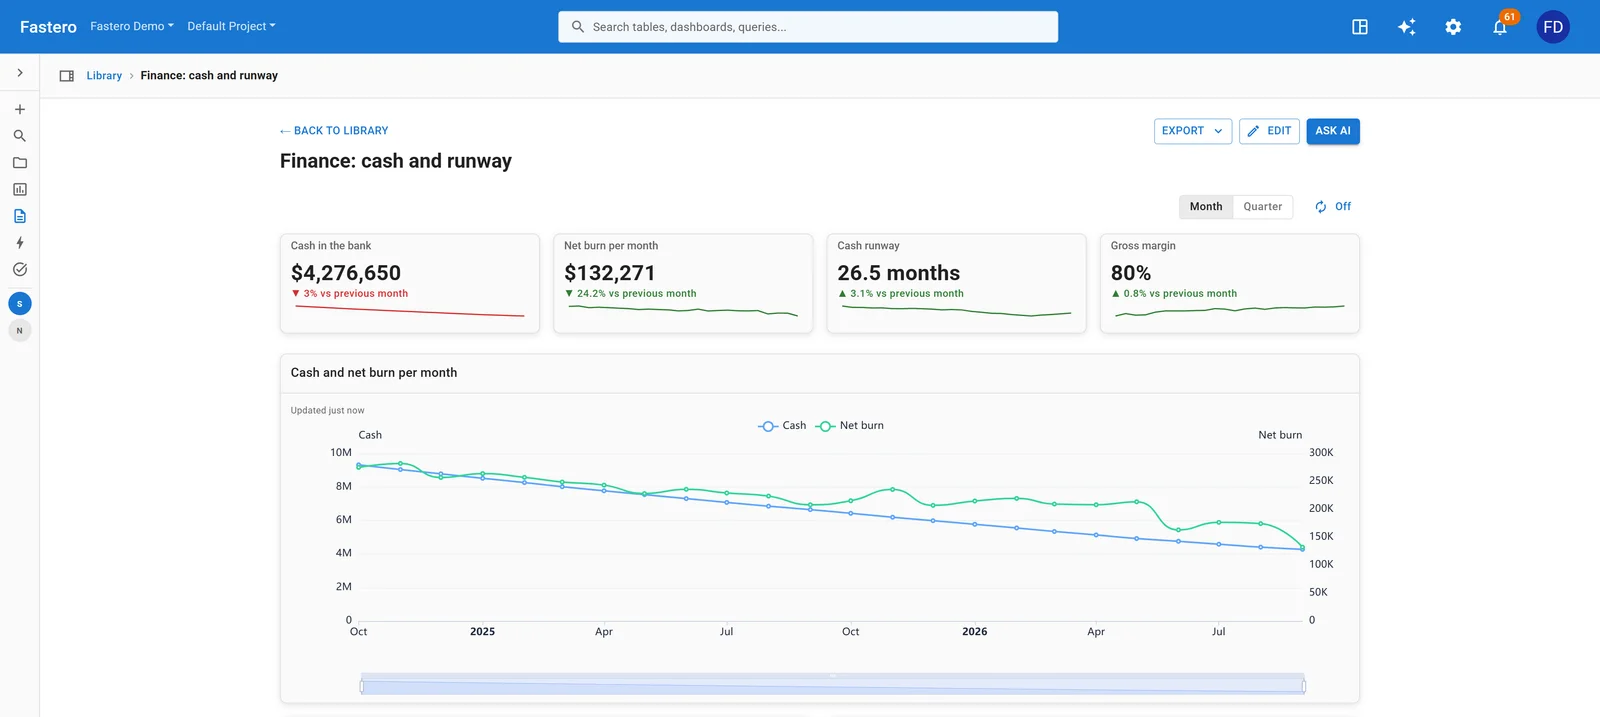
Cash falling as the company spends, with runway still over two years. Sample data.
| KPI | How to calculate it |
|---|---|
| Cash in the bank | Cash at the month's end |
| Net burn | Total spending − revenue, per month |
| Cash runway | Cash ÷ average net burn of the last three months |
| Gross margin | (Revenue − cost of revenue) ÷ revenue |
| Budget against actual | Each spending line's actual against its budget |
| Overdue invoices | Unpaid invoices past their due date, grouped by how late |
Leave off: a single month's burn as the runway's basis. One large payment swings it; an average of three months doesn't.
10. Data platform health
For a data team: is the data on time, and are the jobs behind it working? Few KPI guides cover it at all.
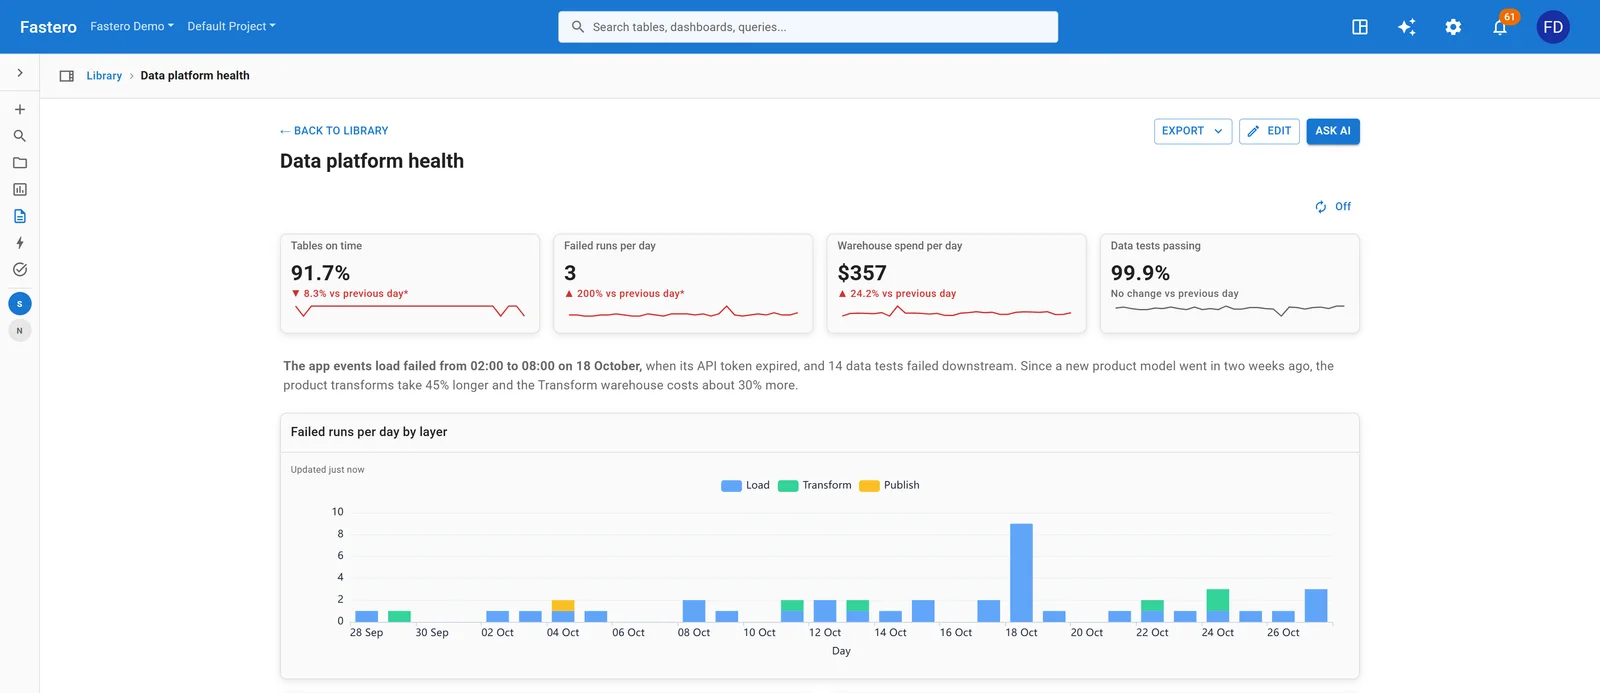
Failed runs per day by layer: the spike is a load whose API token expired. Sample data.
| KPI | How to calculate it |
|---|---|
| Tables on time | Tables whose last successful load is within their allowed age ÷ all tables |
| Failed runs | Jobs that failed in the last 24 hours, by layer: load, transform, publish |
| Warehouse spend | Compute cost per day, against the month's budget |
| Data tests passing | Tests passed ÷ tests run |
| Run time against normal | Each job's median run time this week against its usual median |
| Rows loaded | Rows per day from each source, to catch a load that quietly stopped |
Leave off: individual queries and the people who ran them on the headline view. And remember warehouses report usage late: Snowflake's usage views lag by up to three hours, so a "live" cost tile is never quite live.
11. AI agent operations
For a team running AI agents in production: how much they do, what they cost, how often they fail.
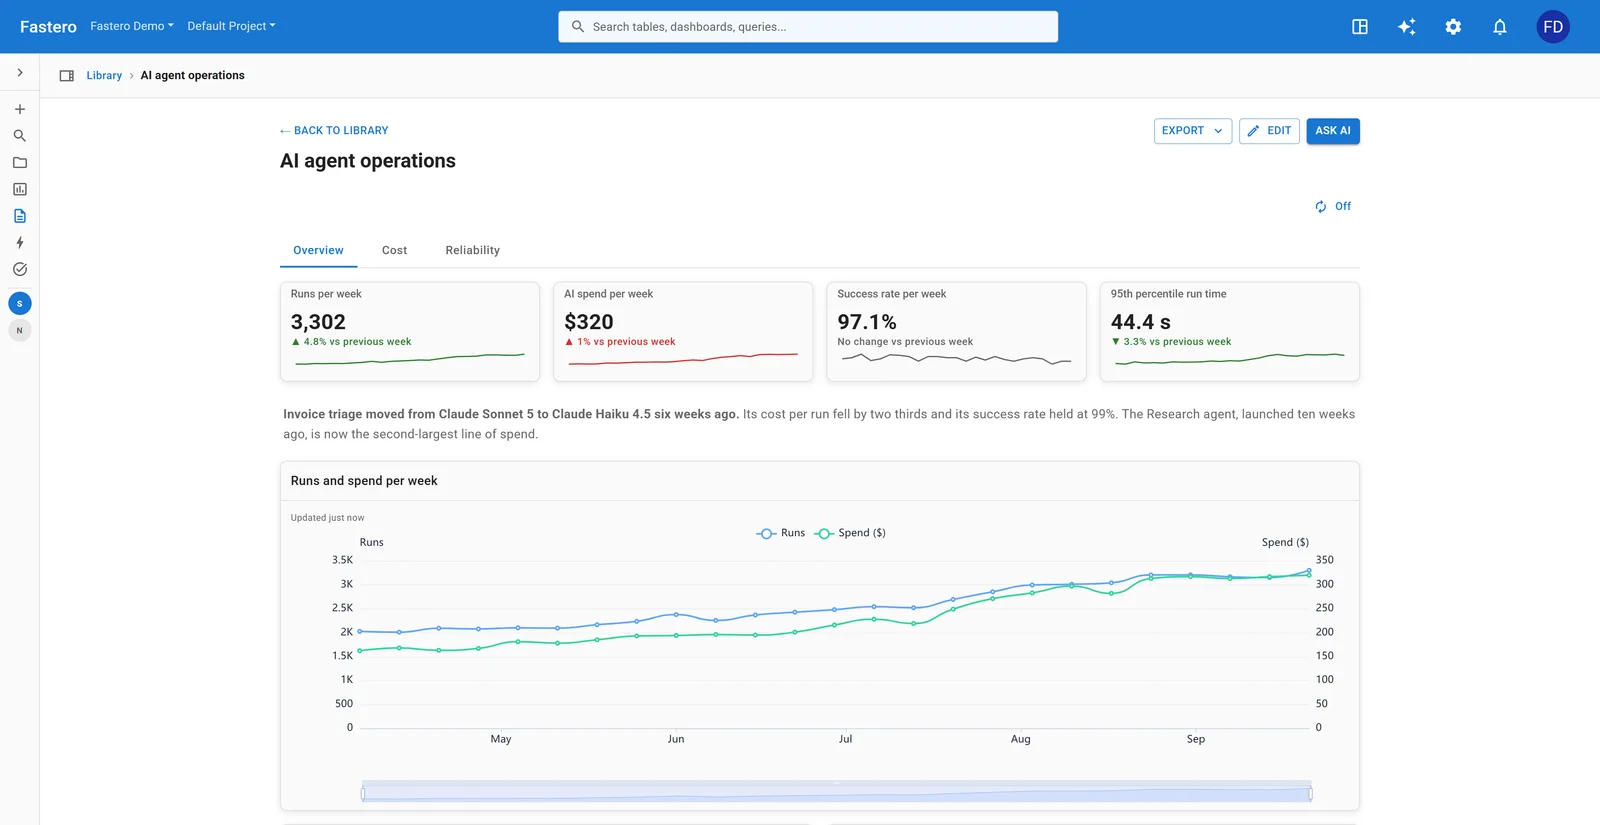
Five AI agents in production. Sample data.
| KPI | How to calculate it |
|---|---|
| Runs | Agent runs per week |
| AI spend | Model cost per week, from token counts and each model's price |
| Success rate | Runs that finished without an error or timeout ÷ all runs |
| Run time | 95th-percentile seconds per run, so slow runs show |
| Cost per run, by agent | Each agent's spend ÷ its runs |
| Tool error rate | Failed tool calls ÷ tool calls, per tool |
Leave off: token counts on the headline view; spend is the same information in the unit people decide with.
12. Operations: a fleet of sites
For anyone running physical assets: sites, machines, vehicles, stores.
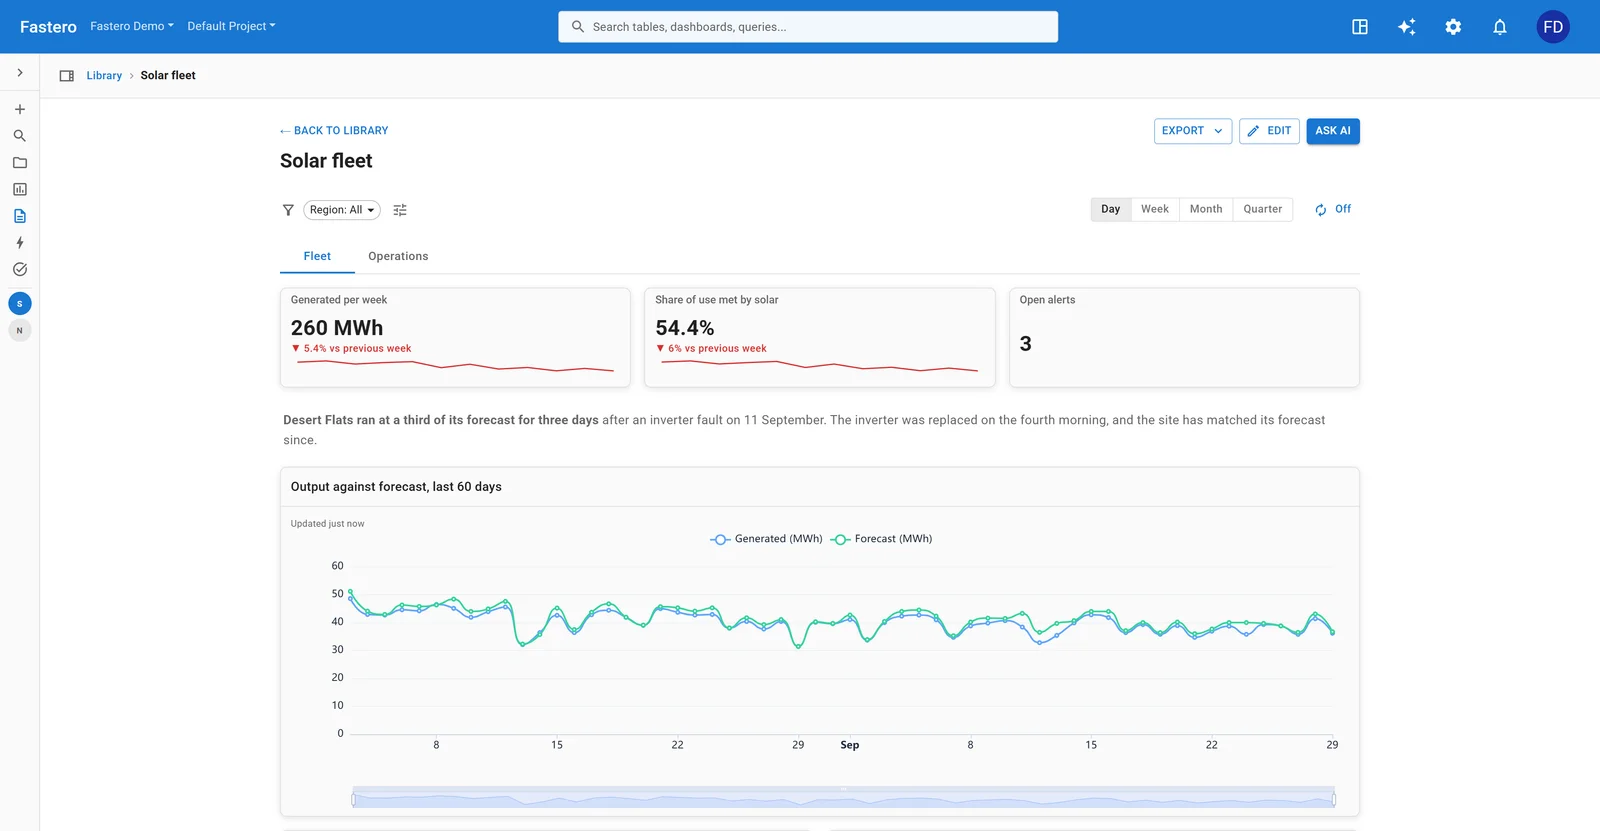
Twelve solar sites: output, use, forecast and alerts. Sample data.
| KPI | How to calculate it |
|---|---|
| Output | Units produced per week, against forecast |
| Share of demand met | Output ÷ consumption |
| Capacity factor | Actual output ÷ what the fleet would produce running flat out |
| Open alerts | Unresolved alerts, by severity |
| Output by site | Each site's output against its own forecast, to find the one that's off |
| Time to resolve | Median hours from an alert to its resolution |
Leave off: readings from individual sensors. They belong on a site's own page, linked from the fleet view.
How to build a KPI dashboard
- Write down each KPI's definition before building anything: what it counts, what it excludes, which table it comes from.
- Connect the data, rather than pasting it into a spreadsheet each month, so the dashboard updates by itself.
- Build the numbers first, each with its comparison, then the trend, then the breakdowns.
- Check every number against a figure you already trust: last month's report, a count in the source system.
- Send it on a schedule to the people who should read it, so nobody has to remember to look.
Fastero is an AI and data platform where people and AI agents work together on a team's data. Connect a database, ask in plain words for the dashboard you want, and Fastero's assistant, or Claude through Fastero's connector, writes the SQL and builds it: number cards compared with the previous period, a filter bar, and a switch between days, weeks and months. Colleagues open it with their own login, and it can email itself every Monday. Our guide to building a live KPI dashboard from Postgres goes step by step, and the best KPI dashboard tools compares the options.
FAQ
What is a KPI dashboard?
One screen showing the few numbers a team is measured on, each against a target or the previous period, so anyone can see at a glance what's on track and what isn't.
How many KPIs should a dashboard have?
Most guides say five to ten per screen, and five to seven for an executive view. There's no research behind an exact number: keep what fits on one screen with its comparison, and move the rest to a detail page.
What's the difference between a KPI and a metric?
Every KPI is a metric, but a KPI is one chosen because it tracks a goal, and it usually has a target. Page views are a metric; for a publisher selling ads, they might be a KPI.
What are the five main KPIs for a business?
For most companies: revenue, growth in revenue, gross margin, cash runway, and customer retention. A subscription business uses MRR and net revenue retention for the first and last.
Can I build a KPI dashboard in Excel or Google Sheets?
Yes, for a small team: raw data on one sheet, the KPI calculations on another, and charts on a third. It gets hard when the data has to be pasted in every week, or when several people need the same numbers with their own login.
Sources
- Stephen Few — Why Most Dashboards Fail (2007)
- Microsoft — Tips for designing a great Power BI dashboard; Tableau — Best practices for effective dashboards; Nielsen Norman Group — Dashboards: making charts and graphs easier to understand
- Subscription metrics — Stripe Billing analytics glossary, ChartMogul on MRR, a16z, 16 startup metrics; burn and runway — Stripe
- Sales — Salesforce on win rate, Salesforce on pipeline coverage, HubSpot on sales velocity
- Support — Zendesk ticket metrics; agencies — AgencyAnalytics' marketing reporting guide; data platforms — dbt source freshness, Snowflake query history
Try Fastero free — connect your data, ask for the dashboard you want, and share it with your team's login. No credit card required.