 Fastero Dev Team
A weekly report is for someone deciding, quickly, whether they need to ask you a question. So it needs a fixed order, a few numbers each set against something, and two sentences that say what changed. Below is a template to copy, the same template filled in with numbers we computed, and versions for KPI, client and monthly reports.
The short answer: a weekly report template has five parts: a two-sentence summary; three to five headline numbers, each against last week and the average of the four weeks before; what moved and why; what was done; and what's next, with anything you need from the reader. Use the same layout, the same numbers and the same send time every week. A monthly report adds the same month last year; a KPI report adds a target, an owner and a status for each number.
Fastero
Connect your database. Ask questions. Get dashboards.
Postgres, BigQuery, Snowflake, and 10+ sources — live-connected, AI-powered, no dashboard builder learning curve.
Try free →The weekly report template
Copy this, replace the brackets, and keep the order fixed so readers learn where to look.
WEEKLY REPORT: [team or client], week of [Monday] to [Sunday]
From: [name]    Sent: [day and date]

1. SUMMARY (two sentences)
   What changed this week and why. What happens next.

2. HEADLINE NUMBERS
   Number            This week   Last week    Avg, 4 weeks before   Target
   [number 1]        [ ]         [ ] ([±%])   [ ] ([±%])            [ ]
   [number 2]        [ ]         [ ] ([±%])   [ ] ([±%])            [ ]
   [number 3]        [ ]         [ ] ([±%])   [ ] ([±%])            [ ]

3. WHAT MOVED
   The biggest change by channel, product, client or team, and the reason.

4. DONE THIS WEEK
   - [shipped, fixed or delivered]

5. NEXT WEEK
   - [planned work]
   - Needs: [the decision or help you need, and from whom]

Live numbers: [link to the dashboard]
The numbers to include, and what to compare them with
| Comparison | Why | Watch out for |
|---|---|---|
| Last week | Shows the latest change | One odd week, in either direction, swings it |
| Average of the four weeks before | A baseline one odd week can't move | Leave last week out of it, or an outlier counts twice |
| Target | Says whether the change matters | Only where a target was agreed |
| Same week last year | Takes the season out | Needs a year of data |
Pick three to five numbers the reader is responsible for: revenue, orders and order value for a sales team; leads and cost per lead for a marketing client; tickets and first reply time for support. Our 30 KPI examples list the formulas by team. Report whole weeks only: a week that is still running always looks like a fall.
A filled-in example
The numbers below come from an invented file of 4,734 orders, run in DuckDB 2.0.0 on 18 November 2026. The report covers the week of Monday 19 to Sunday 25 October 2026. The headline numbers came from this query:
WITH weekly AS (
  SELECT date_trunc('week', order_date) AS week,
         sum(revenue) AS revenue,
         count(*)     AS orders
  FROM sales
  WHERE order_date BETWEEN DATE '2026-09-14' AND DATE '2026-10-25'
  GROUP BY 1
)
SELECT CASE week WHEN DATE '2026-10-19' THEN 'this week'
                 WHEN DATE '2026-10-12' THEN 'last week'
                 ELSE 'avg of 4 weeks before' END AS period,
       round(avg(revenue))                  AS revenue,
       round(avg(orders), 1)                AS orders,
       round(sum(revenue) / sum(orders), 2) AS avg_order_value
FROM weekly
GROUP BY 1
ORDER BY min(week) DESC;
┌───────────────────────┬─────────┬────────┬─────────────────┐
│ period │ revenue │ orders │ avg_order_value │
│ varchar │ double │ double │ double │
├───────────────────────┼─────────┼────────┼─────────────────┤
│ this week │ 12275.0 │ 40.0 │ 306.89 │
│ last week │ 18809.0 │ 63.0 │ 298.55 │
│ avg of 4 weeks before │ 10760.0 │ 41.8 │ 257.72 │
└───────────────────────┴─────────┴────────┴─────────────────┘A second query, revenue by category for both weeks, gave section 3: services fell from 3,993 to 1,440, the largest drop, with one training day sold against three the week before. With the percentages worked out, the report reads:
WEEKLY REPORT: Sales, week of Mon 19 to Sun 25 October 2026 (invented data)
From: [name]    Sent: Mon 26 October

1. SUMMARY
   Revenue was 12,275: down 34.7% on last week, but up 14.1% on the four weeks
   before. Last week was the outlier: 18,809, with three training days in it.

2. HEADLINE NUMBERS
   Number            This week   Last week          Avg, 4 weeks before
   Revenue           12,275      18,809 (-34.7%)    10,760 (+14.1%)
   Orders            40          63 (-36.5%)        41.8 (-4.2%)
   Avg order value   306.89      298.55 (+2.8%)     257.72 (+19.1%)

3. WHAT MOVED
   Services: 1,440, from 3,993 (one training day, three last week).
   Every channel fell; the sales team most, to 3,079 from 6,981.

4. DONE THIS WEEK
   - [the team's own list]

5. NEXT WEEK
   - Check whether sales-team revenue recovers.
   - Needs: nothing.

Live numbers: [link]
Against last week alone, this reads as a bad week. Against the four weeks before, revenue is up and orders are level. That second comparison is why the column exists.
Connect any database. Ask in plain English.
Start free →Versions: team update, client report, KPI report, monthly report
| Version | What changes | Compare with |
|---|---|---|
| Team update (status report) | Numbers shrink to one or two; "done", "in progress" and "blocked" carry it | Last week's plan |
| Client report | Results the client pays for come first, then cost per result, then next steps | Last period and the target |
| KPI report | A row per KPI with its target, owner and status | Target, then last period |
| Monthly report | Months instead of weeks, plus a 12-month trend | Last month and the same month last year |
A monthly report keeps the weekly layout and swaps the comparisons:
MONTHLY REPORT: [team or client], [month and year]

1. SUMMARY: two sentences on the month, and what happens next.
2. HEADLINE NUMBERS: this month | last month (±%) | same month last year (±%) | target
3. TREND: one chart of the last 12 months
4. WHAT MOVED, AND WHY
5. NEXT MONTH: plans, and what you need from the reader
For a client, our client report template has the eight sections clients read and the KPIs for SEO, ads and social. A KPI report template is a table; here it is for October 2026 on the same invented data, with the target left for you to set:
| KPI | Owner | Target | October | vs September | vs October 2025 | Status |
|---|---|---|---|---|---|---|
| Revenue | [name] | [ ] | 57,518 | −11.3% | +8.3% | [on track / at risk / off track] |
| Orders | [name] | [ ] | 202 | −11.0% | +22.4% | [ ] |
| Average order value | [name] | [ ] | 284.74 | −0.3% | −11.6% | [ ] |
| Revenue, last 12 months | [name] | [ ] | 816,730 | +24.3% | [ ] |
The monthly version shows why the year-ago column matters: October was down 11.3% on September and up 8.3% on October 2025. Write the status as a word, not only a colour, so it survives a black-and-white printout.
Stop building it by hand
Most of the work in a weekly report is copying the same numbers out of the same places. Fastero is an AI and data platform where people and AI agents work together on a team's data, and it can send the numbers part for you:
- Connect the database, or upload a CSV or Excel file, and ask Fastero's assistant, or Claude through Fastero's connector, for a dashboard of the headline numbers and the breakdowns. Each number is a saved query, so this week's report runs the same SQL as last week's.
- Schedule it every day, every week on the day and time you choose, or every month on the 1st. Each email has the numbers, charts and tables, plus a PDF of the whole dashboard.
- People in the workspace also get a button that opens it in Fastero; anyone else gets the email and the PDF, after confirming their address once. The same dialog can post the charts to Slack once Slack is connected.
- Viewers are free on every plan. The Free plan is $0 with no end date; Pro is $20 per editor a month (checked 18 November 2026).
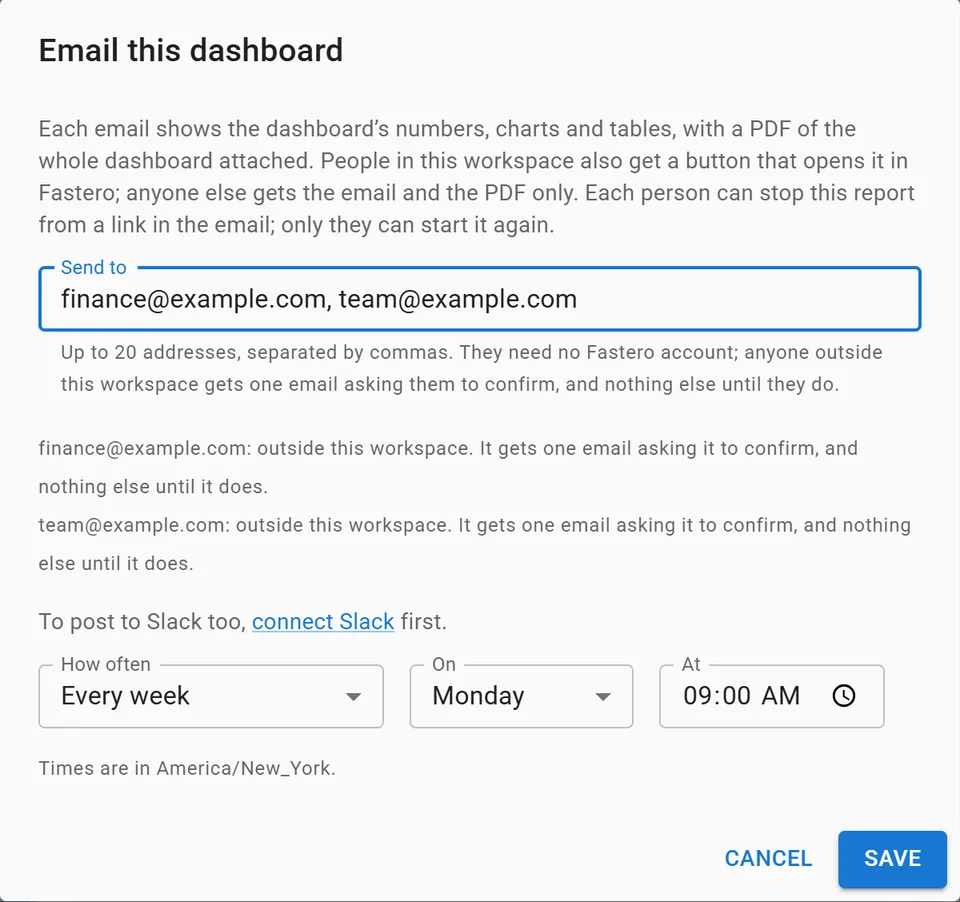
Setting up a weekly email of a dashboard, with invented addresses.
The summary and the reason behind each change are still yours to write: no query produces them. More on scheduling SQL reports to Slack and email.
When to use something else: for a team update with no numbers, a shared document or a Slack post is enough. If your data is already in Google's tools, Data Studio is "available at no charge" and emails a PDF of a report on a schedule, to no more than 50 recipient addresses; an individual account can send 200 scheduled emails a day and 800 a month (checked 18 November 2026).
FAQ
What should be included in a weekly report?
A two-sentence summary, three to five headline numbers against last week and a longer average, what moved and why, what was done, and what's next with anything you need. Keep the same order every week.
How do you write a weekly report quickly?
Fix the template, then automate the numbers: a dashboard of saved queries, emailed on a schedule, fills sections 2 and 3. What's left is two sentences of summary and a short list of work, which take minutes.
What is a KPI report?
A report that lists each KPI with its target, its owner, this period's value, the comparison periods and a status such as on track or at risk. It says whether each target is being hit, where a weekly report says what happened.
What is the difference between a weekly and a monthly report?
A weekly report compares with last week and a few weeks before, and is short. A monthly report compares with last month and the same month last year, adds a 12-month trend, and usually goes to a wider audience.
Is there a free weekly report template?
Yes: copy the template above into a document, an email or a Slack post. For the numbers, Google's Data Studio is "available at no charge" and can email a report as a PDF on a schedule; Fastero emails a dashboard daily, weekly or monthly.
Sources
Read on 18 November 2026:
- Google: Data Studio, Schedule automatic report delivery
- Fastero: pricing
- Queries: DuckDB 2.0.0 on an invented file of 4,734 orders, run 18 November 2026
Try Fastero free: build the numbers once and email them to your team or client every Monday. No credit card required.