 Fastero Dev Team
Ask Claude for "a sales dashboard" and you'll get a tidy page of whatever it guessed you meant. Ask for the numbers, the period and the comparison, and you get something you can put in front of your team. Here are twelve dashboards, each with a picture and a prompt you can paste and adapt.
The short answer: the prompts that work name the reader, the numbers, the period and the comparison, as in "number cards for revenue and orders with the change on the week before, then revenue per week for 12 full weeks". Paste any prompt below into Claude with Fastero connected and it builds the dashboard on your own database, with live numbers your team can open without a Claude account. Three of the twelve are live and public, on public data; the others show invented data. With no database to hand, upload a CSV or Excel file and ask for the same thing in the chat: Claude builds an artifact, a one-off snapshot of that file.
Fastero
Point Claude at your database.
Add Fastero to claude.ai or Claude Code. Claude builds the dashboard, deploys the app or publishes a live page, and your team opens it in Fastero.
Try free →| Example | Who it's for | The data behind it |
|---|---|---|
| Claude Code usage | Engineering leads | Anthropic's analytics API |
| AI agent operations | Teams running agents | Your agents' run log |
| AI model prices (live) | Anyone buying tokens | OpenRouter's public model list |
| Service status (live) | Teams that depend on AI vendors | Public status feeds |
| MCP ecosystem (live) | Developers and open-source maintainers | npm, PyPI and GitHub |
| Client report | Agencies and freelancers | Ads, analytics and bookings |
| Client SEO report | SEO agencies | Search Console and GA4 |
| Product analytics | Product teams | Your events table |
| Subscription revenue | Founders and finance | Your billing data |
| Sales overview | Sales and commercial teams | Your orders |
| Data platform health | Data teams | Pipeline logs and warehouse costs |
| Solar fleet | Anyone running equipment | Sensor readings |
You don't need to give Claude table names: through the connector it reads your schema and finds them. If several tables could fit, say which. Replace the nouns with your own, and tell it what your company means by any word that could be read two ways.
Dashboards about Claude and AI
1. Claude Code usage
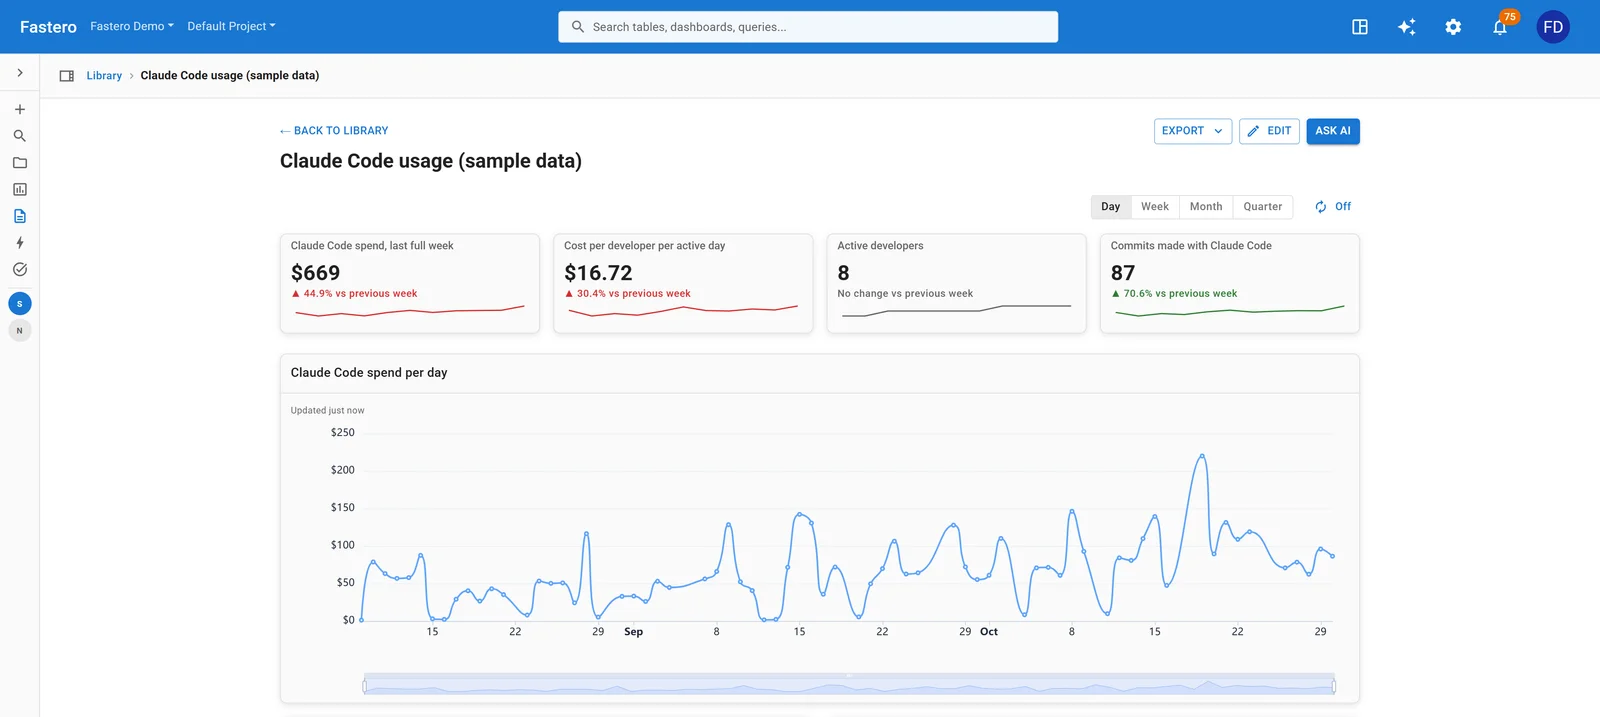
Sample data: an invented team of eight.
For engineering leads who want to know what Claude Code costs per person. Worth copying: cost per developer per active day, which stays comparable when the team grows, and which you can hold against Anthropic's published average of about $13.
In Fastero, build a dashboard of our team's Claude Code usage. Number cards for last
week's spend, cost per developer per active day, active developers and commits, each with
the change on the week before. Below them: spend per day, spend by person and by model
over the last 30 days, and a table of the team with sessions, lines added, commits and
spend. Use full weeks only, Monday to Sunday.
The job that collects this data, and an alert on a runaway day, are in our Claude Code usage guide.
2. AI agent operations
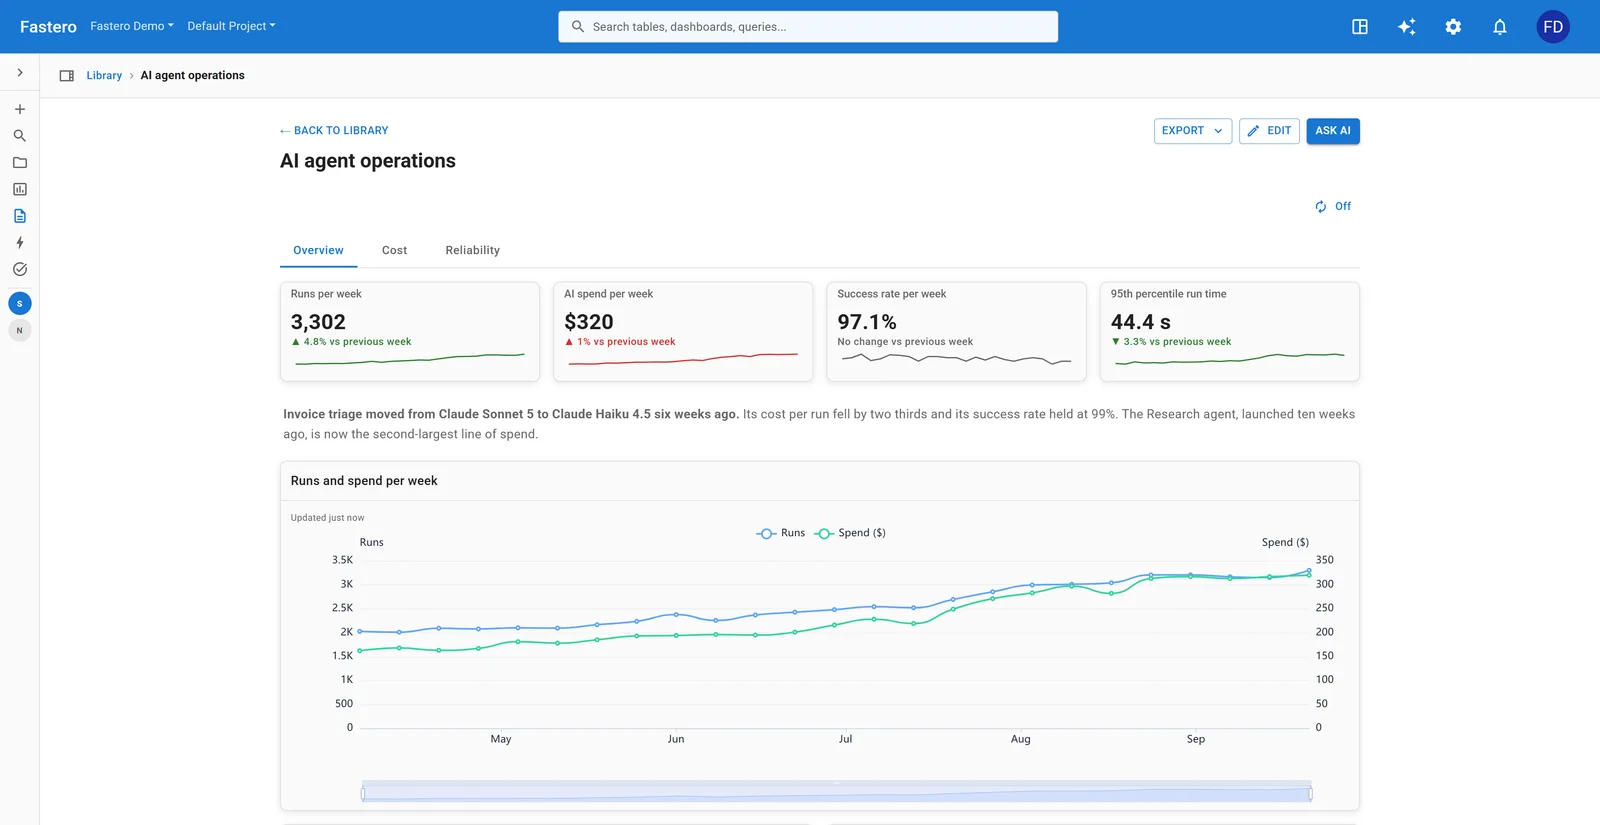
Sample data.
For a team with agents in production. Worth copying: spend and success rate sit side by side, so moving an agent to a cheaper model shows up as what it saved and what it cost in reliability.
In Fastero, build a dashboard of our AI agents from our run log, with three tabs.
Overview: runs, AI spend, success rate and 95th percentile run time per week as number
cards with the change on the week before, then runs and spend per week and runs by agent.
Cost: spend by model and by agent over 30 days, the change in spend by agent, and cost per
run by agent. Reliability: failed runs per day by agent, tool error rate over 30 days, and
runs by hour and weekday.
More in AI agent observability.
3. AI model prices (live)
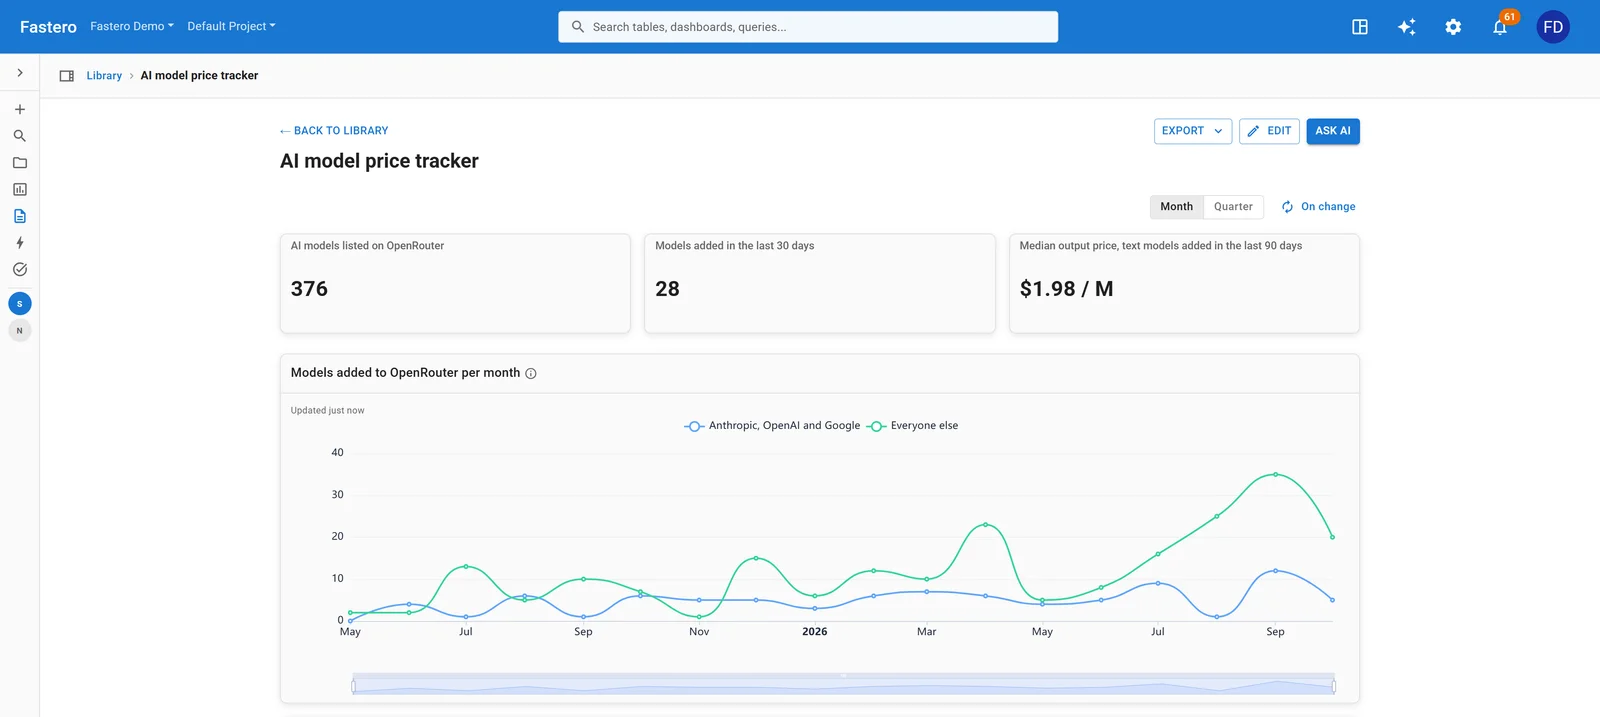
Open the live dashboard. Public data from OpenRouter, updated every day.
For anyone choosing a model or watching a bill. Worth copying: the job saves one row per model per day, so a price change becomes something you can see, rather than a page that quietly differs from last month's.
In Fastero, build a tracker of AI model prices. Every morning, a Python job should read
OpenRouter's public model list (https://openrouter.ai/api/v1/models) and save each model's
input and output price per million tokens, context length and the date it was added, one
row per model per day, into the trackers schema of the database in the Secret
DATABASE_URL. Run it once.

Then build a dashboard: how many models are listed, how many were added in the last 30
days, models added per month, every Claude model's prices, each lab's priciest recent
model, and a table of price changes. Refresh it when the data changes.
What it found is in Claude API pricing.
4. Service status (live)
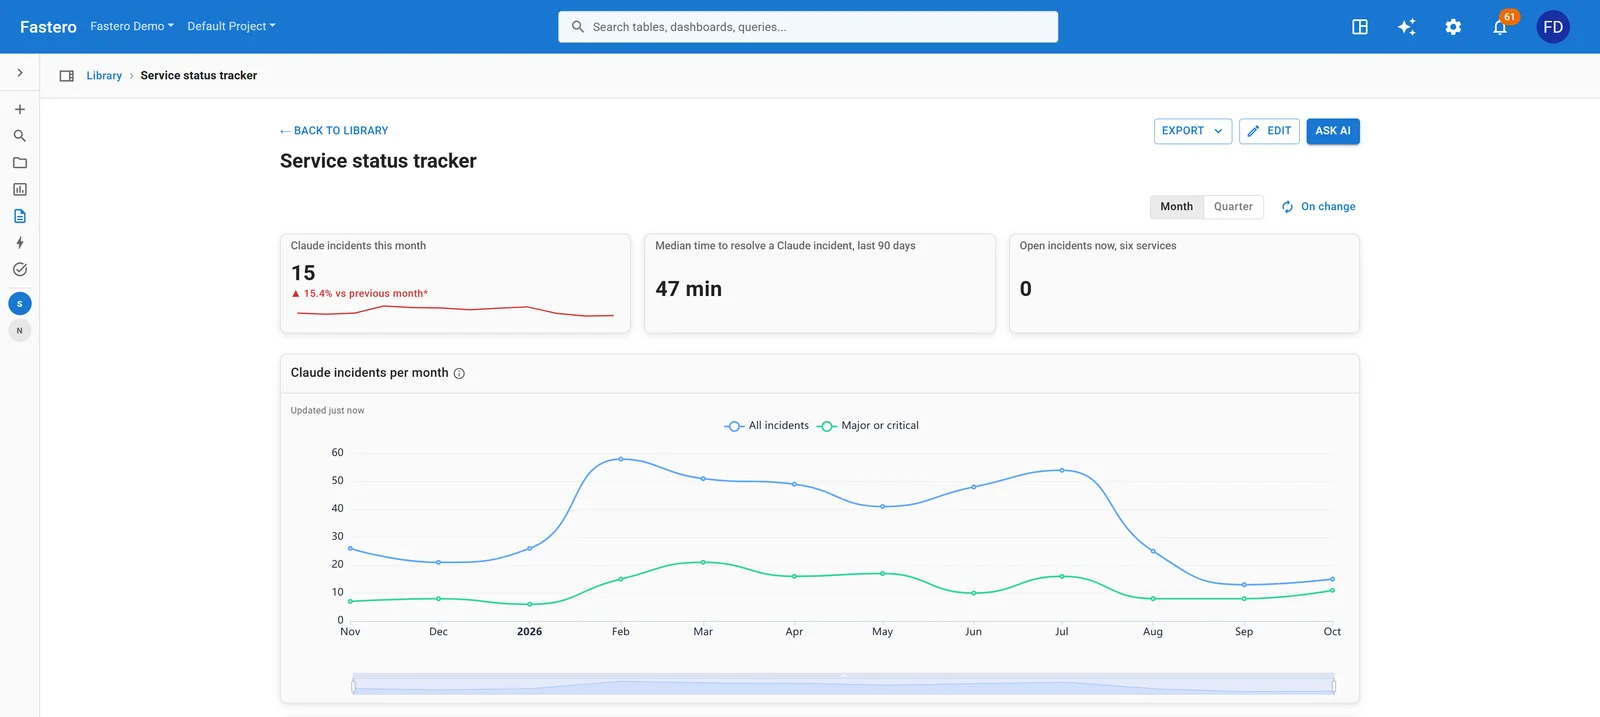
Open the live dashboard. Public data from each service's status feed, updated every hour.
For a team whose product stops when a vendor does. Worth copying: a status page answers "is it down now?", and a history answers "how often, and for how long?", which is what you need when choosing a fallback.
In Fastero, build a status tracker for the services we depend on: Claude, OpenAI, GitHub,
Cursor, Vercel and Supabase. Every hour, a Python job should read each one's public status
feed (/api/v2/incidents.json) and save every incident with its impact, start, resolution
and the parts it affected into the trackers schema of the database in the Secret
DATABASE_URL, updating an incident until it is resolved.

Then build a dashboard: Claude incidents this month, the median time to resolve, open
incidents now, Claude incidents per month, the parts affected, incidents per service in
the last 14 days, and the latest incidents. Refresh it when the data changes.
What it found is in Claude outage history.
5. MCP ecosystem (live)
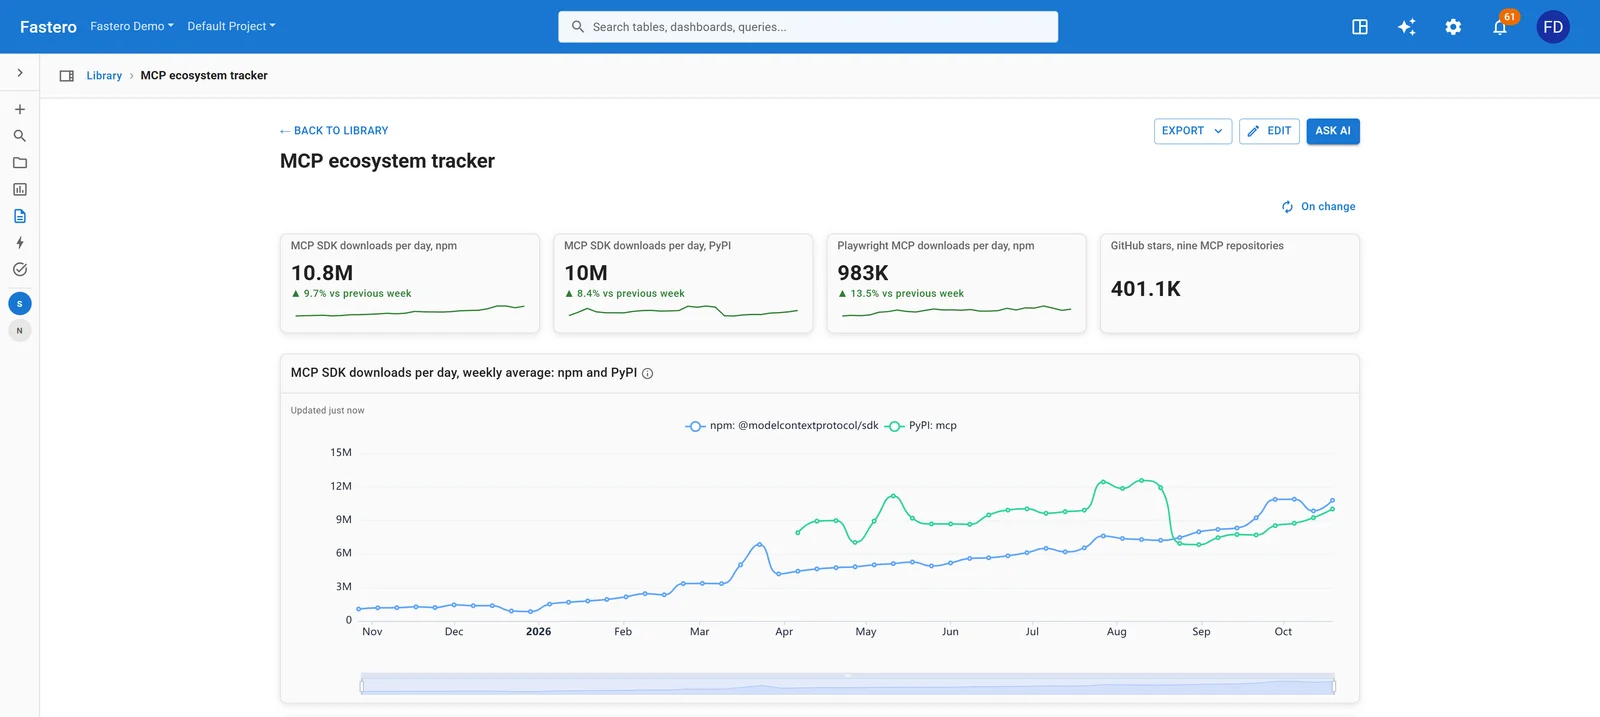
Open the live dashboard. Public data from npm, PyPI and GitHub, updated every day.
For anyone who maintains or depends on open source. Worth copying: GitHub only shows today's stars and npm only recent downloads, so the value is in the job that keeps them, day after day. Point it at your own packages or your competitors'.
In Fastero, build a daily tracker for the open-source packages we care about. Every
morning, a Python job should fetch npm downloads per day for [your npm packages], PyPI
downloads per day from pypistats for [your Python packages], and today's GitHub stars,
forks and open issues for [your repositories], into the trackers schema of the database in
the Secret DATABASE_URL, so that running it twice changes nothing. Run it once and show me
what it saved.

Then build a dashboard: downloads per day at the top, a weekly trend, the packages side by
side, and stars by repository. Refresh it when the data changes.
The full walkthrough is in Track GitHub stars, npm and PyPI downloads with Claude.
Reports for clients
6. Client report
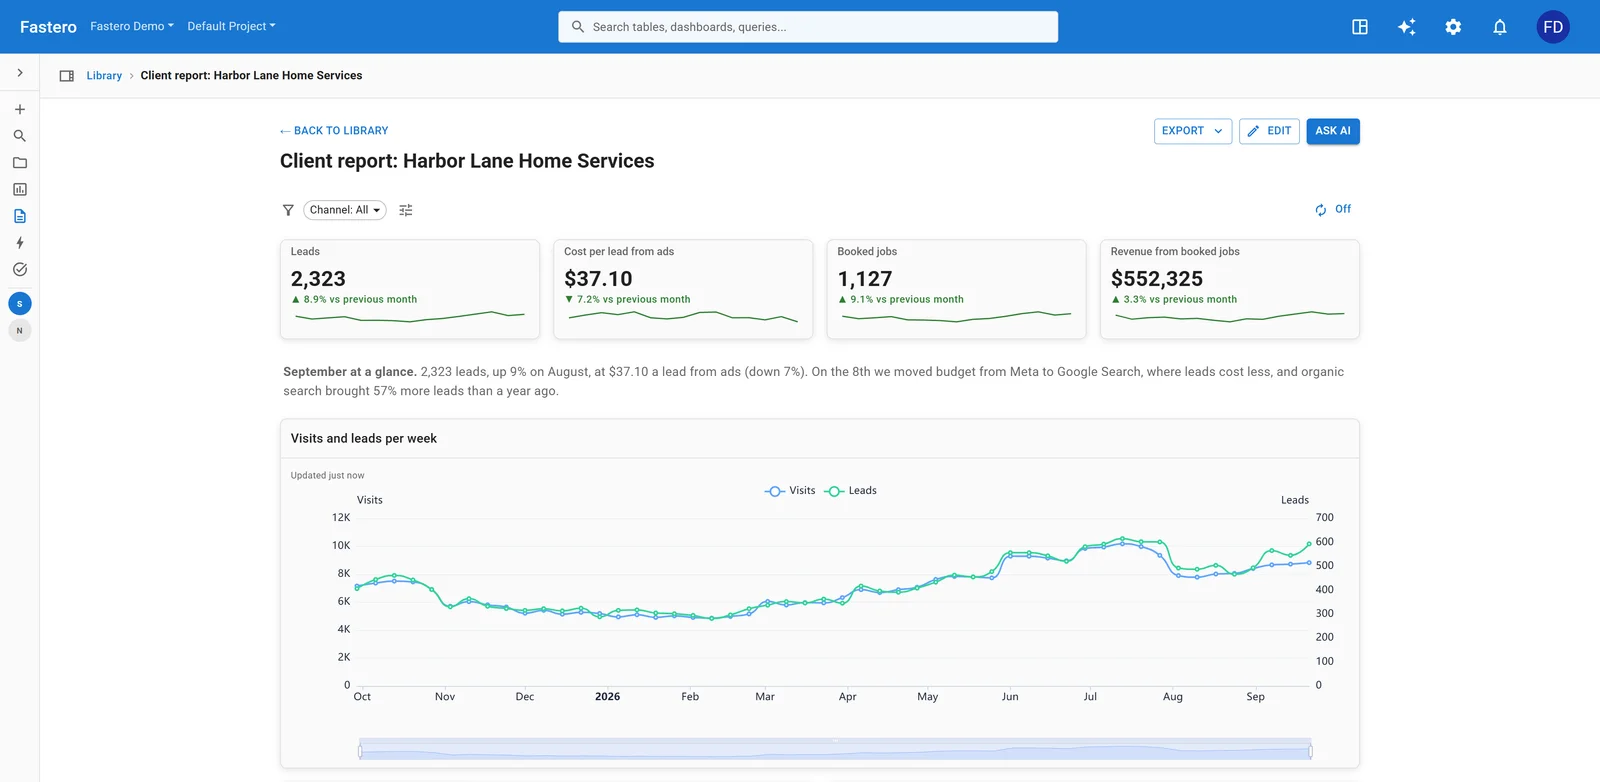
Sample data: an invented client.
For an agency or freelancer who sends a monthly report. Worth copying: it leads with leads and booked jobs, what the client is paying for, and puts visits and clicks further down.
In Fastero, build a monthly report for our client [name] for a business owner who doesn't
read analytics. Number cards for leads, cost per lead from ads, booked jobs and revenue
from booked jobs, each with the change on the month before. A short note at the top on
what changed and why. Then visits and leads per week, leads by channel month by month, ad
spend and cost per lead by month, cost per lead by campaign, and a table of this month's
campaigns. Add a Channel filter.
Give each client their own project, then email it on the 1st of each month.
7. Client SEO report
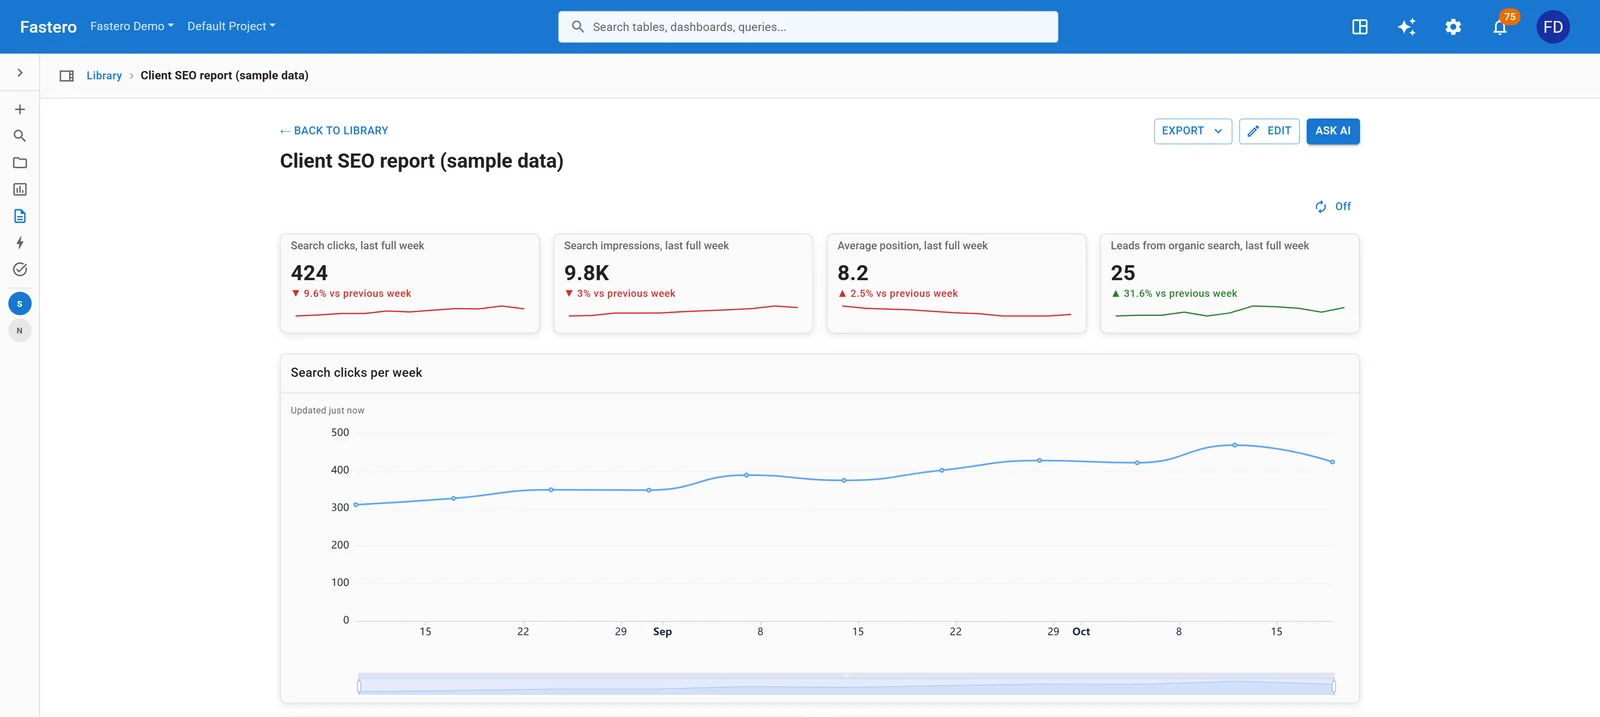
Sample data: an invented client.
For an SEO agency. Worth copying: a table that compares each query with itself over two 28-day periods, which is the honest way to say a ranking moved.
In Fastero, build an SEO report for this client from our Search Console and GA4 tables.
Search clicks, impressions, average position and leads from organic search as number cards
with the change on the week before, using full weeks. Then clicks per week, a table of the
queries that moved most in position over the last 28 days against the 28 before, clicks by
page, and leads by channel.
The job that collects both sources is in Claude for SEO.
Point Claude at your database.
Connect Claude →Product and revenue
8. Product analytics
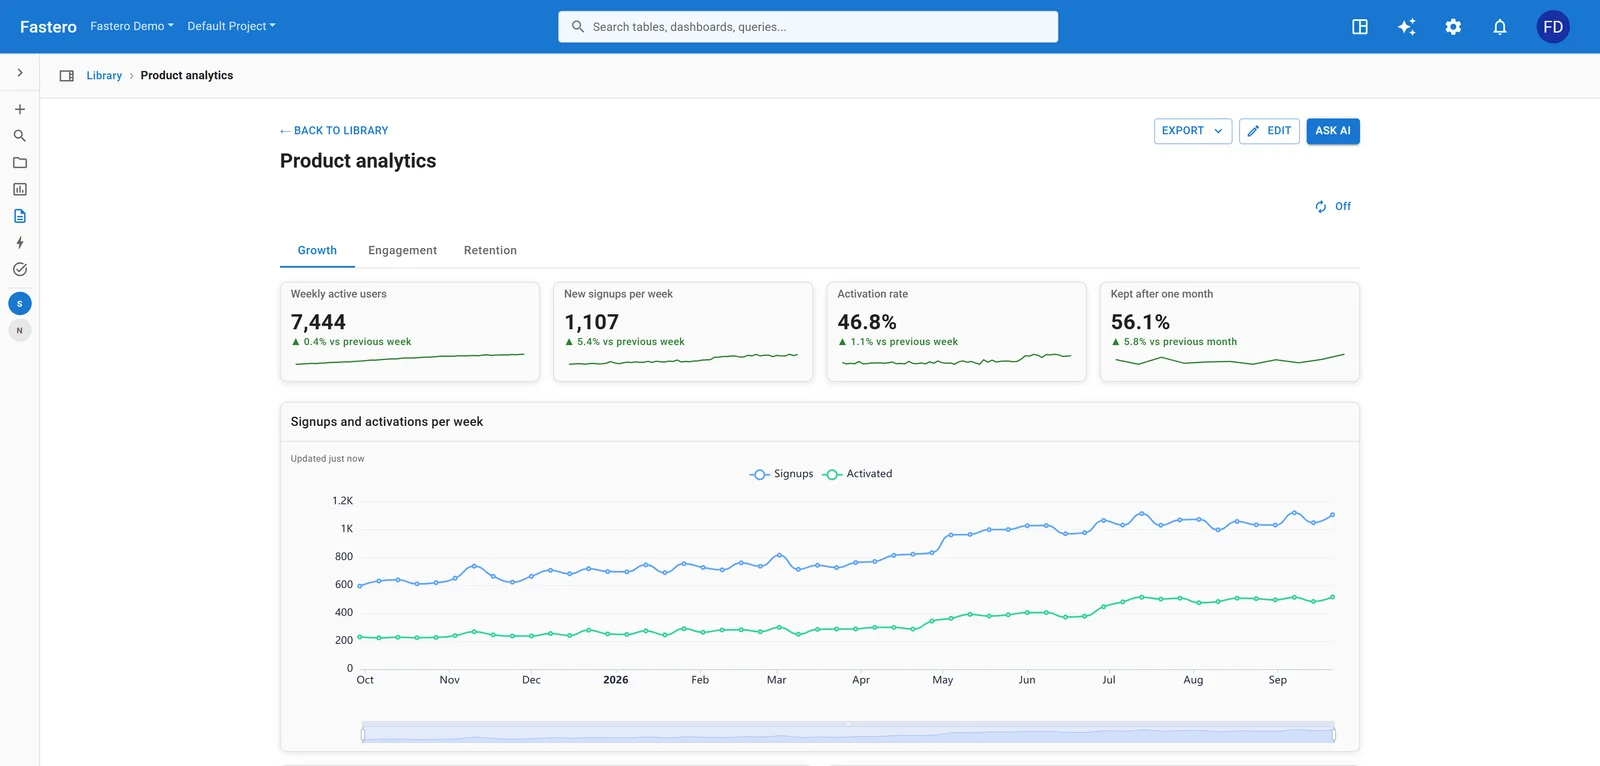
Sample data.
For a product team. Worth copying: signups and activations on one chart, so growth that isn't reaching activation is visible at a glance.
In Fastero, build a product analytics dashboard from our events table, with three tabs.
Growth: weekly active users, new signups per week, activation rate and the share kept after
one month as number cards with their changes, then signups and activations per week,
signups by source, and the signup funnel. Engagement: adoption of each feature last week,
active users by plan and country, and the most active workspaces. Retention: retention by
signup month. Activation means [your definition]; exclude our own accounts.
9. Subscription revenue
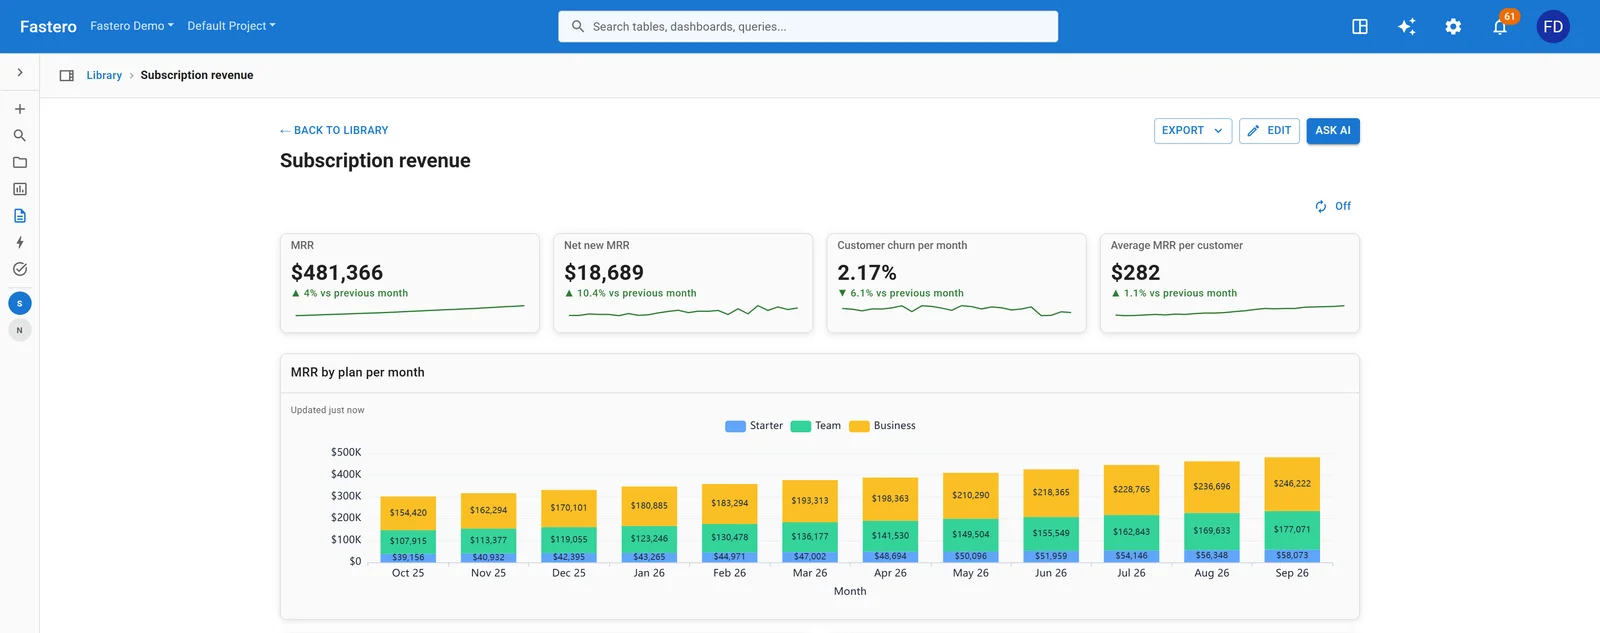
Sample data.
For founders and finance. Worth copying: net new MRR beside total MRR, because a total that keeps climbing can hide new sales slowing down.
In Fastero, build a subscription revenue dashboard from our billing tables. MRR, net new
MRR, customer churn per month and average MRR per customer as number cards with the change
on the month before. Then MRR by plan per month as stacked bars, churn by plan per month,
net revenue retention by month, customers by plan, and a table of the plans. Use complete
months, and show me the SQL for MRR before you save it.
See also KPI dashboard examples.
10. Sales overview
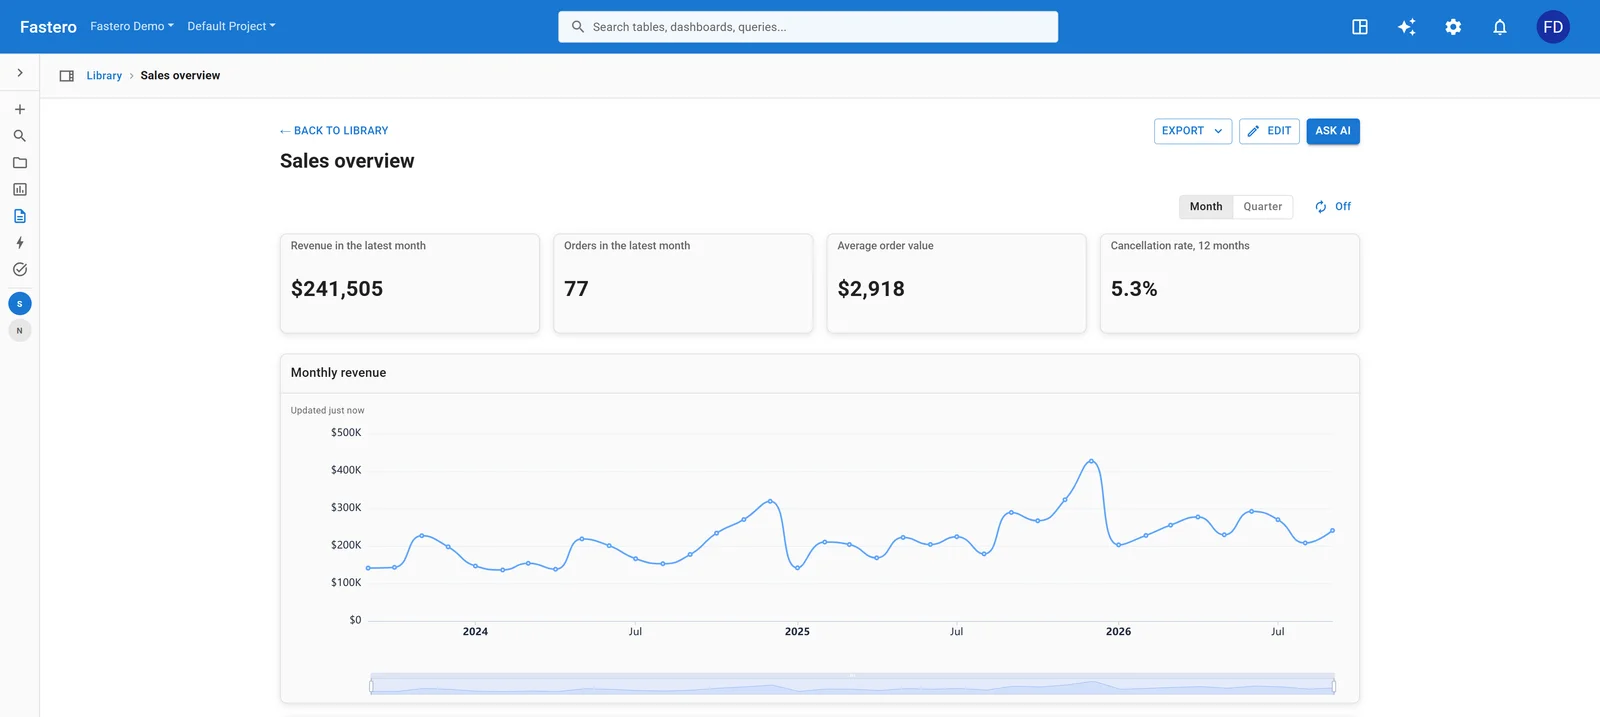
Sample data.
For a commercial team. Worth copying: the cancellation rate sits among the headline numbers, so revenue can't look healthy while orders are quietly falling through.
In Fastero, build a sales overview from our orders. Revenue and orders in the latest
complete month, average order value and the cancellation rate over 12 months as number
cards. Then monthly revenue, revenue by channel each quarter, revenue by country and by
product, orders by month and category, and a table of the top products. Exclude cancelled
orders from revenue.
Data and operations
11. Data platform health
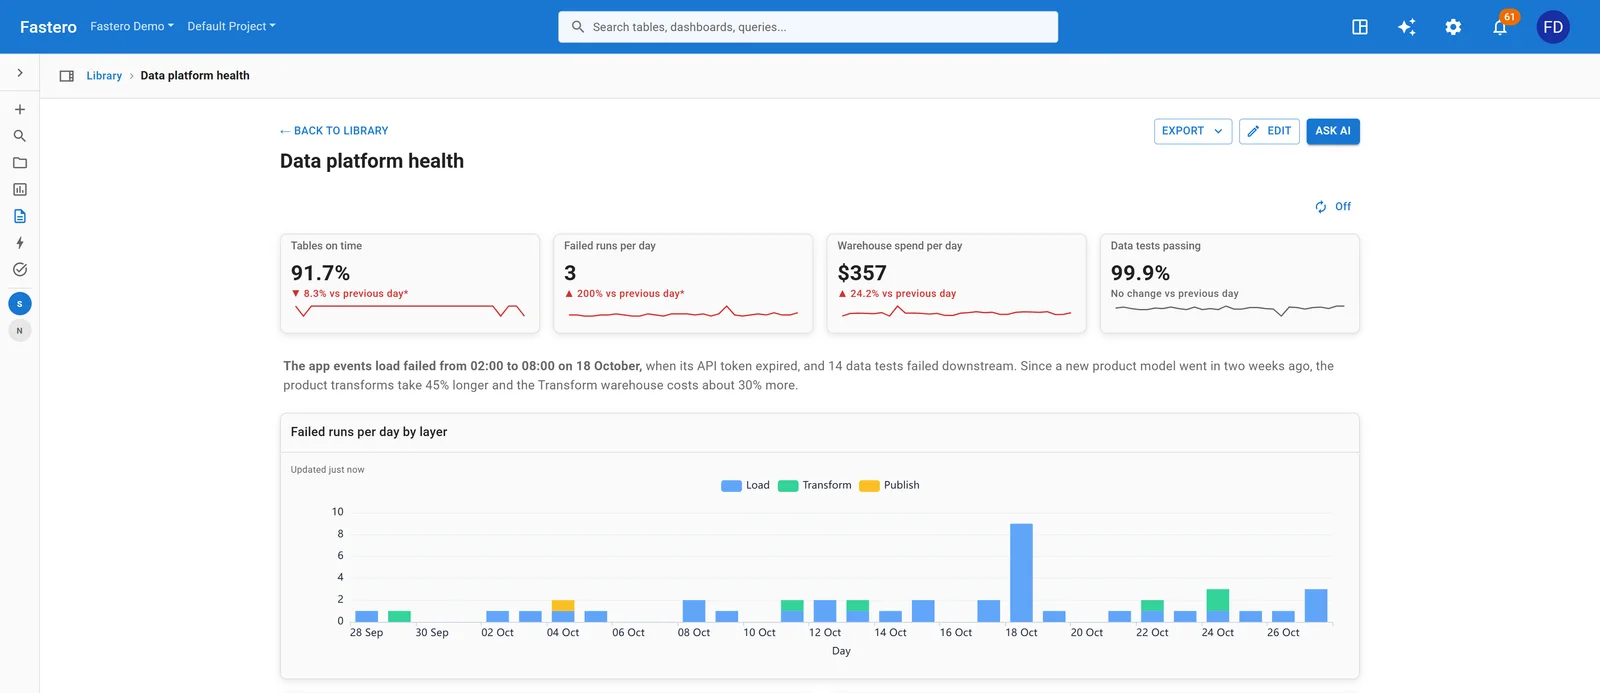
Sample data.
For a data team. Worth copying: failures stacked by layer, so the morning a load failed reads differently from a slow build-up of failed transforms.
In Fastero, build a data platform dashboard from our pipeline logs and warehouse billing.
The share of tables on time, failed runs per day, warehouse spend per day and data tests
passing as number cards with their changes. Then failed runs per day by layer (load,
transform, publish), spend per day by warehouse, this month's warehouse budget used, rows
loaded per day, and a table of every table with its last load and how late it is.
Follow it with an alert: "Email me if tables on time falls below 95%, checking every hour."
12. Solar fleet
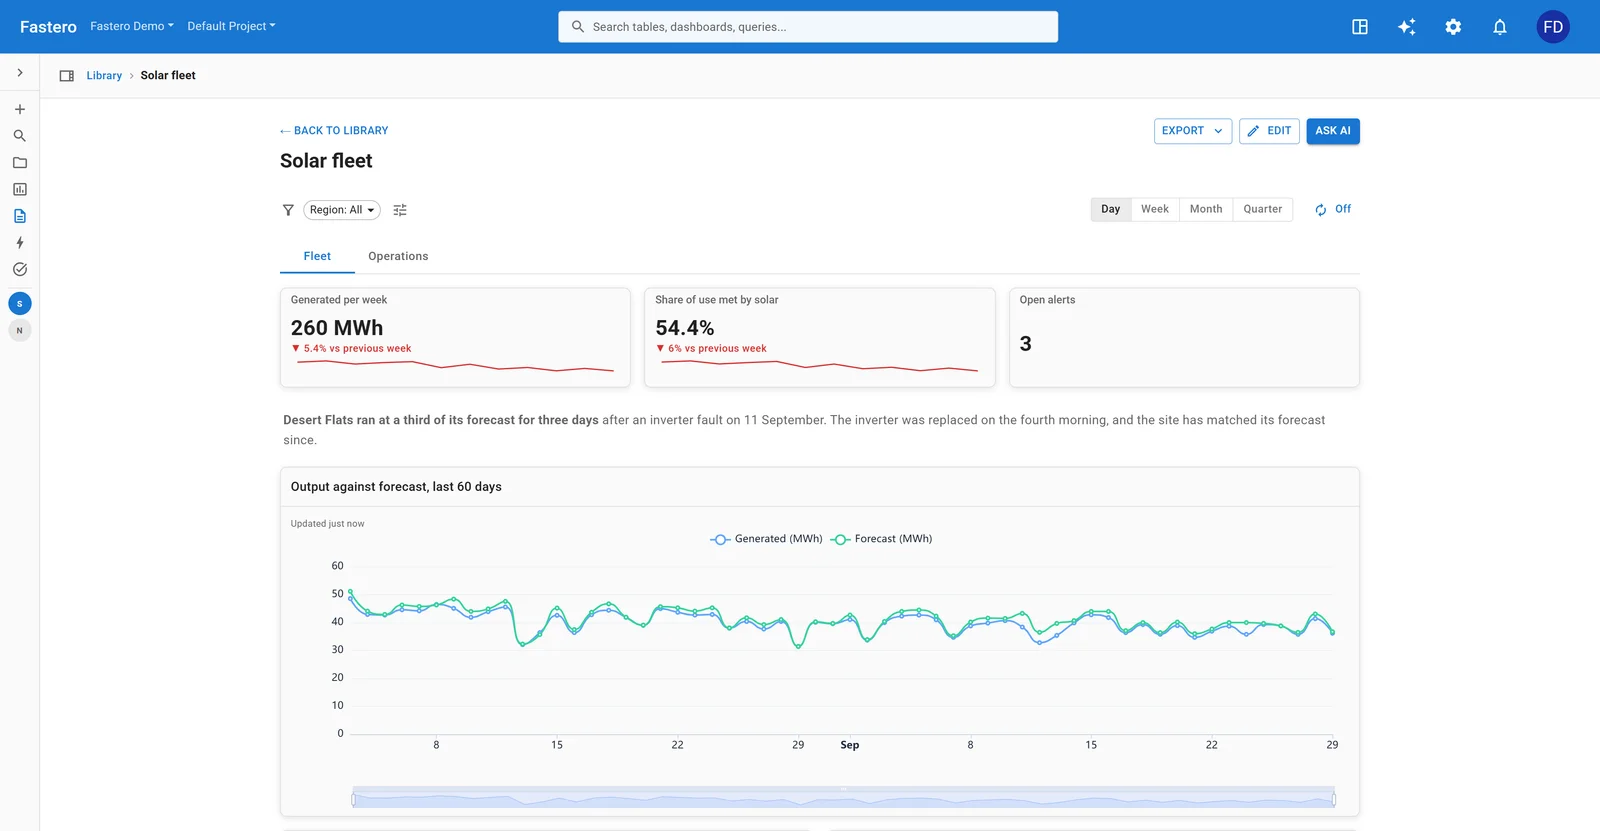
Sample data: an invented company with twelve sites.
For anyone running equipment that reports readings, from solar panels to pumps or vehicles. Worth copying: output against forecast rather than output alone, because a cloudy week and a broken inverter look the same until you compare them with what was expected.
In Fastero, build a dashboard of our twelve sites from their readings, with a Region filter
and two tabs. Fleet: generation per week, the share of use met by solar and open alerts as
number cards, then output against forecast for the last 60 days, output per day by region,
yield by site, and a table of the sites. Operations: average output by hour and region,
battery charge through the day, and a table of alerts.
What makes a dashboard prompt work
- Name the numbers. "Revenue, orders and average order value" gets you those three. "Key metrics" gets you Claude's guess.
- Give each number a comparison. 424 clicks means nothing alone; "▼ 9.6% vs previous week" tells you whether to care. Ask for "the change on the week before".
- Ask for complete periods. A half-finished week reads as a collapse, and a half-finished first week reads as a boom: the first email from our sample SEO report announced a rise of 480.8%, for exactly that reason. "Full weeks only, Monday to Sunday" fixes it, and Claude takes the hint: given "the latest complete month" in the Sales overview prompt, it checked whether the newest month was cut short before it wrote a query.
- State your rules. "Exclude cancelled orders and test accounts" is the sort of thing only you know, and it can change a number more than anything else in the prompt.
- Say who reads it. "For a business owner who doesn't read analytics" changes what comes first and how things are labelled.
- Ask for the SQL, then check two numbers. "Show me the SQL for MRR before you save it" is the one review that matters, because once saved it runs the same way every time. Compare two results with a number you already trust.
- Ask for the sentence. "A short note at the top on what changed and why" is what makes a dashboard readable by someone who wasn't there. A note stays as written, so ask Claude to rewrite it when you next review.
Once you have a first version, change it in plain words:
| Say this | What it does |
|---|---|
| "Split this into tabs: Overview, Cost and Reliability." | Moves charts onto tabs |
| "Add a Channel filter." | Adds a filter to the dashboard's filter bar |
| "Make that a stacked bar by plan." | Changes one chart |
| "Save this as our definition of revenue." | Later conversations, and Fastero's own assistant, count it the same way |
| "Refresh it when the data changes." | Keeps the dashboard current by itself |
| "Email it to me every Monday at 9:00." | Sends the dashboard on a schedule |
| "Email me if refunds go above 40 in a day." | Sets an alert on one number |
Where the dashboard lives
These prompts say "In Fastero" because that decides what you end up with. There, queries run against your database each time someone opens the dashboard, or when the data changes, and your team signs in to see it, with no Claude account needed; viewers are free. A person can also confirm a public link, which is how the three live examples above are shared.
Claude can build dashboards in other places too. An artifact in the chat suits a one-off look at a file. Claude's Dashboards template, in beta on paid plans, works on warehouses such as Snowflake and BigQuery. Our guide to the five ways to build a Claude dashboard compares them.
How we made these
Claude built examples 1, 3, 4, 5 and 7 through Fastero's connector, the same one you'd use. The other seven were built through that connector by a script, on invented data, so that every picture could show a whole business. The prompts here describe what's in each picture; Claude won't produce an identical page from them on your data, and yours will reflect your own tables.
FAQ
Can Claude build a dashboard?
Yes. In the chat it builds an artifact from a file you upload. With a connector such as Fastero's, it builds a dashboard on your own database, with saved queries, that your team can open and that stays current.
What is a good prompt for a Claude dashboard?
Name the numbers, the period, the comparison and the reader. For example: "Number cards for revenue, orders and average order value with the change on the week before, then revenue per week for the last 12 full weeks, for our Monday leadership meeting. Exclude cancelled orders."
Can a Claude dashboard stay live?
An artifact made from an uploaded file is a snapshot. An artifact that calls connectors fetches data when it opens, through each viewer's own connection. A dashboard Claude builds in Fastero runs its queries against your database when someone opens it, and can refresh when the data changes.
Can people without Claude open the dashboard?
Artifacts need a Claude account to open. A Fastero dashboard needs only a Fastero sign-in, and viewers are free. For people who won't sign in, a person can confirm a public link.
Does Claude have dashboard templates?
Yes, a Dashboards template in beta on paid plans, for Redshift, BigQuery, ClickHouse, Databricks, Snowflake and Salesforce. For Postgres and other databases, a connector such as Fastero's does the same job. The prompts on this page work as templates of a sort: change the nouns and paste.
Do I need to know SQL?
No. Claude writes it, and you can ask it in plain words to explain any query. It's still worth reading the SQL for your most important numbers once, or asking Claude to walk you through what it counted.
Can I use these prompts without a database?
Yes. Upload a CSV or Excel file to Claude and ask for the same dashboard in the chat, or upload it to Fastero, where it becomes a table you can query and chart.
Sources
Read on 31 October 2026:
- Anthropic — Dashboards and Motion, Dashboards help article, What are artifacts, Manage costs effectively
- Fastero — Claude dashboard: 5 ways to build one, Claude connectors
Try Fastero free — paste one of these prompts and have Claude build the dashboard on your own data. No credit card required.