 Fastero Dev Team
GitHub shows a repository's stars today, npm its downloads this week, and pypistats the last few months of a Python package. None of them keeps the three side by side, day after day, in a place your team can open. So we asked Claude to build one: a tracker of the open-source projects around MCP, the protocol Claude's connectors use, that collects npm downloads, PyPI downloads and GitHub stars every morning and draws them on a dashboard with a public link. Open the live tracker: it updates by itself.
The short answer: to track GitHub stars and package downloads over time, collect them on a schedule and keep them in a database: npm and pypistats return history, so the first run fills in a year of npm downloads and about six months of PyPI downloads, while GitHub returns only today's star count, so star history builds up one day per run. With Fastero connected to Claude and a database to write into, you describe the tracker in one prompt and Claude writes the job, runs it, schedules it, builds the dashboard and asks for a public link.
Fastero
Point Claude at your database.
Add Fastero to claude.ai or Claude Code. Claude builds the dashboard, deploys the app or publishes a live page, and your team opens it in Fastero.
Try free →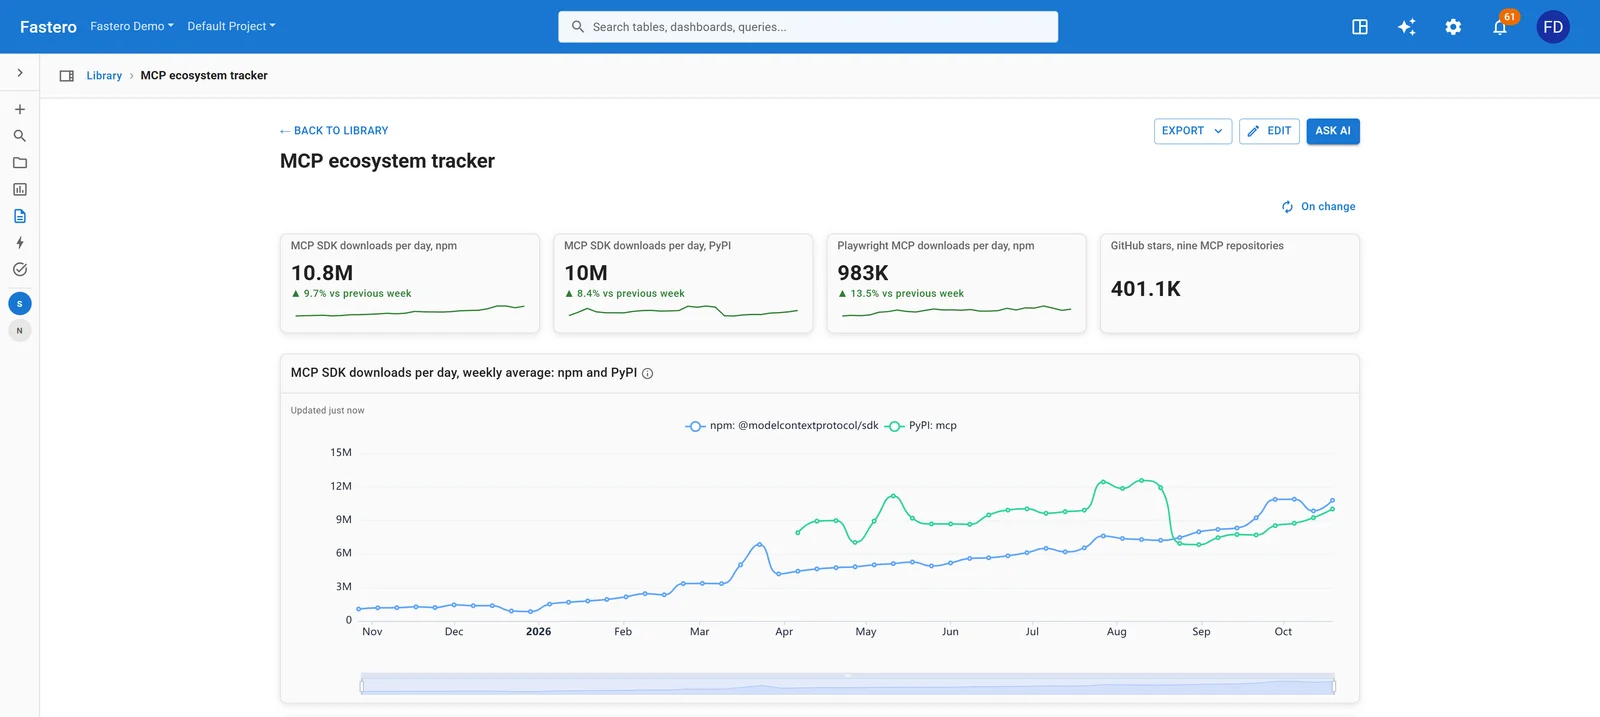
The tracker in Fastero. Live data from npm, PyPI and GitHub, 27 October 2026.
What the tracker shows (27 October 2026)
Downloads per day, averaged over a week (Monday to Sunday). npm's record goes back a year here, pypistats' to April:
| Package | Where | Per day, week of 19 Oct | Week of 13 Apr | Week of 27 Oct 2025 |
|---|---|---|---|---|
| @modelcontextprotocol/sdk (TypeScript SDK) | npm | 10.8 million | 4.7 million | 1.07 million |
| mcp (Python SDK) | PyPI | 10.0 million | 8.9 million | — |
| fastmcp | PyPI | 2.0 million | 2.6 million | — |
| @playwright/mcp | npm | 983,000 | 374,000 | 102,000 |
| @modelcontextprotocol/server-filesystem | npm | 137,000 | 44,000 | 19,000 |
| mcp-remote | npm | 126,000 | 41,000 | 13,000 |
| @modelcontextprotocol/inspector | npm | 92,000 | 25,000 | 12,000 |
npm has counts for only four days of the week of 19 October, two of them a weekend, so its figures for that week read a little low.
Four things stand out:
- The TypeScript SDK is downloaded ten times as often as a year ago, and more than twice as often as in April. Playwright's MCP server and
mcp-remotegrew almost as fast, nearly tenfold. - The TypeScript SDK passed the Python SDK in the week of 24 August and has stayed ahead. npm kept climbing that week while PyPI's daily count fell from 11.9 million to 6.9 million; it has climbed back to 10.0 million since.
- A list has more stars than the official servers.
punkpeye/awesome-mcp-servershad 96,929 stars on 27 October, against 91,605 formodelcontextprotocol/servers. - npm's own counts have holes. On 13 days in the past year, seven of them in October, npm reports zero downloads for every package,
reactandexpressincluded. More on that below.
GitHub stars on 27 October, the tracker's first day of star history:
| Repository | Stars | Forks | Open issues |
|---|---|---|---|
| punkpeye/awesome-mcp-servers | 96,929 | 18,612 | 3,554 |
| modelcontextprotocol/servers | 91,605 | 11,870 | 116 |
| upstash/context7 | 63,770 | 3,151 | 49 |
| microsoft/playwright-mcp | 38,708 | 3,324 | 1 |
| github/github-mcp-server | 34,000 | 5,239 | 411 |
| PrefectHQ/fastmcp | 28,218 | 2,527 | 564 |
| modelcontextprotocol/python-sdk | 24,684 | 4,083 | 375 |
| modelcontextprotocol/typescript-sdk | 13,662 | 2,346 | 617 |
| modelcontextprotocol/modelcontextprotocol | 9,543 | 1,884 | 114 |
A download is a file fetched, not a person: CI pipelines, containers being rebuilt and caches all count, and a server people use by its URL, hosted by someone else, is never downloaded at all. Read the numbers as a trend, not a user count.
Where the numbers come from
Each source is free and public, and each keeps a different amount of history:
| Number | Source | History you can fetch | Free tool to check one package |
|---|---|---|---|
| npm downloads per day | npm's download counts API, api.npmjs.org/downloads/range/<start>:<end>/<package> |
A year or more per request | The package page's weekly downloads, npmtrends.com, npm-stat.com |
| PyPI downloads per day | pypistats.org's API, pypistats.org/api/packages/<package>/overall |
About six months | pypistats.org, pepy.tech; the full history is in Google BigQuery's public pypi.file_downloads table |
| GitHub stars, forks, open issues | GitHub's REST API, api.github.com/repos/<owner>/<repo> |
Today's count only | star-history.com, which rebuilds past counts from the date of each star |
The free tools answer "how is this one package doing?" well. What they don't do is keep your packages and your competitors' together, every day, in a database you can query, chart, alert on and share. That is the tracker.
How Claude built it
The one thing you do yourself: a database and a Secret
The job needs a Postgres database to write into, and the charts need to read it. Any Postgres works; Neon and Supabase both have free plans.
- Create three tables,
npm_daily,pypi_dailyandgithub_daily, each keyed on day plus package or repository, so a second run updates rows instead of adding them. - Make a login that may only write those three tables, and keep the owner's password out of it.
- In Fastero, add that login's connection string under Settings → Secrets. Type it there yourself rather than pasting it into a chat: the job receives it as an environment variable, and the password never passes through the conversation.
- Connect the same database to Fastero with a read-only login, for the charts.
The prompt
With Fastero connected, in Claude Code or claude.ai:
In Fastero, build a daily tracker for the open-source packages around MCP.

Every morning at 06:00 UTC, a Python job should fetch:
- npm downloads per day for the last year: @modelcontextprotocol/sdk,
  @playwright/mcp, mcp-remote, @modelcontextprotocol/server-filesystem,
  @modelcontextprotocol/inspector, @upstash/context7-mcp,
  @supabase/mcp-server-supabase
- PyPI downloads per day from pypistats, without mirrors: mcp, fastmcp,
  mcp-server-fetch, mcp-server-git
- today's GitHub stars, forks and open issues for modelcontextprotocol/servers,
  python-sdk, typescript-sdk and modelcontextprotocol, PrefectHQ/fastmcp,
  microsoft/playwright-mcp, upstash/context7, github/github-mcp-server and
  punkpeye/awesome-mcp-servers

Write them into the oss tables of the database in the Secret OSS_DATABASE_URL,
so that running it twice changes nothing. Run it once and show me what it saved.

Then build a dashboard on the "Open-source tracker" connection: downloads per day
for both SDKs at the top, a weekly trend of the two SDKs, the servers and
frameworks side by side, and stars by repository. Refresh it when the data
changes, and ask for a public link.
What Claude did
Eight steps through Fastero's connector:
| Step | Fastero tool | What happened |
|---|---|---|
| 1 | fastero_create_python_project |
A Python project, "MCP ecosystem tracker" |
| 2 | fastero_write_python_file |
main.py: three fetchers and one upsert, below |
| 3 | fastero_run_python_project |
A run on a fresh machine, with the Secret as an environment variable |
| 4 | fastero_get_python_run_log |
"Saved 2555 npm days, 808 PyPI days and 9 repositories' stars." |
| 5 | fastero_set_python_schedule |
0 6 * * *: every day at 06:00 UTC |
| 6 | fastero_save_chart, seven times |
Each chart from its own SQL, onto one dashboard |
| 7 | fastero_set_dashboard_refresh |
Charts re-run when the tables behind them change |
| 8 | fastero_share_dashboard |
A public link, waiting for a person to confirm it in Fastero |
The last step is deliberate. An agent can ask for a public link but can't publish one: an owner, admin or editor of the project opens the confirmation page Fastero names, sees which dashboard goes public, and clicks Publish link. Once published, the link takes fresh numbers each time someone opens it, because the dashboard's refresh is on.
The first version was wrong
The first version charted weekly totals, and showed the TypeScript SDK's downloads falling by more than 40% in October. Checking the table day by day, Claude found three days in a row with zero downloads for every package, and npm's API gave the same zeros for react and express. The holes are in npm's own counts, not in the job.
The fix took two changes. The job now leaves out any day on which every tracked package reads zero, and takes out such days if they were saved before, so a day npm later fills in comes back on the next run. The charts show downloads per day, averaged over the days that have counts, instead of weekly totals that a missing day would drag down. The run log now says what it left out: "Left out 13 days npm has no counts for: 2026-07-12, 2026-08-14, …"
Totals from any registry are worth that check: query a few days by hand before you trust a chart.
Point Claude at your database.
Connect Claude →The job
All of it, as it runs every morning. It needs nothing beyond Python's standard library and psycopg2, which Fastero's Python environment already has:
"""MCP ecosystem tracker.

Every day: npm and PyPI downloads and GitHub stars for the main open-source projects
around MCP, saved into Postgres (the Secret OSS_DATABASE_URL). The registries return
history, so each run rewrites the last year of npm downloads and the six months or so of
PyPI downloads pypistats keeps; GitHub gives today's count, so stars build up one day per
run.

npm's counts have holes: on some days every package reads 0, react and express included.
Those days are left out (and taken out if saved before), so a hole doesn't read as
nobody downloading, and comes back by itself if npm fills it in.
"""
import datetime as dt
import json
import os
import time
import urllib.error
import urllib.request

import psycopg2
from psycopg2.extras import execute_values

NPM = [
    "@modelcontextprotocol/sdk",
    "@modelcontextprotocol/server-filesystem",
    "@modelcontextprotocol/inspector",
    "@playwright/mcp",
    "@upstash/context7-mcp",
    "@supabase/mcp-server-supabase",
    "mcp-remote",
]
PYPI = ["mcp", "fastmcp", "mcp-server-fetch", "mcp-server-git"]
GITHUB = [
    "modelcontextprotocol/servers",
    "modelcontextprotocol/python-sdk",
    "modelcontextprotocol/typescript-sdk",
    "modelcontextprotocol/modelcontextprotocol",
    "PrefectHQ/fastmcp",
    "microsoft/playwright-mcp",
    "upstash/context7",
    "github/github-mcp-server",
    "punkpeye/awesome-mcp-servers",
]


def get(url):
    req = urllib.request.Request(
        url, headers={"User-Agent": "fastero-mcp-tracker (+https://fastero.com)", "Accept": "application/json"}
    )
    for attempt in range(3):
        try:
            with urllib.request.urlopen(req, timeout=30) as response:
                return json.load(response)
        except urllib.error.HTTPError as e:
            if e.code in (429, 500, 502, 503) and attempt < 2:
                time.sleep(10 * (attempt + 1))
                continue
            raise RuntimeError(f"{url} answered {e.code}") from e


def npm_rows():
    end = dt.date.today() - dt.timedelta(days=1)
    start = end - dt.timedelta(days=364)
    rows = []
    for package in NPM:
        data = get(f"https://api.npmjs.org/downloads/range/{start}:{end}/{package}")
        rows += [(d["day"], package, d["downloads"]) for d in data["downloads"]]
    totals = {}
    for day, _, downloads in rows:
        totals[day] = totals.get(day, 0) + downloads
    gaps = sorted(day for day, total in totals.items() if total == 0)
    return [r for r in rows if r[0] not in gaps], gaps


def pypi_rows():
    rows = []
    for package in PYPI:
        data = get(f"https://pypistats.org/api/packages/{package}/overall?mirrors=false")
        rows += [(d["date"], package, d["downloads"]) for d in data["data"] if d["category"] == "without_mirrors"]
        time.sleep(2)  # pypistats asks callers to go easy
    return rows


def github_rows():
    today = dt.date.today()
    rows = []
    for repo in GITHUB:
        d = get(f"https://api.github.com/repos/{repo}")
        rows.append((today, d["full_name"], d["stargazers_count"], d["forks_count"], d["open_issues_count"]))
    return rows


def save(cur, table, keys, columns, rows):
    updates = ", ".join(f"{c} = EXCLUDED.{c}" for c in columns if c not in keys)
    execute_values(
        cur,
        f"INSERT INTO oss.{table} ({', '.join(columns)}) VALUES %s "
        f"ON CONFLICT ({', '.join(keys)}) DO UPDATE SET {updates}",
        rows,
    )


def main():
    (npm, gaps), pypi, github = npm_rows(), pypi_rows(), github_rows()
    conn = psycopg2.connect(os.environ["OSS_DATABASE_URL"])
    try:
        with conn, conn.cursor() as cur:
            cur.execute("DELETE FROM oss.npm_daily WHERE day = ANY(%s::date[])", (gaps,))
            save(cur, "npm_daily", ["day", "package"], ["day", "package", "downloads"], npm)
            save(cur, "pypi_daily", ["day", "package"], ["day", "package", "downloads"], pypi)
            save(cur, "github_daily", ["day", "repo"], ["day", "repo", "stars", "forks", "open_issues"], github)
    finally:
        conn.close()
    print(
        f"Saved {len(npm)} npm days, {len(pypi)} PyPI days and {len(github)} repositories' stars."
        f" Left out {len(gaps)} days npm has no counts for: {', '.join(gaps) or 'none'}."
    )


if __name__ == "__main__":
    main()
GitHub allows 60 requests an hour without a token, which nine repositories a day come nowhere near. To track hundreds, add a GitHub token as a second Secret and send it in an Authorization: Bearer header, which raises the limit to 5,000 an hour.
The SQL behind the main chart, the two SDKs by week:
WITH days AS (
  SELECT day, 'npm' AS src, downloads FROM oss.npm_daily WHERE package = '@modelcontextprotocol/sdk'
  UNION ALL
  SELECT day, 'pypi', downloads FROM oss.pypi_daily WHERE package = 'mcp'
)
SELECT CAST(date_trunc('week', day) AS date) AS week,
  round(avg(downloads) FILTER (WHERE src = 'npm')) AS "npm: @modelcontextprotocol/sdk",
  round(avg(downloads) FILTER (WHERE src = 'pypi')) AS "PyPI: mcp"
FROM days
WHERE day >= date_trunc('week', CURRENT_DATE) - interval '52 weeks'
  AND day < date_trunc('week', CURRENT_DATE)
GROUP BY 1 ORDER BY 1
Ask Claude about the numbers
With the tracker in Fastero, Claude can answer questions about it from any chat. We asked in claude.ai which MCP packages grew fastest in the last 30 days, compared with the 30 days before. Claude ran the SQL through Fastero and drew the answer in the chat.
Its first answer compared totals. npm's missing days fall unevenly across the two windows, seven in the latest and four in the one before, so the npm packages looked worse than they were: the TypeScript SDK showed +14% instead of +29%, and Playwright's MCP server a fall instead of a rise. Told about the gaps, Claude compared averages per day and redrew the chart:
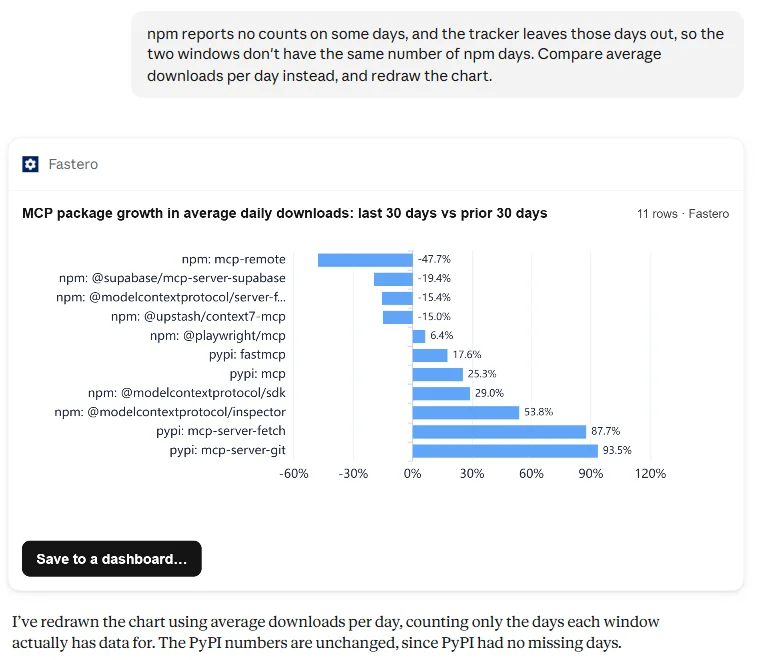
Claude in claude.ai with Fastero connected, on the tracker's live data, 27 October 2026.
On that measure the fastest growers were two small Python servers, mcp-server-git (+94%) and mcp-server-fetch (+88%), then the MCP Inspector (+54%) and the TypeScript SDK (+29%). mcp-remote fell most, by 48%. The button under the chart saves it to a dashboard.
Track your own packages
Change the three lists at the top of the job, NPM, PYPI and GITHUB, or ask Claude to. The next run fills in a year of npm history and pypistats' six months, and star history starts that day. Then ask for what you'd check by hand:
- "Email me when our package's average downloads per day, over the last week, fall below 1,000." A Fastero alert checks a saved query on a timetable, at most hourly, and emails when the number crosses the line and again when it comes back.
- "Put our package next to our two closest competitors." One more chart on the same dashboard.
- "Send the dashboard to the team every Monday at 9." A scheduled email with the dashboard attached.
The same pattern fits any public number with an API: Hacker News points, Docker Hub pulls, VS Code extension installs, a status page. A job collects it on a schedule, a table keeps the history, and a dashboard shows it to whoever needs it. We built two more trackers the same way: Claude API prices, from OpenRouter's model list, and Claude's outage history, from six services' status pages. For more of what Claude can build this way, see 15 Claude Code projects and Claude dashboards.
FAQ
How do I see a GitHub repository's star history?
GitHub's API reports today's count only. star-history.com rebuilds the past from the date each star was given and draws it for any public repository. To keep your own record, which you can query and alert on, save the count once a day, as the tracker above does from 27 October 2026.
How do I check npm download stats for a package?
A package's page on npmjs.com shows its weekly downloads, and npmtrends.com compares packages over time. For the numbers themselves, https://api.npmjs.org/downloads/range/2025-10-27:2026-10-26/<package> returns downloads per day as JSON, with no key.
How do I see PyPI download stats?
pypistats.org shows the last six months or so for any package, with and without mirrors, and its API returns the same as JSON. The complete history is in BigQuery's public bigquery-public-data.pypi.file_downloads table.
Why do npm downloads show zero on some days?
Because npm's statistics have gaps: on those days its API returns zero for every package. The tracker found 13 such days between July and October 2026, among them 19, 20 and 21 October. Leave those days out rather than counting them as zero, or weekly totals will show drops that never happened.
Can Claude update the tracker every day by itself?
Claude acts when you ask it something. The daily run belongs to Fastero: the schedule Claude set runs the job at 06:00 UTC whether or not anyone has Claude open, and the dashboard refreshes when the new rows land. Claude Code routines can also run on a timetable, but the history still needs a database to live in.
Do downloads mean users?
No. CI runs, rebuilt containers and mirrors all count, and one busy pipeline can fetch a package many times a day. Compare a package with itself over time, or with similar packages, rather than reading a download count as people.