 Fastero Dev Team
Claude is useful for SEO once it can see real numbers: which queries slipped, which pages lost clicks, which titles earn fewer clicks than their position should. Out of the box it can't see any of that, so the first decision is how to connect it, and that depends on whether you want an answer today or a report every month.
The short answer: Claude has no built-in link to Search Console or Google Analytics. For Google Analytics, Google's own experimental MCP server works in Claude Code. For Search Console there's no official server, only community and vendor ones. Those are good for one person asking questions today. For a report across clients, collect both into a database on a schedule, which also keeps history past Search Console's 16 months. Then Claude builds the dashboard once, a monthly email goes to the client, and you can ask Claude about any of it.
Fastero
Point Claude at your database.
Add Fastero to claude.ai or Claude Code. Claude builds the dashboard, deploys the app or publishes a live page, and your team opens it in Fastero.
Try free →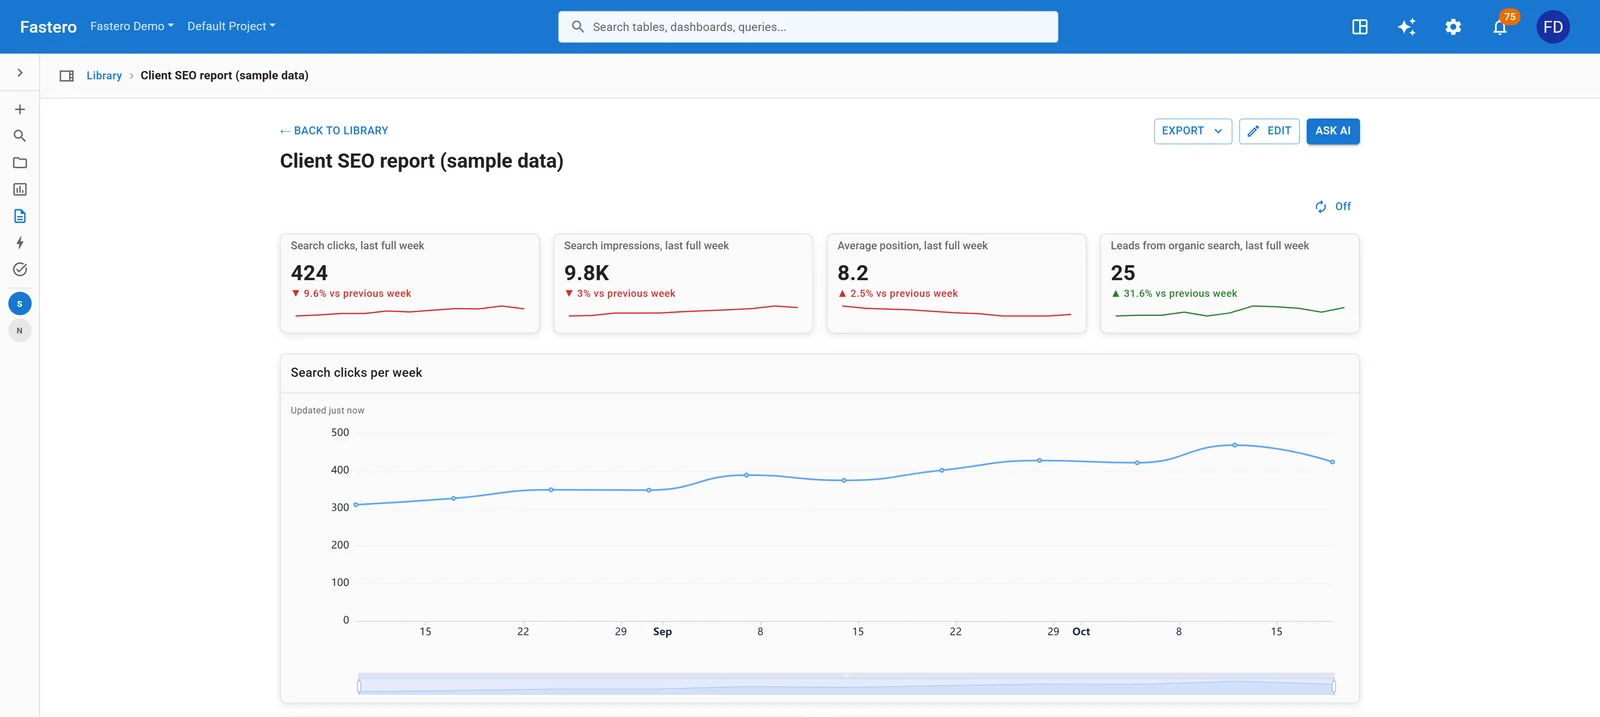
A client SEO report in Fastero. Sample data: an invented client.
What Claude is good at in SEO
Given your data, these are the jobs that pay off. Each is a prompt you can use as it stands:
- Find what moved. "Which queries lost the most position in the last 28 days against the 28 before? Only those with 100 impressions or more."
- Rewrite titles that underperform. "List pages ranking in the top 5 with a click rate below the site's typical rate for that position, and suggest a new title for each."
- Spot pages competing with each other. "Find queries where two or more of our pages get impressions, and say which should win."
- Group queries into topics. "Cluster our 500 queries with the most impressions by what the searcher wants, and show clicks per cluster."
- Write the monthly note. "Write three sentences for the client on what changed this month and why it matters, using only numbers from this report."
- Plan content. "Which queries do we rank 8 to 20 for, with no page written for that query? Suggest which to write first."
What it can't do from your own data is tell you how many people search for something you don't rank for, or what your competitors rank for. That needs a keyword tool, several of which now have MCP servers of their own.
How to connect Claude to your SEO data
| Route | What you get | Good for | Watch for |
|---|---|---|---|
Google Analytics MCP, from Google's googleanalytics GitHub organisation |
run_report, run_funnel_report, run_realtime_report and account details, on your GA4 properties |
One person asking GA4 questions in Claude Code | Marked experimental; runs on your machine with Google credentials |
| A community or vendor Search Console MCP | Search analytics and URL inspection | One person asking about one site | Google publishes none; quality varies, and you're handing a third party access |
| Ahrefs, Semrush or SE Ranking MCP | Keywords, backlinks and competitors from their data | Research beyond your own site | A paid plan with that vendor; not your Search Console data |
| Search Console and GA4 exports to BigQuery | Everything, in a warehouse Claude can query | Teams already on BigQuery | Google Cloud setup; starts when you turn it on, with no backfill for Search Console |
| A scheduled job into your own database | Both sources, your history, as many clients as you like | Agencies and recurring reports | A little setup, shown below |
The first three answer questions. None of them keeps a history, sends anything to a client, or gives a client somewhere to look. If that's what you need, a database has to sit in the middle.
Three traps in the numbers
Claude reads these numbers as confidently as you do, so these are worth knowing before you act on its answers:
1. Query rows don't add up to the total. Google hides rare queries for privacy, and they're often a large share of a site's clicks, especially for long-tail content. So the total from a query report is lower than the site's real total, and a filter such as "query doesn't contain our brand" also drops the hidden ones, which makes branded traffic look far bigger than it is. Page-level totals do reconcile. Measure brand by filtering for it, and work out non-brand as the site's total minus that.
2. A page's average position can fall while nothing got worse. When a page starts showing for new queries at lower positions, its average drops even though every query it already ranked for held steady. Before you call something a ranking loss, compare the same page and the same query in both periods. That's what the "Queries that moved most" table in this report does.
3. Some impressions aren't people. Tools that scrape Google show up as impressions. The pattern is a query jumping from almost nothing to hundreds or thousands of impressions a day, nearly all on desktop, spread oddly across countries, with no clicks at all. Before you rewrite a page for "lots of impressions but no clicks", split that query by date, country and device. It also means a site-wide click rate can fall sharply with no change in real traffic, so check clicks against Google Analytics, which should move together.
Build a client report with Claude
What you do yourself
- Create a Google service account in a Google Cloud project, turn on the Search Console API and the Analytics Data API, and download its JSON key.
- Give it access: add its email address as a user on each client's Search Console property, and as a Viewer on each GA4 property.
- In Fastero, save the secrets under Settings → Secrets: the key as
GOOGLE_SERVICE_ACCOUNTand your Postgres connection string asDATABASE_URL. Type them yourself rather than pasting them into a chat. Create a schema calledtrackersthat login can write to. - Connect the same database to Fastero with a read-only login, for the charts.
The prompt
With Fastero connected to Claude:
In Fastero, build an SEO report for our clients. A Python job should run every morning
at 06:00 UTC. For each client in a list at the top of the file, with its Search Console
site and GA4 property, it should use the service account in the Secret
GOOGLE_SERVICE_ACCOUNT to read Search Console clicks, impressions and position by day
and by day, query and page, and GA4 sessions, engaged sessions and key events by day
and channel. Save them in the trackers schema of the database in the Secret DATABASE_URL.
Rewrite the last five days on each run, and fill in the last 90 on the first. Run it
once and show me what it saved.

Then build a dashboard for Harbor Lane: clicks, impressions, average position and leads
from organic search as number cards with the change on the week before, clicks per week,
a table of the queries that moved most over 28 days against the 28 before, clicks by
page, and leads by channel. Email it to me on the 1st of each month at 9:00.
The job
It reads both APIs and fills three tables. Add requests and google-auth to a requirements.txt beside it. We ran these same calls against a real site and GA4 property before publishing: a full fill on the first run, and a clean replacement of the last days on the second. The numbers in the pictures here are invented:
"""Search Console and Google Analytics for each client, in one database.

Every morning: each client's Search Console clicks, impressions and position by day, by query
and page, and GA4 sessions and key events by channel, saved into Postgres (the Secret
DATABASE_URL). A Google service account (the Secret GOOGLE_SERVICE_ACCOUNT, its JSON key) reads
them; add its email address to each client's Search Console property and GA4 property. Search
Console keeps 16 months and its last few days can still change, so each run rewrites the last
five days; the first run fills in the last 90. Search Console's newest data takes a couple of
days to settle, and this job asks only for final data.
"""
import datetime as dt
import json
import os
import urllib.parse

import psycopg2
import requests
from google.auth.transport.requests import Request
from google.oauth2 import service_account
from psycopg2.extras import execute_values

CLIENTS = [
    {"client": "Harbor Lane Home Services", "site": "sc-domain:harborlane.example", "ga4_property": "123456789"},
]
SCOPES = ["https://www.googleapis.com/auth/webmasters.readonly", "https://www.googleapis.com/auth/analytics.readonly"]

TABLES = """
CREATE TABLE IF NOT EXISTS trackers.seo_daily (
  client text NOT NULL, day date NOT NULL, clicks int, impressions int, position numeric,
  PRIMARY KEY (client, day)
);
CREATE TABLE IF NOT EXISTS trackers.seo_queries (
  client text NOT NULL, day date NOT NULL, query text NOT NULL, page text NOT NULL, clicks int, impressions int, position numeric,
  PRIMARY KEY (client, day, query, page)
);
CREATE TABLE IF NOT EXISTS trackers.ga4_channels (
  client text NOT NULL, day date NOT NULL, channel text NOT NULL, sessions int, engaged_sessions int, key_events numeric,
  PRIMARY KEY (client, day, channel)
)"""


def access_token():
    info = json.loads(os.environ["GOOGLE_SERVICE_ACCOUNT"])
    credentials = service_account.Credentials.from_service_account_info(info, scopes=SCOPES)
    credentials.refresh(Request())
    return credentials.token


def search_console(token, site, start, end, dimensions):
    """Every row Search Console will give, 25,000 at a time."""
    url = f"https://www.googleapis.com/webmasters/v3/sites/{urllib.parse.quote(site, safe='')}/searchAnalytics/query"
    rows, start_row = [], 0
    while True:
        r = requests.post(
            url,
            headers={"Authorization": f"Bearer {token}"},
            json={"startDate": start, "endDate": end, "dimensions": dimensions, "dataState": "final", "rowLimit": 25000, "startRow": start_row},
            timeout=120,
        )
        r.raise_for_status()
        batch = r.json().get("rows", [])
        rows += batch
        if len(batch) < 25000:
            return rows
        start_row += 25000


def ga4(token, prop, start, end):
    r = requests.post(
        f"https://analyticsdata.googleapis.com/v1beta/properties/{prop}:runReport",
        headers={"Authorization": f"Bearer {token}"},
        json={
            "dateRanges": [{"startDate": start, "endDate": end}],
            "dimensions": [{"name": "date"}, {"name": "sessionDefaultChannelGroup"}],
            "metrics": [{"name": "sessions"}, {"name": "engagedSessions"}, {"name": "keyEvents"}],
            "limit": 100000,
        },
        timeout=120,
    )
    r.raise_for_status()
    return r.json().get("rows", [])


def save_client(cur, token, c, start, end):
    name = c["client"]
    for table in ("seo_daily", "seo_queries", "ga4_channels"):
        cur.execute(f"DELETE FROM trackers.{table} WHERE client = %s AND day BETWEEN %s AND %s", (name, start, end))
    daily = [(name, r["keys"][0], r["clicks"], r["impressions"], r["position"]) for r in search_console(token, c["site"], start, end, ["date"])]
    queries = [(name, *r["keys"], r["clicks"], r["impressions"], r["position"]) for r in search_console(token, c["site"], start, end, ["date", "query", "page"])]
    channels = [
        (name, dt.datetime.strptime(r["dimensionValues"][0]["value"], "%Y%m%d").date(), r["dimensionValues"][1]["value"], *[float(m["value"]) for m in r["metricValues"]])
        for r in ga4(token, c["ga4_property"], start, end)
    ]
    if daily:
        execute_values(cur, "INSERT INTO trackers.seo_daily VALUES %s", daily)
    if queries:
        execute_values(cur, "INSERT INTO trackers.seo_queries VALUES %s", queries)
    if channels:
        execute_values(cur, "INSERT INTO trackers.ga4_channels VALUES %s", channels)
    return len(daily), len(queries), len(channels)


def main():
    token = access_token()
    conn = psycopg2.connect(os.environ["DATABASE_URL"])
    try:
        with conn, conn.cursor() as cur:
            cur.execute(TABLES)
            cur.execute("SELECT count(*) FROM trackers.seo_daily")
            days_back = 5 if cur.fetchone()[0] else 90
            today = dt.datetime.now(dt.timezone.utc).date()
            start, end = (today - dt.timedelta(days=days_back)).isoformat(), (today - dt.timedelta(days=1)).isoformat()
            for c in CLIENTS:
                d, q, ch = save_client(cur, token, c, start, end)
                print(f"{c['client']}: {d} days, {q} query rows, {ch} channel rows from {start} to {end}.")
    finally:
        conn.close()


if __name__ == "__main__":
    main()
One thing to change on a second client: the check for "is this the first run?" looks at the whole table, so a client added later only gets the last five days. Ask Claude to backfill them, or run the job once with days_back = 90.
Finding what moved
The table that earns its place in the report compares each query with itself:
WITH w AS (
  SELECT query, day >= CURRENT_DATE - 28 AS recent, sum(clicks) AS clicks,
    sum(position * impressions) / sum(impressions) AS position
  FROM trackers.seo_queries
  WHERE client = 'Harbor Lane Home Services' AND day >= CURRENT_DATE - 56
  GROUP BY 1, 2
)
SELECT n.query AS "Query", n.clicks AS "Clicks", o.clicks AS "Clicks before",
  round(n.position, 1) AS "Position", round(o.position, 1) AS "Position before",
  round(n.position - o.position, 1) AS "Change"
FROM w n JOIN w o ON n.query = o.query AND n.recent AND NOT o.recent
ORDER BY abs(n.position - o.position) DESC LIMIT 12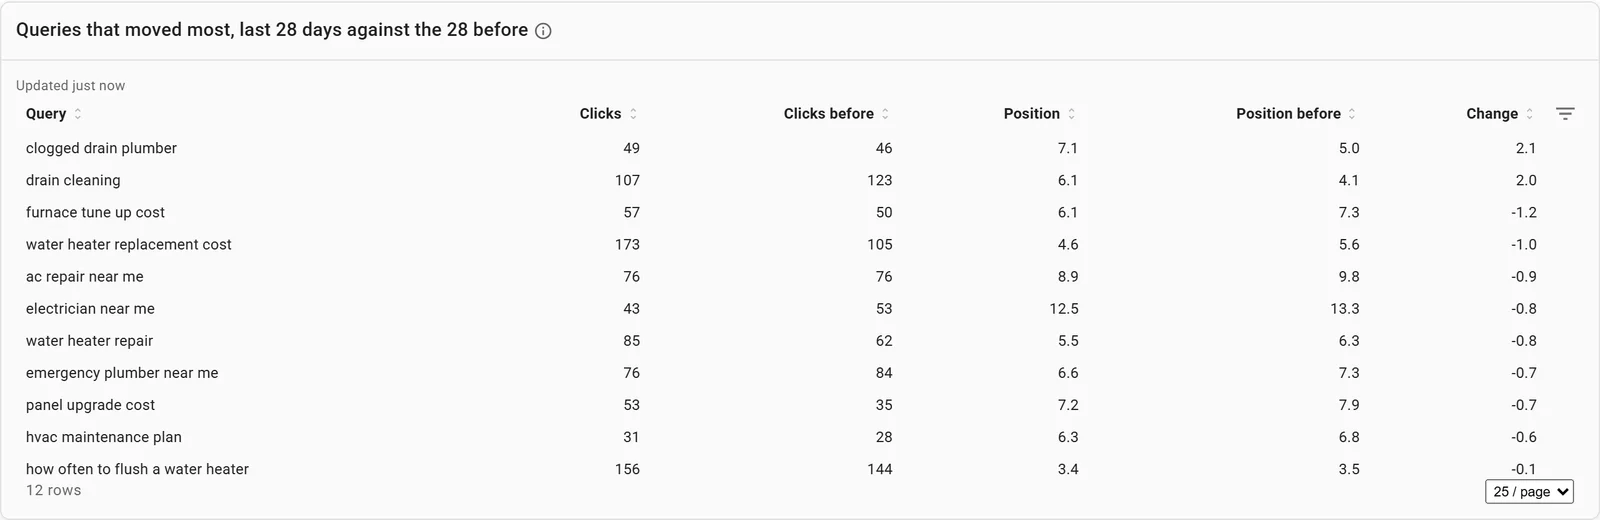
In this sample, the two drain cleaning queries are the ones to look at. Sample data.
Then ask Claude: "Why might the drain cleaning page have lost ground? Check when it started and which of its queries moved." It can query the table by day and tell you when the slide began, which is where to start looking.
Getting it to the client
- A monthly email. Each run recalculates the numbers and emails the dashboard itself: number cards, charts as pictures, the first rows of each table, a short summary, and a PDF of the whole report. How the scheduled email works.
- A login. Give each client their own project, then invite them as a viewer; viewers are free. Recipients of the email must be members of the workspace, and a person adds outside addresses, not Claude.
- A public link. For a client who won't sign in: a person confirms it once in Fastero, and anyone with the link can open it.
If you already send client reports by hand, see our best AgencyAnalytics alternatives for how this compares with a dedicated reporting tool.
FAQ
Can Claude do SEO?
It can do the analysis and writing parts well: finding queries that moved, rewriting titles, grouping queries into topics, drafting briefs and client notes. It needs your data to do them on real numbers, and it can't see search volumes or competitors' rankings without a keyword tool connected.
How do I connect Google Search Console to Claude?
Google publishes no official MCP server for Search Console, so you can use a community or vendor server, or collect the data on a schedule into a database that Claude can query through a connector. The first is quicker for one site; the second keeps history and suits several clients.
Is there a Google Analytics MCP server?
Yes. It's in the googleanalytics GitHub organisation, marked experimental, and runs on your machine with Google credentials. Its tools include run_report, run_funnel_report and run_realtime_report, and apart from one annotation tool it only reads.
Can Claude build an SEO report?
Yes. In a chat it can build one from an export you upload, as a one-off. Connected to a tool like Fastero it can build a dashboard on live tables and schedule an email, so the report runs every month without you asking again.
How far back does Search Console data go?
16 months in Search Console and its API. To compare further back, you have to have saved it yourself, which is one reason to collect it into a database from the start.
Why do my Search Console numbers not add up?
Google hides rare queries for privacy, so query rows add up to less than the site's total. The API also returns top rows rather than every row. Page-level totals reconcile much better, so use those for totals and query rows for finding what changed.
Sources
Read on 31 October 2026:
- Google — Search Analytics: query, Google Analytics MCP server
- MCP servers for SEO — Best SEO MCP servers in 2026 (SE Ranking), Google Search Console MCP 2026 (Enrich Labs), 4 ways to connect Google Search Console to Claude (Porter Metrics)
- Fastero — Claude connectors, Automate reports with Claude
Try Fastero free — put Search Console and GA4 in one client dashboard, with a monthly email. No credit card required.