
An artifact is the page Claude builds beside the chat: a dashboard, a calculator, a small app you can click through and share. For data work they're the fastest way from "here's a spreadsheet" to something you can actually look at.
The short answer: the artifacts that work best for data are dashboards from an uploaded file, analysis views (cohorts, funnels, variance), calculators with sliders, and small tools that save their state or call a connector. Below are twelve, each with a prompt you can paste. Anthropic's own example prompts are marked; the rest are ours. All of them work from a CSV or Excel file you upload, except the last two, which use Pro-plan features.
Before you start
Checked 13 October 2026.
- Artifacts are on every plan, Free included, since 16 September 2026 — with the code execution and file creation setting turned on.
- Uploads: CSV, TSV and Excel work; with code execution, each file can be up to 30 MB.
- What you get is a snapshot. The page holds the numbers from your file; next month's numbers need next month's file — unless the page calls a connector (example 11).
- Sharing: artifacts start private, and everyone you share one with needs a Claude account to open it. How sharing works.
1. A KPI dashboard from a spreadsheet
Three or four headline numbers with their change, a trend and a breakdown — the page most teams start with.
Build a dashboard from this file: revenue, orders and average order value as number cards with the change since last month, revenue by month as a line chart, and revenue by region as a bar chart. Add a region filter.
Tip: name the measures and the cuts. "Make a dashboard" gets you Claude's guess; "revenue by month and by region" gets you yours.
Fastero
Point Claude at your database.
Add Fastero to claude.ai or Claude Code. Claude builds the dashboard, deploys the app or publishes a live page, and your team opens it in Fastero.
Try free →2. Weekly signups by plan
Anthropic's own example for its Dashboards template works just as well on an exported file.
Show weekly signups for the last six months, split by plan. (Anthropic's example)
Tip: follow up with "How do this month's signups by channel compare with last month's?" and "Add a filter for region" — iterating in the same chat refines the same page.
3. A sales funnel
Stage counts become a funnel with the conversion rate between each step, which is where the drop-off conversation starts.
Turn these stage counts into a funnel chart with the conversion rate between each stage and from the top. Highlight the biggest drop.
4. A cohort retention heatmap
The classic retention view: each signup month as a row, months since signup as columns, shaded by the share still active.
From this events file (user_id, signup_date, active_date), build a monthly cohort retention heatmap: rows are signup months, columns are months since signup, cells are the percentage of the cohort active that month. Show cohort sizes.
Tip: ask Claude to state how it defined "active" in a note on the page, so nobody reads the heatmap differently.
5. Budget vs actuals
Department budgets against actual spend, with the variance in money and percent and the overspends flagged.
Compare budget and actuals by department: show both side by side, the variance in dollars and percent, and flag any department more than 10% over. Add a total row.
6. An A/B test calculator
An interactive tool rather than a chart: enter visitors and conversions for two variants and see the rates, the lift and whether the difference is likely to be real.
Build an A/B test calculator: inputs for visitors and conversions in A and B; show each conversion rate, the relative lift, a 95% confidence interval for the difference and a plain-English verdict.
7. A revenue forecast
Claude fits a simple model to your history and draws the next months with a range around them.
Fit a trend with monthly seasonality to this revenue history and chart the next six months with an 80% range. Explain in two sentences what's driving the forecast.
Tip: treat it as a sketch. For a forecast the business will plan on, check the method Claude chose.
8. A what-if pricing model
Sliders for the assumptions, a chart that moves with them. Anthropic's own visuals launch used exactly this kind of prompt — "visualize how this might change over time" — on a compound-interest example.
Build a what-if model for our subscription revenue: sliders for price, new customers per month and monthly churn, and a chart of MRR over 24 months. Start from these current numbers.
9. A data-quality report
Before anyone builds a dashboard on a file, a page that shows what's wrong with it.
Profile this CSV: for each column show the type, missing values, distinct values and outliers, and list duplicate rows. Make it an interactive report I can sort by number of problems.
10. A feedback tagger that calls Claude
Artifacts can call Claude from inside the page, so a small tool can classify text as you paste it. The usage counts against the plan of whoever is using the artifact, and it asks for permission the first time.
Build a tool where I paste customer comments, one per line, and it tags each with a topic and a sentiment using Claude, then shows counts by topic as a bar chart.
11. A live board on a connector
On Pro plans and above, an artifact can call your connectors when it opens, so the page shows current data instead of a snapshot. Anthropic's example uses GitHub:
Build a dashboard artifact of our open pull requests that pulls the live list through my GitHub connector when the page loads. (Anthropic's example)
The catch: every viewer's own connection is used. A colleague who hasn't connected GitHub sees the page without its live sections, and owners can switch connector calls off for the whole organisation.
12. A tracker that remembers
On Pro plans and above, an artifact can store data — personal, or shared with everyone who uses it, up to 20 MB of text per artifact — so a small team tool keeps its state between visits.
Build a shared OKR tracker: each objective with key results, an owner and progress from 0 to 100%. Save changes so everyone who opens it sees the latest progress.
When an artifact isn't enough
Artifacts are excellent for exploring a file and for one-off tools. They run out when a dashboard has to show this week's numbers from your own database, for people who don't all use Claude. That's the job Fastero does: connect Claude to Fastero and it builds the dashboard inside your workspace, on your database, where colleagues open it with their own login and every open runs the queries fresh. In claude.ai, Fastero also draws each chart right in the conversation, with a button that saves it to the dashboard:
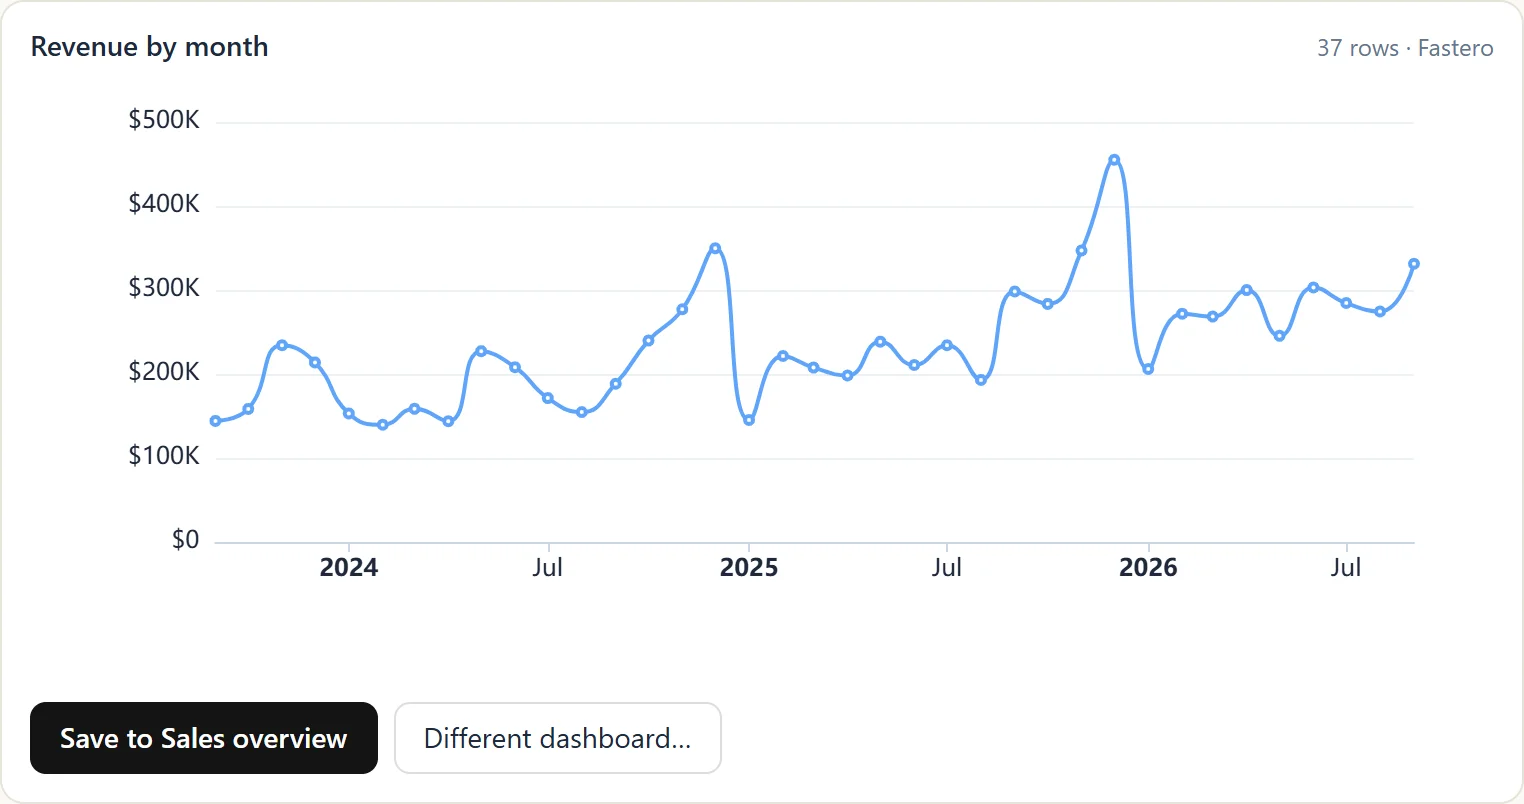
Fastero's chart card in Claude, drawn from your database. Sample data.
For the five ways to build a dashboard with Claude, and which ones stay live, see Claude dashboard: 5 ways to build one.
FAQ
What are Claude artifacts?
Artifacts are pages Claude creates beside the conversation — documents, code, diagrams, single-page sites, dashboards and small interactive tools. You can iterate on one by asking for changes, publish it, and share it with people who have a Claude account.
Can Claude artifacts use my own data?
Yes. Upload a CSV, TSV or Excel file and Claude builds the artifact from it; with code execution on, each file can be up to 30 MB. On Pro plans and above, an artifact can also fetch live data from your connectors, through each viewer's own connection.
Do Claude artifacts update when the data changes?
Not on their own: an artifact built from a file shows that file's numbers. One that calls connectors fetches fresh data when it opens. For a dashboard that refreshes from your database for the whole team, host it in a tool built for that, such as Fastero.
Can I share a Claude artifact with people who don't use Claude?
Artifacts made in a chat need a Claude account to open, even with the link. Older artifacts published from a chat are the exception. To share live numbers with colleagues who don't use Claude, publish them somewhere they can sign in to.
Are Claude artifacts free?
Basic artifacts are on every plan, including Free, since 16 September 2026. Calling connectors and saving data inside an artifact need Pro or above; the Dashboards template is in beta on paid plans.
Sources
Checked on 13 October 2026:
- What are artifacts (types, plans, connectors, storage, artifacts that call Claude) and Share artifacts — Claude Help Center
- Claude release notes (artifacts on every plan, 16 September 2026) · Claude creates files (upload types and the 30 MB limit)
- Dashboards help article (example prompts 2 and the follow-ups) · Claude Code artifacts (example 11)
- Claude builds visuals (12 March 2026) · Build artifacts (storage and connectors in artifacts)
Related reading:
- Claude Dashboard: 5 Ways to Build One
- How Sharing a Claude Artifact With Colleagues Works
- MCP Apps Explained
Try Fastero free — when an artifact needs live numbers from your database, let Claude build it in Fastero for your whole team. No credit card required.