
Ask Claude for "revenue by region this quarter" and you'll get a dashboard in under a minute. Which kind of dashboard depends on where your data lives and who needs to open it next Monday — and that decides whether it's a one-off picture or something your team can rely on.
The short answer: for a one-off look at a file, ask Claude in the chat and it builds a dashboard artifact. For a warehouse such as Snowflake or BigQuery, and colleagues who use Claude, try Claude's new Dashboards template (beta). For a dashboard on your own database — Postgres included — that your whole team opens with live numbers, whether or not they use Claude, connect Claude to Fastero: Claude builds it there, and your colleagues open it with their own login.
The five ways at a glance
Checked 13 October 2026.
| Way | Where the data comes from | Do the numbers stay live? | Who can open it |
|---|---|---|---|
| A chart or artifact in the chat | Files you upload, or numbers in the conversation | No — a snapshot | People you share it with; each needs a Claude account |
| An artifact that calls connectors | Your connected apps, through each viewer's own connection | Yes, when the page opens | Signed-in Claude users with their own connections |
| Claude Dashboards (beta, paid plans) | Redshift, BigQuery, ClickHouse, Databricks, Snowflake or Salesforce | Kept current, Anthropic says; each chart shows when it last refreshed | Shared like an artifact, within what your admin allows |
| Claude Code writes the dashboard | Your database, through an MCP server on your machine | Only if you host it with a backend | Whoever can reach where you put it |
| Claude builds it in Fastero | Your database, through Fastero's connector | Yes — queries run on every open, or when the data changes | Your team, with their Fastero login; no Claude account needed |
1. Ask in the chat: a chart or a dashboard artifact
Upload a CSV or an Excel file and ask for a dashboard, and Claude analyses it with code execution and builds an artifact — a single interactive page with charts, filters and number cards. Since March 2026 it can also draw charts straight into its reply, and since 16 September artifacts are on every plan, Free included, as long as the code execution and file creation setting is on.
Good prompts are specific about the measures and the cut:
Build a dashboard from this file: revenue by month, revenue by region, and the top 10 products, with a region filter.
What you get is a snapshot of the file you uploaded. Share it and colleagues need a Claude account to open it; next month's numbers need next month's file. See how sharing a Claude artifact with colleagues works for the options.
Best for: a fast first look at a spreadsheet.
Fastero
Point Claude at your database.
Add Fastero to claude.ai or Claude Code. Claude builds the dashboard, deploys the app or publishes a live page, and your team opens it in Fastero.
Try free →2. An artifact that calls connectors
On Pro plans and above, an artifact can call your connectors — Slack, Asana, Google Calendar or any custom connector — so the page fetches current data each time it opens. Claude Code can publish pages like this too, refreshing on load, on a timer or from a button.
The catch is whose connection the page uses: every viewer's own. A colleague who hasn't connected the same app sees the page without its live sections, and two viewers can see different numbers. Owners can switch connector calls off for the whole organisation.
Best for: a team that's all on Claude and connected to the same tools.
3. Claude Dashboards (beta)
On 8 October 2026 Anthropic added a Dashboards template, in beta on paid plans. Connect a warehouse — Redshift, BigQuery, ClickHouse, Databricks or Snowflake — or Salesforce, ask for a dashboard, and Claude writes one SQL query per chart. Each chart shows its query and when it was last refreshed, and you can hand a dashboard on to Amplitude, Grafana or Hex.
Build a dashboard of this quarter's revenue by region, and weekly signups for the last six months split by plan.
It's the right tool if your data already sits in one of those warehouses and the people reading it use Claude. If your numbers live in Postgres, MySQL or a SaaS app outside that list, it can't reach them.
Best for: warehouse teams already on a paid Claude plan.
4. Claude Code writes the dashboard
Give Claude Code access to your database through an MCP server — Anthropic's docs show a read-only Postgres connection through DBHub — and ask it to build the page:
Query our orders table for revenue by month and by channel, and write the results to an HTML page with charts, then open it in my browser.
Claude Code can write a static HTML page, a React app or a Streamlit dashboard, and on Pro plans and above it can publish the page as an artifact. Making it live for a team is your job from there: a backend that queries the database safely, a login, and somewhere to run it.
Best for: developers who want full control over the code.
5. Claude builds it in Fastero
This is the option for a dashboard your team opens every week on live company data. Connect Claude to Fastero and Claude works inside your workspace: it connects your database, writes and saves the queries, and builds a dashboard of number cards, charts, tables and filters. Your colleagues open it with their own Fastero login, and every open runs the saved queries against your database.
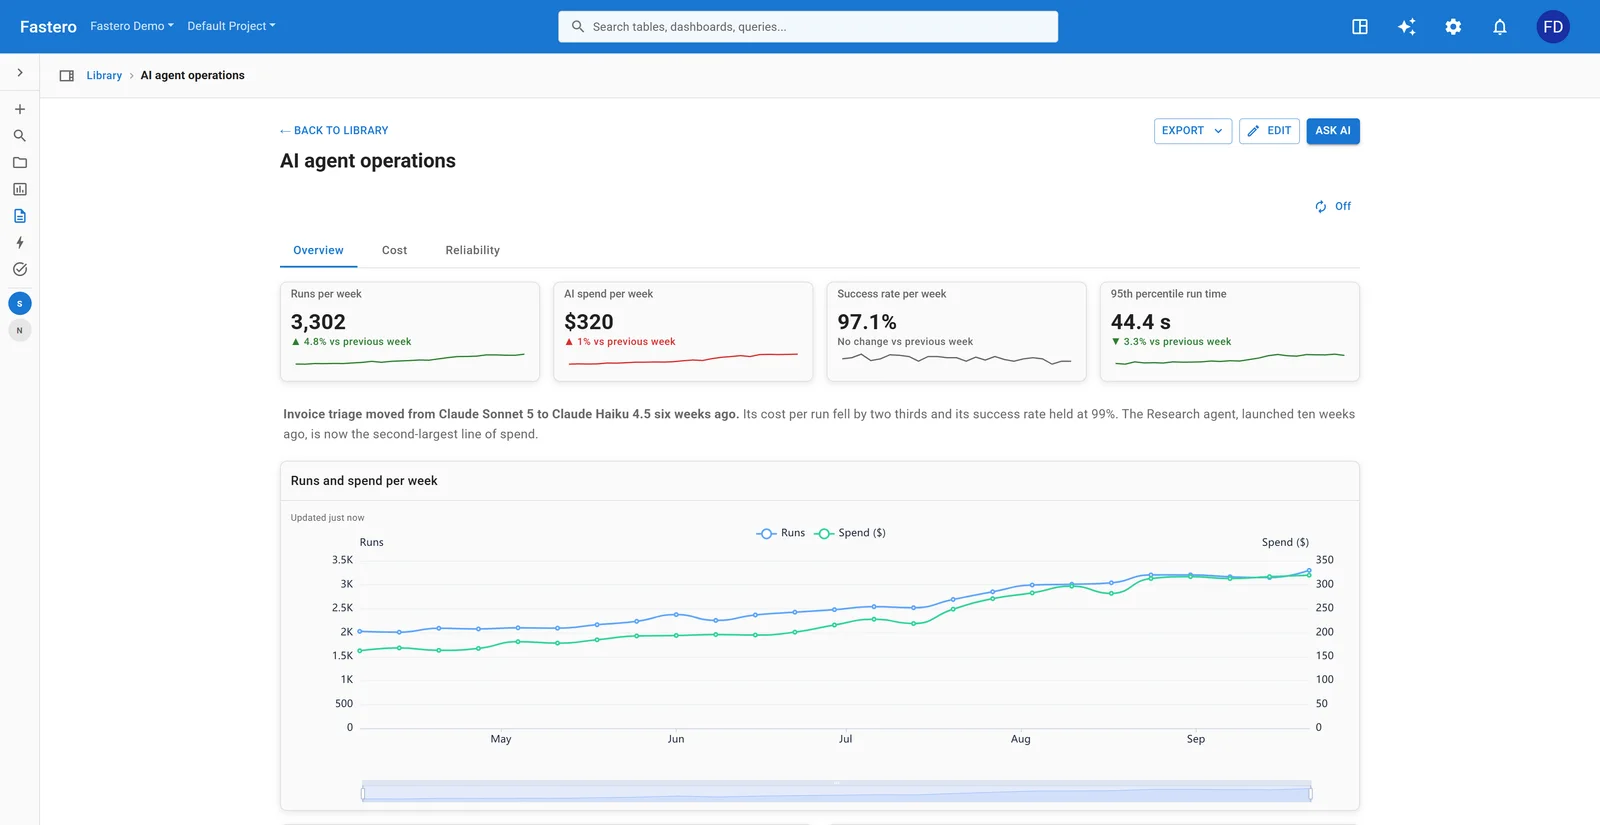
A dashboard Claude built through the Fastero connector. Sample data.
What changes for your team:
- No Claude account needed to view it. Teammates sign in to Fastero and land on the dashboard; viewers are free.
- It stays current. The dashboard can refresh on a timer or whenever the data changes, so open screens show today's numbers.
- It arrives every Monday. Ask Claude to email it weekly and each recipient gets a PDF of the whole dashboard, run fresh that morning.
- You see the chart before you keep it. In claude.ai, Fastero draws each chart right in the conversation, with a button that saves it to the dashboard.
- Claude acts as you, never more. It works in one workspace, within your own permissions, and revoking the connector ends it at once.
How to build a Claude dashboard in Fastero
- Connect Claude. In claude.ai, add
https://api.fastero.com/api/v1/mcpas a custom connector and sign in to Fastero — Claude Code signed in with the same account picks it up too. Or create a key in Fastero under Settings → Developers → AI Agent Access, choosing Build dashboards, and paste the one-lineclaude mcp addcommand it gives you. - Point it at your data. Connect your database in Fastero, or ask Claude to connect it with a read-only user.
- Ask for the dashboard. "Build a weekly sales dashboard from our orders table: revenue, orders and average order value as number cards with the change since last week, revenue by month, and orders by region, with a region filter."
- Share it. Invite teammates from the dashboard's share menu, or ask Claude to schedule the Monday email.
The full walkthrough, with the database setup and the checks, is in Claude Code + Postgres: build a dashboard your team can open.
Best for: a team dashboard on your own database, for people who don't all use Claude.
Which should you use?
- A quick look at a spreadsheet: ask in the chat.
- Live data from team tools, everyone on Claude: an artifact that calls connectors.
- A warehouse dashboard for Claude users: Claude Dashboards.
- Full control of the code: Claude Code, hosted by you.
- Your own database, live numbers, opened by the whole team: Claude in Fastero.
FAQ
Can Claude make a dashboard?
Yes, in several ways: as an artifact from a file you upload, as a live page that calls your connectors, with the Dashboards template on a supported warehouse (beta, paid plans), as code written by Claude Code, or inside a dashboard tool such as Fastero through its connector.
Can Claude connect to my database to build a dashboard?
Claude's Dashboards template connects to Redshift, BigQuery, ClickHouse, Databricks, Snowflake and Salesforce. For Postgres and other databases, use an MCP server — in Claude Code, or through a connector such as Fastero's, which connects the database inside Fastero and lets Claude query it with your permissions.
Does a Claude dashboard update automatically?
An artifact built from an uploaded file doesn't: it shows the numbers from that file. A page that calls connectors fetches data when it opens, through each viewer's own connection. A dashboard in Fastero runs its saved queries on every open, and can refresh on a timer or when the data changes.
Can someone without a Claude account open my dashboard?
Not a dashboard artifact made in a chat: everyone needs a Claude account, even with the link. A dashboard Claude builds in Fastero opens for anyone you invite to your workspace, with their Fastero login.
Is Claude Dashboards free?
No. As of October 2026 the Dashboards template is in beta on paid Claude plans. Basic artifacts are available on every plan, including Free.
Sources
Checked on 13 October 2026:
- Dashboards and Motion (8 October 2026) and the Dashboards help article — Anthropic
- What are artifacts, Share artifacts and Claude release notes — Claude Help Center
- Claude creates files and Claude builds visuals (12 March 2026)
- Share session output as artifacts and Connect Claude Code to tools via MCP — Claude Code docs
- Fastero MCP server · Fastero pricing
Related reading:
- Claude Code + Postgres: Build a Dashboard Your Team Can Open
- How Sharing a Claude Artifact With Colleagues Works
- MCP Apps Explained
Try Fastero free — point Claude at your database and get a dashboard your whole team can open, with live numbers. No credit card required.