 Fastero Dev Team
Claude Code shows your own usage with one command. Seeing a whole team's usage is harder, because which numbers you can get depends on how you pay for it, and most of the options cover some plans and not others. This guide goes through both, then shows how to build a team dashboard with a weekly email and an alert on a runaway day.
The short answer: run /usage inside Claude Code to see your plan's usage bars, what's using them, and your session's tokens and estimated cost. For your history on one machine, npx ccusage@latest daily reads Claude Code's local logs. For a team, use the analytics dashboard that comes with your plan: claude.ai/analytics/claude-code on Team and Enterprise, platform.claude.com/claude-code on the API. Anthropic says the average across enterprise deployments is about $13 per developer per active day and $150–250 per developer per month, and under $30 per active day for 90% of users.
Fastero
Point Claude at your database.
Add Fastero to claude.ai or Claude Code. Claude builds the dashboard, deploys the app or publishes a live page, and your team opens it in Fastero.
Try free →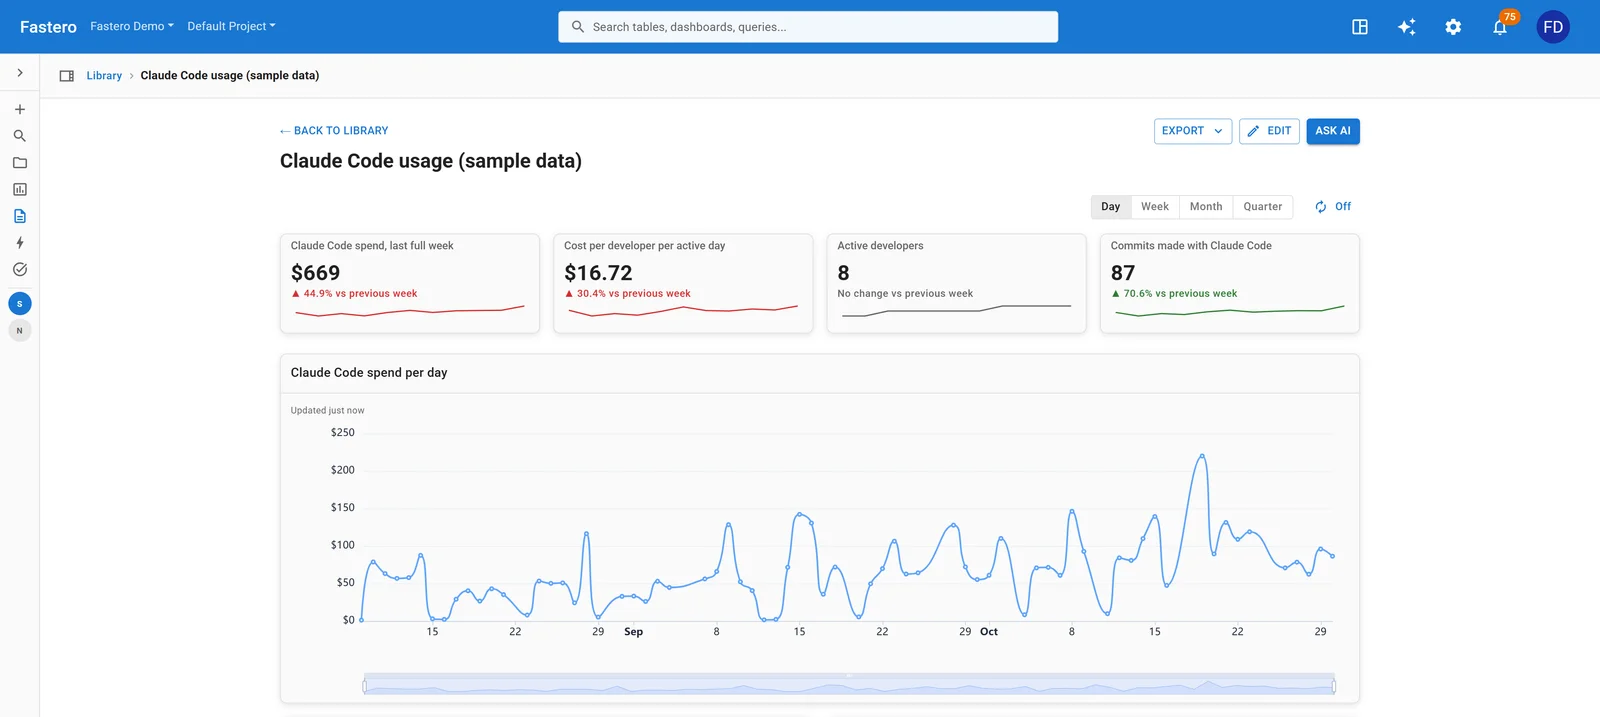
A team's Claude Code usage in Fastero. Sample data: an invented team of eight.
How to check your own usage
| Where | What it shows | What it leaves out |
|---|---|---|
/usage in Claude Code |
Plan usage bars, activity, the share of recent usage going to skills, subagents, plugins and each MCP server, with recommendations. The Session block adds tokens and an estimated cost | Usage from other devices and claude.ai, in the breakdown |
| claude.ai/settings/usage | Your plan's usage, and usage credits if you've turned them on | Per-project detail |
npx ccusage@latest daily |
Tokens and estimated cost by day, week, month or session, from local logs. Add --json for data |
Other machines; web search calls; its costs are estimates |
/insights in Claude Code |
A written report on how you work, with friction points and suggestions | Tokens and cost |
| Claude Console usage page | The authoritative bill, if you pay through the API | Subscription usage |
Two details are easy to miss. The dollar figure in /usage is computed locally from token counts at list price, so it's an estimate; on a subscription it isn't what you pay at all. And press d or w in /usage to switch the breakdown between the last 24 hours and the last 7 days. If a row says something like 25% Trim ~/code/api/CLAUDE.md · 49k tokens per request, the percentage is the share of your usage that row applies to, not what you'd save.
Claude Code usage limits
On a subscription, Claude Code draws from an allowance that resets on a rolling five-hour window and a weekly window, shared with Claude chat and Cowork on Team and Enterprise seats. What you see when you hit one tells you which it is:
| Message | What it means | What you can do |
|---|---|---|
| "You've hit your session limit" or "weekly limit" | The usage window, across all models | Wait for the reset it shows, or run /usage-credits if usage credits are on. Switching model doesn't help |
| "You've hit your Opus limit" or "Sonnet limit" | That model family only | Switch with /model |
| "You've hit your individual spend limit", or your org's or team's | Usage credits reached a limit someone set | An admin raises it under Organization settings > Usage |
| A context or auto-compact warning | Not a usage limit: the conversation is long | /clear or /compact |
Usage climbs faster than activity suggests in a long session, because Claude Code sends the whole conversation with every request. A one-line question in a session that's been open all day still draws usage for all of it, and your first message after a break can miss the cache and reprocess everything. Subagents, agent teams and scheduled tasks each send their own requests on top.
What helps most, from Anthropic's own list: /clear between unrelated tasks (it costs nothing, while /compact is itself a large request), Sonnet for most work and Opus for the hard parts, a lower /effort, a CLAUDE.md under 200 lines with specialised instructions moved into skills, and switching off MCP servers you aren't using.
What Claude Code costs
Anthropic publishes these figures for enterprise deployments:
- About $13 per developer per active day
- $150–250 per developer per month
- Under $30 per active day for 90% of users
On the API you pay per token: see every Claude model's price. The bill moves with model choice, codebase size, and habits such as running several instances at once. Agent teams use roughly seven times the tokens of a standard session when teammates run in plan mode.
On a Team seat or an older seat-based Enterprise plan, usage inside the allowance isn't metered in dollars at all; only usage credits beyond it are. Current Enterprise plans include no allowance and bill all usage at API rates. So "what does each person cost us?" has no direct answer there, and token counts are the closer measure.
What you can see for a team, by plan
This is where most of the confusion sits. Each route covers some plans and not others:
| How you pay | Dashboard | Per-person numbers | Cap spend |
|---|---|---|---|
| Claude for Teams | claude.ai/analytics/claude-code: active users, sessions, accepted lines, a leaderboard | Spend report CSV. No API on this plan | Seat allowance, then spend limits on usage credits |
| Claude Enterprise | The same dashboard | Spend report CSV, and the Enterprise Analytics API with a read:analytics key |
Usage at API rates, with spend limits (older seat-based plans: seat allowance first) |
| API, through the Claude Console | platform.claude.com/claude-code: accepted lines, activity, spend, spend per member | Claude Code Analytics API with an Admin API key | Workspace spend limits |
| Bedrock, Google Cloud, Microsoft Foundry | None from Anthropic | OpenTelemetry or an LLM gateway | Your cloud's budget controls |
| Any of them | Your own | OpenTelemetry: CLAUDE_CODE_ENABLE_TELEMETRY=1 sends tokens, cost, sessions and commits to your collector |
The traps:
- The Claude Code Analytics API doesn't include subscriptions. Anthropic is plain about it: when someone signs in with a Pro, Max, Team or Enterprise plan, "this API doesn't return it." A company on a Team plan gets an empty answer, not an error.
- ccusage only sees one machine. It reads the files on the laptop it runs on, so it can't add up a team by itself.
- Spend in the dashboards is an estimate. Anthropic says to use the billing page for actual costs. By default Claude Code prices everything at list price, unless an admin sets a
modelPricingtable. - Contribution metrics need extra setup. Pull requests and lines shipped with Claude Code need the GitHub app, cover github.com only, and aren't available to API customers. They're also deliberately conservative: code rewritten by more than 20% stops counting.
Why build your own dashboard
The built-in dashboards answer "are people using it, and roughly what does it cost?" You'd build your own when you need what they don't do:
- An alert on a runaway day. One session left running can cost more than a developer's whole week, and nobody looks at a dashboard to find out.
- A Monday email to engineering leads who don't have admin access to Claude.
- Your own numbers beside it, such as cost per merged pull request, or spend by team from your HR system.
- A history you keep, in your own database, for your own questions.
- Asking Claude about it: "who's using Opus for everything?" gets a real answer from a table.
Build it with Claude
This route suits teams paying through the API, since it reads the Claude Code Analytics API. The dashboard above runs on invented numbers, in the same tables this job fills.
What you do yourself
- In the Claude Console, create an Admin API key. Only an organisation can have one, and it needs the admin role.
- In Fastero, add it under Settings → Secrets as
ANTHROPIC_ADMIN_KEY. Add your Postgres connection string asDATABASE_URL, and create a schema calledtrackersthat login can write to. Type both yourself rather than pasting them into a chat. - Connect the same database to Fastero with a read-only login, for the charts.
The prompt
With Fastero connected to Claude, in claude.ai or Claude Code:
In Fastero, build a tracker of our team's Claude Code usage. A Python job should run
every morning at 06:30 UTC and read Anthropic's Claude Code Analytics API with the Secret
ANTHROPIC_ADMIN_KEY: one call per day, following its pages. Save one row per person and
terminal and one per person, terminal and model into the trackers schema of the database
in the Secret DATABASE_URL. Rewrite the last three days on each run, and fill in the last
90 on the first. Run it once and show me what it saved.

Then build a dashboard: last week's spend, cost per developer per active day, active
developers and commits as number cards with the change on the week before, spend per day,
spend by person and by model over 30 days, and a table of the team. Email it to me every
Monday at 9:00, and email me whenever anyone spends more than $50 in a day.
The job
It needs nothing beyond the standard library and psycopg2, which Fastero's Python environment has. We checked its parsing against the sample response in Anthropic's documentation and ran it against the live API. Our own Claude Code runs on a subscription, so that run came back with no rows, which is the trap described above:
"""Claude Code usage tracker.

Every morning: each person's Claude Code usage from Anthropic's Claude Code Analytics API
(the Secret ANTHROPIC_ADMIN_KEY, an Admin API key), saved into Postgres (the Secret
DATABASE_URL), one row per person, terminal and day and one per person, terminal, model and
day. The API answers for one day at a time and recent days can still change, so each run
rewrites the last three; the first run fills in the last 90.
"""
import datetime as dt
import json
import os
import urllib.parse
import urllib.request

import psycopg2
from psycopg2.extras import execute_values

API = "https://api.anthropic.com/v1/organizations/usage_report/claude_code"

TABLES = """
CREATE TABLE IF NOT EXISTS trackers.claude_code_daily (
  day              date NOT NULL,
  actor            text NOT NULL,
  terminal         text NOT NULL,
  sessions         int,
  lines_added      int,
  lines_removed    int,
  commits          int,
  pull_requests    int,
  edits_accepted   int,
  edits_rejected   int,
  PRIMARY KEY (day, actor, terminal)
);
CREATE TABLE IF NOT EXISTS trackers.claude_code_models (
  day              date NOT NULL,
  actor            text NOT NULL,
  terminal         text NOT NULL,
  model            text NOT NULL,
  input_tokens     bigint,
  output_tokens    bigint,
  cache_read       bigint,
  cache_creation   bigint,
  cost_usd         numeric,
  PRIMARY KEY (day, actor, terminal, model)
)"""


def fetch_day(day):
    """Every record for one UTC day, following the API's pages."""
    records, page = [], None
    while True:
        params = {"starting_at": day.isoformat(), "limit": 1000}
        if page:
            params["page"] = page
        req = urllib.request.Request(
            f"{API}?{urllib.parse.urlencode(params)}",
            headers={
                "anthropic-version": "2023-06-01",
                "x-api-key": os.environ["ANTHROPIC_ADMIN_KEY"],
                "User-Agent": "claude-code-usage-tracker/1.0",
            },
        )
        with urllib.request.urlopen(req, timeout=60) as response:
            body = json.load(response)
        records += body["data"]
        if not body.get("has_more"):
            return records
        page = body["next_page"]


def actor_of(record):
    actor = record["actor"]
    return actor.get("email_address") or actor.get("api_key_name") or "unknown"


def rows_for(day, records):
    daily, models = {}, {}
    for r in records:
        actor, terminal = actor_of(r), r.get("terminal_type") or "unknown"
        core, tools = r.get("core_metrics", {}), r.get("tool_actions", {})
        key = (day, actor, terminal)
        was = daily.get(key, (day, actor, terminal, 0, 0, 0, 0, 0, 0, 0))
        lines = core.get("lines_of_code", {})
        daily[key] = (
            day,
            actor,
            terminal,
            was[3] + core.get("num_sessions", 0),
            was[4] + lines.get("added", 0),
            was[5] + lines.get("removed", 0),
            was[6] + core.get("commits_by_claude_code", 0),
            was[7] + core.get("pull_requests_by_claude_code", 0),
            was[8] + sum(t.get("accepted", 0) for t in tools.values()),
            was[9] + sum(t.get("rejected", 0) for t in tools.values()),
        )
        for m in r.get("model_breakdown", []):
            mkey = (day, actor, terminal, m["model"])
            tokens = m.get("tokens", {})
            old = models.get(mkey, (day, actor, terminal, m["model"], 0, 0, 0, 0, 0))
            models[mkey] = (
                day,
                actor,
                terminal,
                m["model"],
                old[4] + tokens.get("input", 0),
                old[5] + tokens.get("output", 0),
                old[6] + tokens.get("cache_read", 0),
                old[7] + tokens.get("cache_creation", 0),
                old[8] + m.get("estimated_cost", {}).get("amount", 0) / 100,  # the API gives cents
            )
    return list(daily.values()), list(models.values())


def main():
    conn = psycopg2.connect(os.environ["DATABASE_URL"])
    try:
        with conn, conn.cursor() as cur:
            cur.execute(TABLES)
            cur.execute("SELECT count(*) FROM trackers.claude_code_daily")
            days_back = 3 if cur.fetchone()[0] else 90
            today = dt.datetime.now(dt.timezone.utc).date()
            saved = 0
            for n in range(days_back, -1, -1):
                day = today - dt.timedelta(days=n)
                daily, models = rows_for(day, fetch_day(day))
                cur.execute("DELETE FROM trackers.claude_code_daily WHERE day = %s", (day,))
                cur.execute("DELETE FROM trackers.claude_code_models WHERE day = %s", (day,))
                if daily:
                    execute_values(cur, "INSERT INTO trackers.claude_code_daily VALUES %s", daily)
                if models:
                    execute_values(cur, "INSERT INTO trackers.claude_code_models VALUES %s", models)
                saved += len(daily)
    finally:
        conn.close()
    print(f"Saved {saved} person-days from the last {days_back} days.")


if __name__ == "__main__":
    main()
The alert and the Monday email
The alert is one saved query, the highest spend by one person yesterday:
SELECT max(spend) AS "Highest daily spend"
FROM (
  SELECT actor, sum(cost_usd) AS spend
  FROM trackers.claude_code_models
  WHERE day = CURRENT_DATE - 1
  GROUP BY 1
) t
A Fastero alert runs it on a timetable and emails when the number crosses your line, then again when it comes back. In the sample data, that's the spike in the chart above: one person, about $145 in a day, mostly on Opus. An alert flags that the next morning instead of at the end of the month.
The Monday email carries the dashboard itself: its number cards, its charts as pictures, the first rows of each table, a short summary, a PDF of the whole thing, and a button that opens it in Fastero. How the scheduled email works.
On a Team plan
The Analytics API won't return your team's usage, but there are two ways to the same dashboard. Export the spend report CSV from your organisation's analytics settings, upload it to Fastero, and ask Claude to build the dashboard on it; the file becomes a table you can query. Or send OpenTelemetry from each developer's machine to a collector that writes to your database, which is more work but arrives in near real time and works on every plan.
FAQ
How do I check my Claude Code usage?
Run /usage inside Claude Code. It shows your plan's usage bars, what's using them, and your session's tokens and estimated cost. On a subscription you can also open claude.ai/settings/usage, and on the API the Claude Console's usage page has the authoritative bill.
How much does Claude Code cost per developer?
Anthropic says about $13 per developer per active day and $150–250 per developer per month across enterprise deployments, with 90% of users under $30 per active day. It varies widely with model choice, codebase size and how many instances people run.
What are the Claude Code usage limits?
On a subscription, a rolling five-hour window and a weekly window. On Team seats the allowance is shared with Claude chat and Cowork. Anthropic doesn't publish them as a fixed number of tokens. On the API there's no such allowance; you pay per token, up to any workspace spend limit you set.
Is there a Claude Code usage dashboard?
Yes, on Team and Enterprise at claude.ai/analytics/claude-code, and for API customers at platform.claude.com/claude-code. Individual Pro, Max and Ultra subscribers have /usage and tools such as ccusage, which read the local logs on one machine.
What is ccusage?
A free command-line tool that estimates Claude Code usage and cost from the log files on your machine, by day, week, month or session. Run it with npx ccusage@latest. It only sees the machine it runs on, and its costs are estimates that can differ from your bill.
Does the Claude Code Analytics API include Max or Team plans?
No. It covers usage authenticated against a Claude Console organisation. Pro, Max, Team and Enterprise usage belongs to the claude.ai organisation and isn't returned. Enterprise has its own Analytics API; Team has a CSV export and OpenTelemetry.
Can I see Claude Code usage per person?
On the API, the Console dashboard lists spend and accepted lines per member, and the Analytics API returns them by day. On Team and Enterprise, the spend report CSV lists tokens and estimated spend per user and model, and the leaderboard ranks contributions. OpenTelemetry gives per-user tokens and cost on any plan.
Sources
Read on 31 October 2026:
- Anthropic, Claude Code docs — Manage costs effectively, Track team usage with analytics, Monitoring with OpenTelemetry
- Anthropic, Claude Platform docs — Claude Code Analytics API
- ccusage — Guide, JSON output
- Fastero — Claude API pricing, Claude connectors, Automate reports with Claude
Try Fastero free — see your team's Claude Code usage in one dashboard, with a Monday email and an alert on a runaway day. No credit card required.