 Fastero Dev Team
It's easier to choose a chart from your question than from a list of shapes. Below are 16 chart types grouped by question, each shown on invented sales data: twelve from one Fastero dashboard and four we drew in matplotlib.
The short answer: pick the chart by the question. Compare categories with a bar chart, horizontal when names are long. Show change over time with a line chart. Show parts of a whole with a stacked bar, or a pie with five slices or fewer. Show how values are spread with a histogram, or a box plot to compare groups. Show how two numbers relate with a scatter plot, or a bubble chart for three. Show a pattern across two categories, such as month by product, with a heatmap. When one number is the answer, show the number; when people need exact values, use a table.
Fastero
Connect your database. Ask questions. Get dashboards.
Postgres, BigQuery, Snowflake, and 10+ sources — live-connected, AI-powered, no dashboard builder learning curve.
Try free →Which chart for which question
| Your question | Chart | Example question it answers |
|---|---|---|
| How do categories compare? | Bar chart | Which category brings in the most revenue? |
| The same, with long names or many items | Horizontal bar chart | Which country sells the most? |
| How does a total split, and how does the split change? | Stacked bar chart | Which channel grew each quarter? |
| What took us from one total to the next? | Waterfall chart | Which categories added or lost revenue this year? |
| How has it changed over time? | Line chart | Is monthly revenue rising? |
| How have the total and its mix changed? | Stacked area chart | Is online taking a bigger share? |
| Is this period above or below normal? | Combo chart | Is this month above its three-month average? |
| What share is each part? | Pie chart | What share of orders comes from each channel? |
| What share, with many parts or two levels? | Treemap | Which products make up most of the revenue? |
| How are the values spread? | Histogram | What does a typical order look like? |
| How do spreads compare between groups? | Box plot | Which category has the most variable orders? |
| Are two numbers related? | Scatter plot | Do busier days bring in more revenue? |
| Are three numbers related? | Bubble chart | Which customers buy a lot, and often? |
| Where are the highs and lows across two dimensions? | Heatmap | Which months are busy for which category? |
| What is the one number? | Number (KPI tile) | What was revenue last month? |
| What are the exact values? | Table | What are the top products, with their numbers? |
Charts that compare amounts
Bar chart
One bar per category, its length the value. Use it to compare a handful of categories, sorted largest first unless they have their own order, such as sizes. Don't use it for a long time series, and start the axis at zero, or differences look bigger than they are.
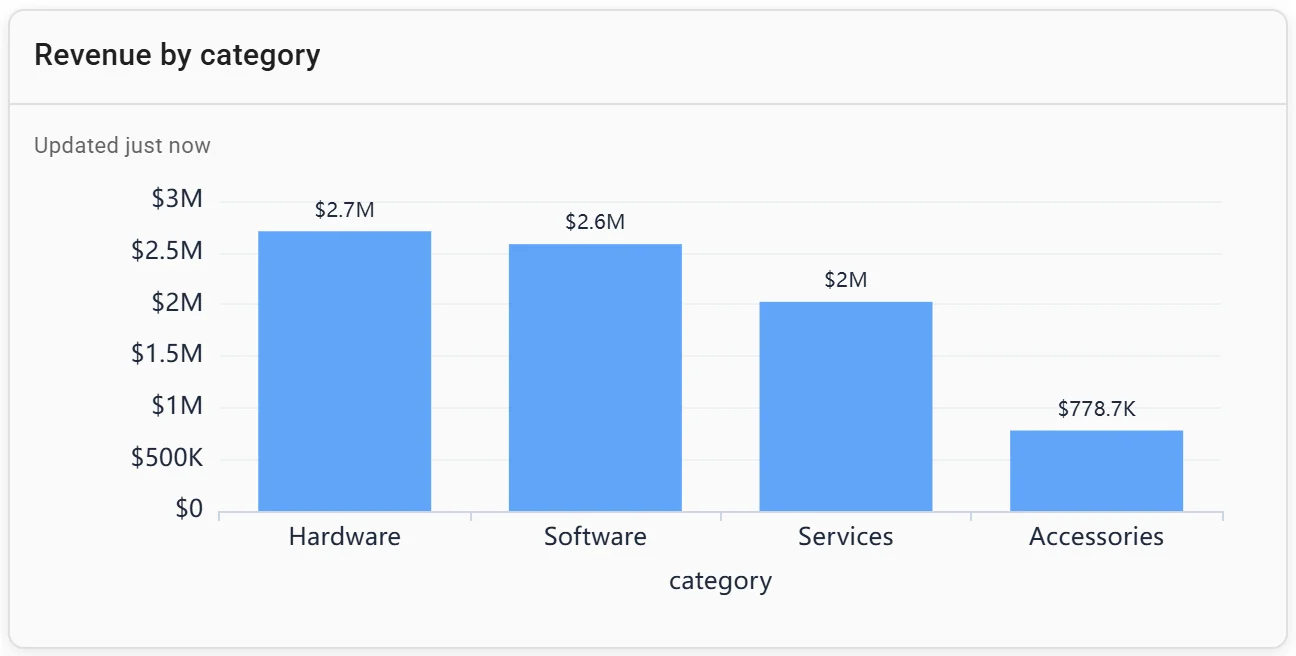
A bar chart: revenue by category. Invented data.
Horizontal bar chart
A bar chart turned sideways, so long names fit. Use it for ranked lists and more than six or seven items. Don't use it for time, which readers expect to run left to right.
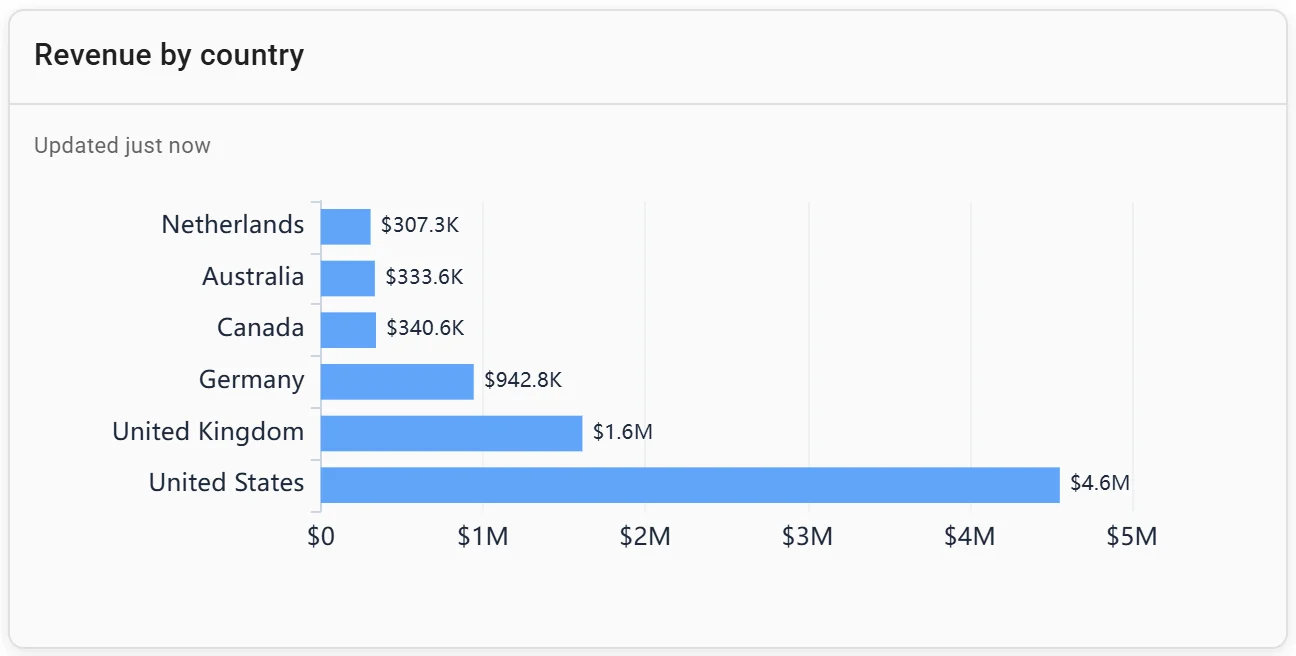
A horizontal bar chart: revenue by country. Invented data.
Stacked bar chart
Each bar is a total split into segments, such as quarterly revenue by channel. Use it when the total and its make-up both matter. Don't use it to compare the middle segments, which have no shared baseline; grouped bars do that better.
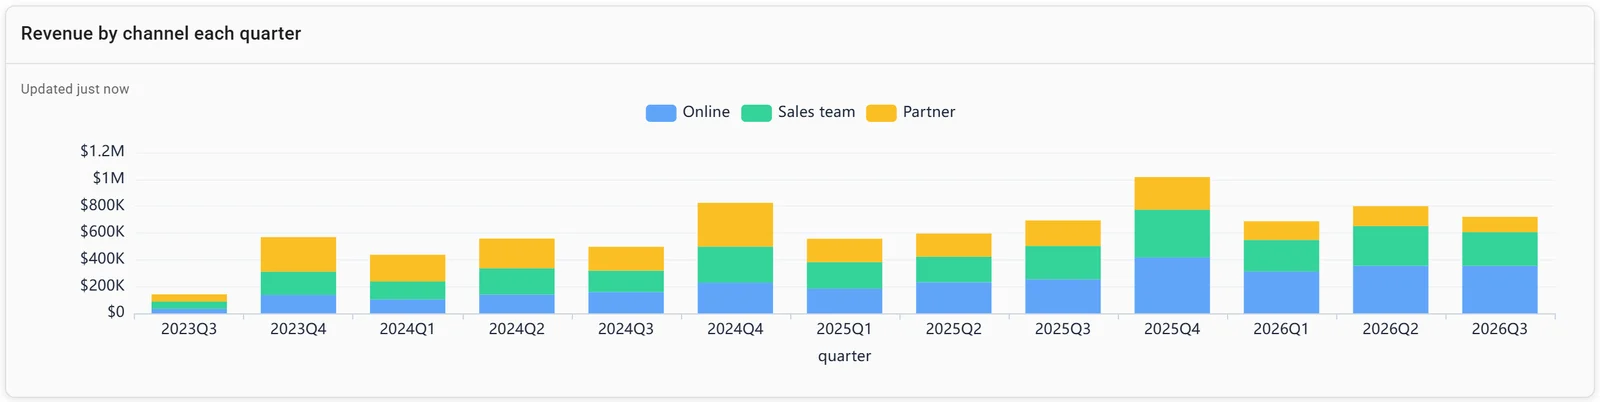
A stacked bar chart: revenue by channel each quarter. Invented data.
Waterfall chart
A start total, the ups and downs that changed it, and the end total. Use it to explain a change, such as this year's revenue against last year's, by category. Don't use it when the steps don't add up to the difference. Our revenue waterfall in SQL guide has the query.
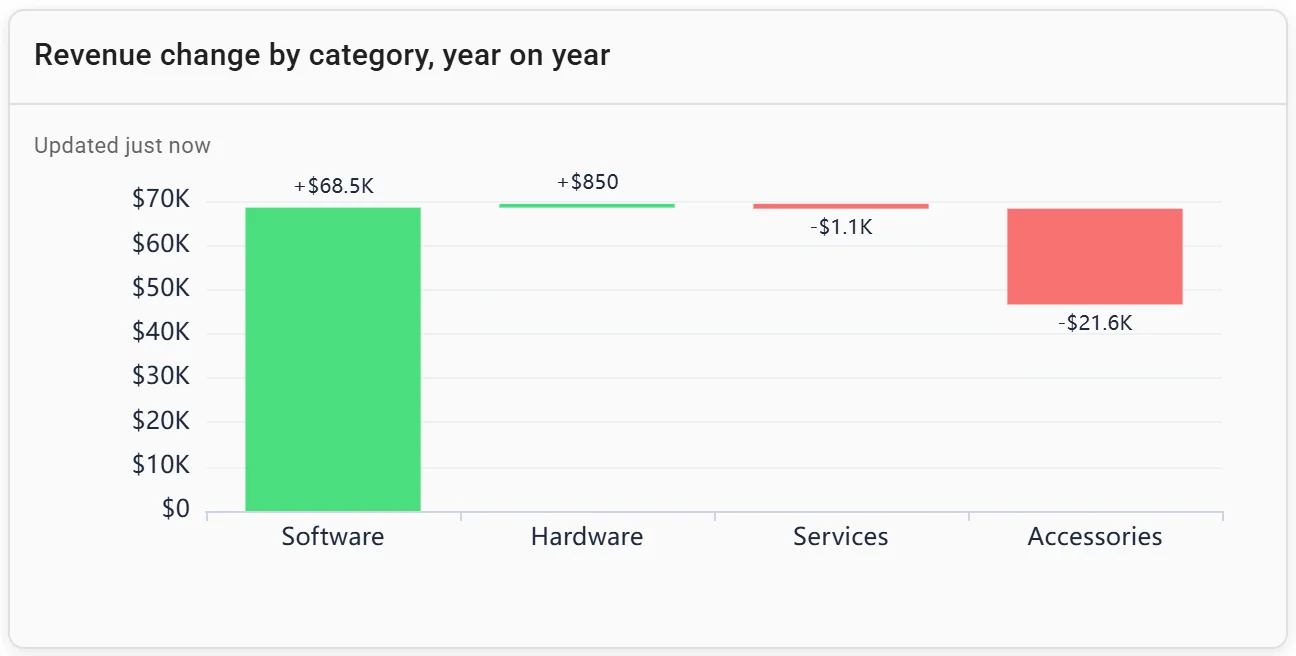
A waterfall chart: revenue change by category, year on year. Invented data.
Charts that show change over time
Line chart
Points in time joined by a line. Use it for trends over many periods. Don't use it for categories with no order: the line implies a path between them. Its axis may start above zero when the change is the point.
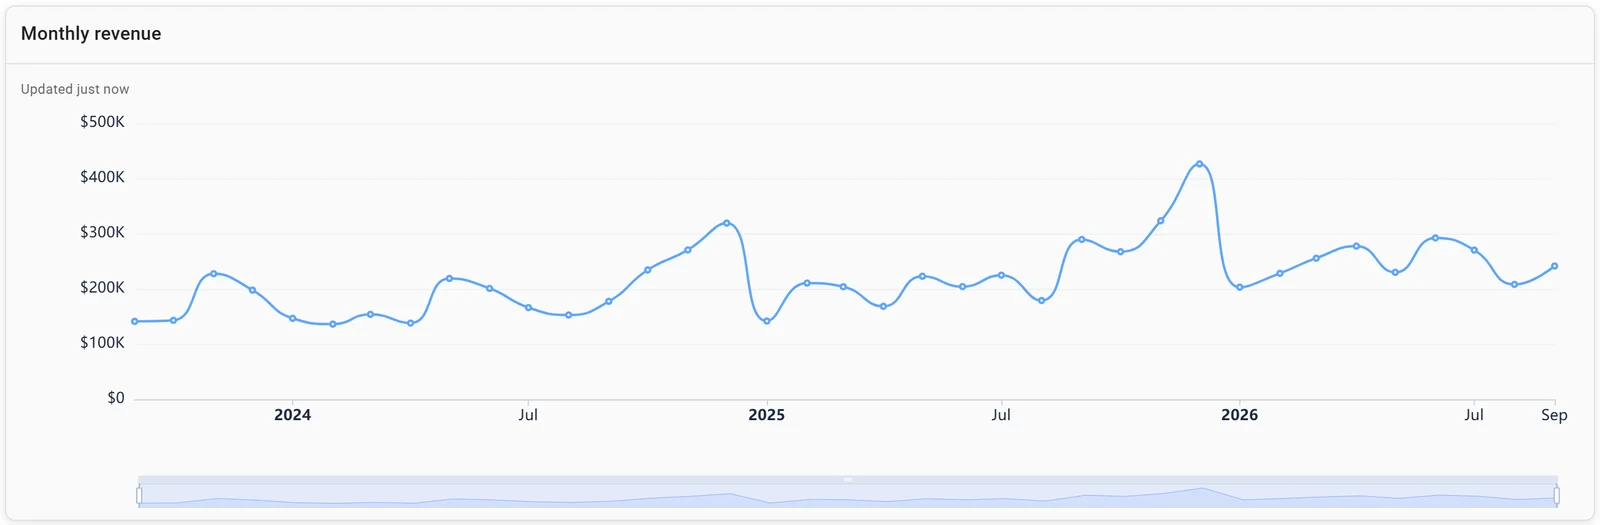
A time series: monthly revenue in Fastero. Invented data.
Stacked area chart
A line chart with each series filled and stacked, so the top edge is the total. Ours shows monthly revenue by channel: over 24 months, Online brought in 48%, the sales team 31% and partners 21%. Use it for a total made of two to four parts. Don't use it to compare the upper layers, which have no flat baseline.
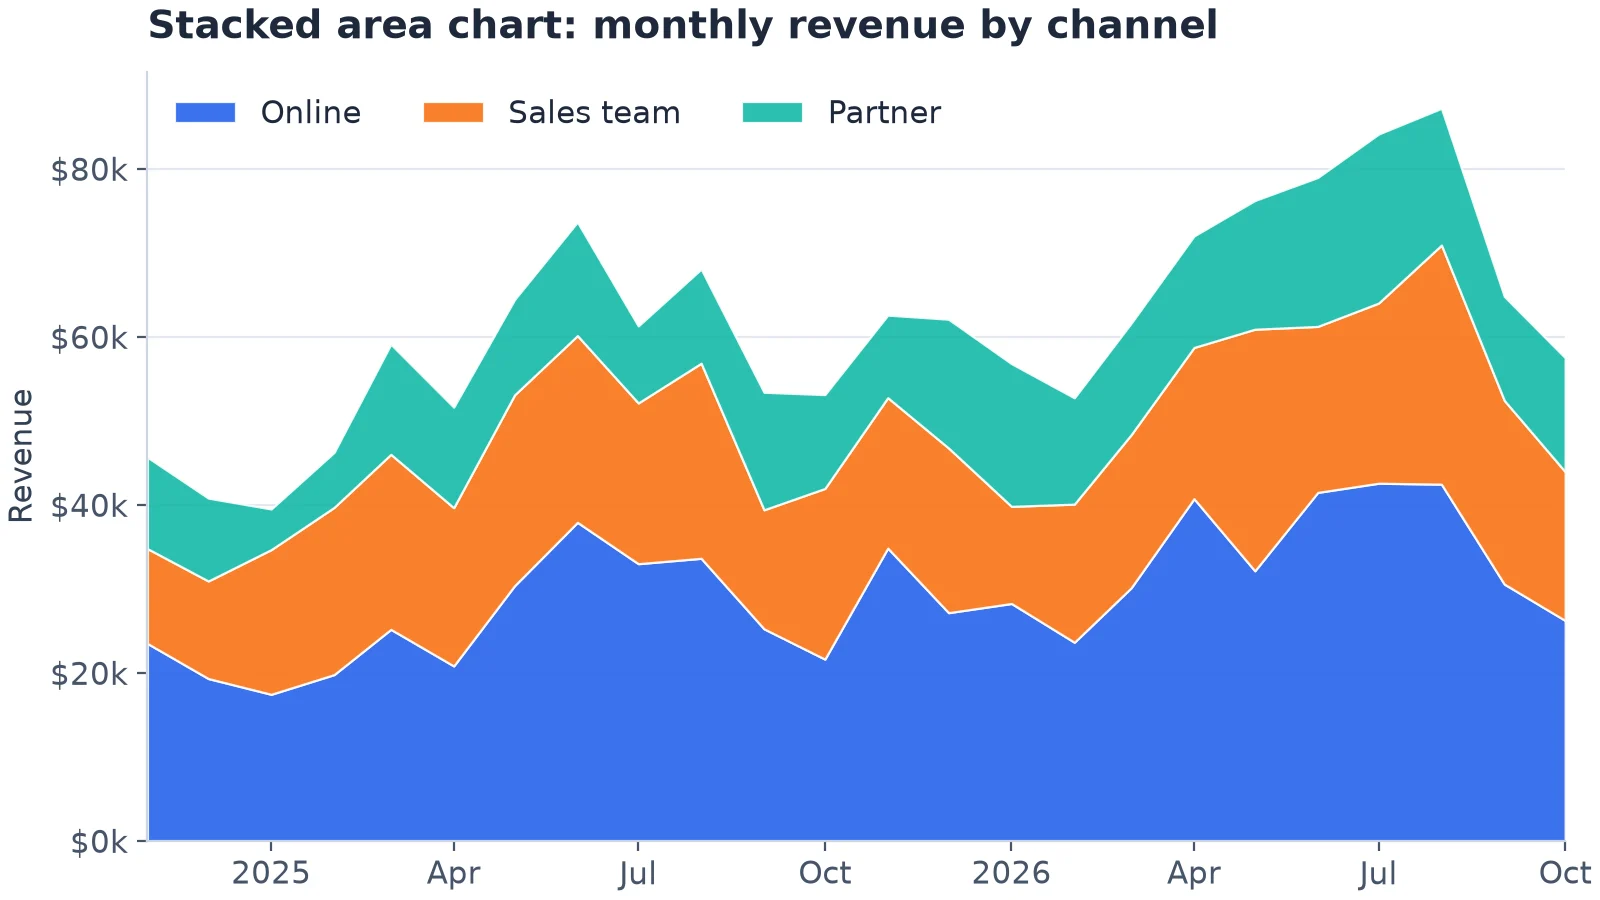
A stacked area chart: the top edge is the total, the layers are the mix. Drawn in matplotlib from 4,734 invented orders.
Combo chart
Bars and a line on one set of axes, such as monthly revenue against its three-month average. Use it to set each period against a benchmark: an average, a target, last year. Don't use it for two units on two y-axes; readers mix up the scales, and two small charts are clearer, as in our matplotlib examples.
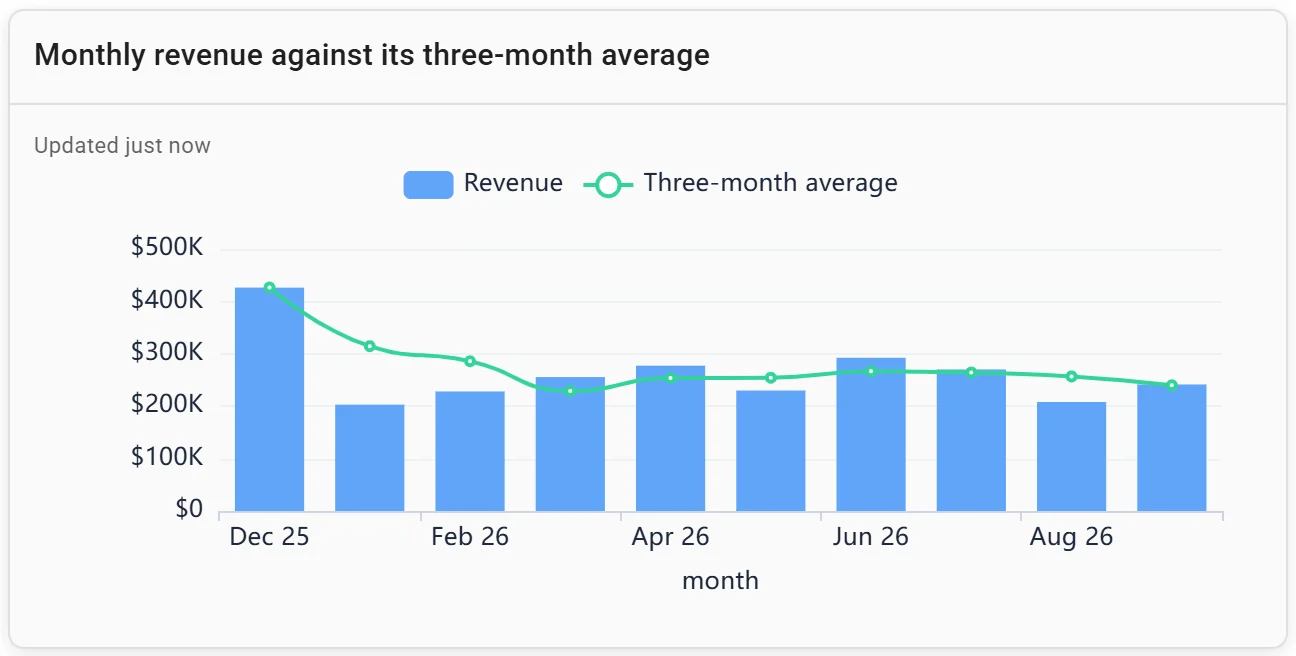
A combo chart: monthly revenue against its three-month average. Invented data.
Charts that show parts of a whole
Pie chart
A circle of slices that add up to 100%. Datawrapper's rule of thumb: "Pie charts work best if you only have a few values – five max. If you have more than five shares, consider a stacked column or stacked bar chart." The parts can't overlap, since "a pie chart always represents a whole, i.e. 100%", so a survey question that allows several answers can't be a pie. Don't use two pies side by side to compare periods.
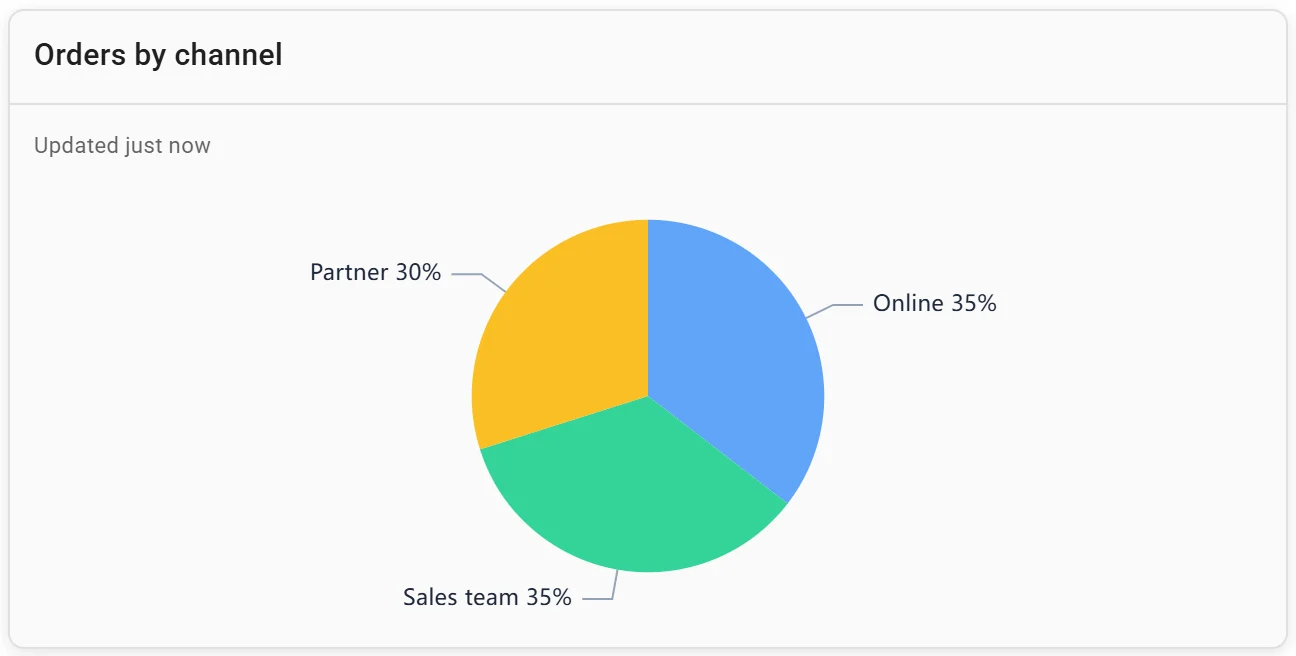
A pie chart: orders by channel. Invented data.
Treemap
Nested rectangles sized by value, such as revenue by product within each category. Use it when there are too many parts for a pie, or two levels. Don't use it for precise comparison: areas are harder to judge than lengths, and small rectangles lose their labels.
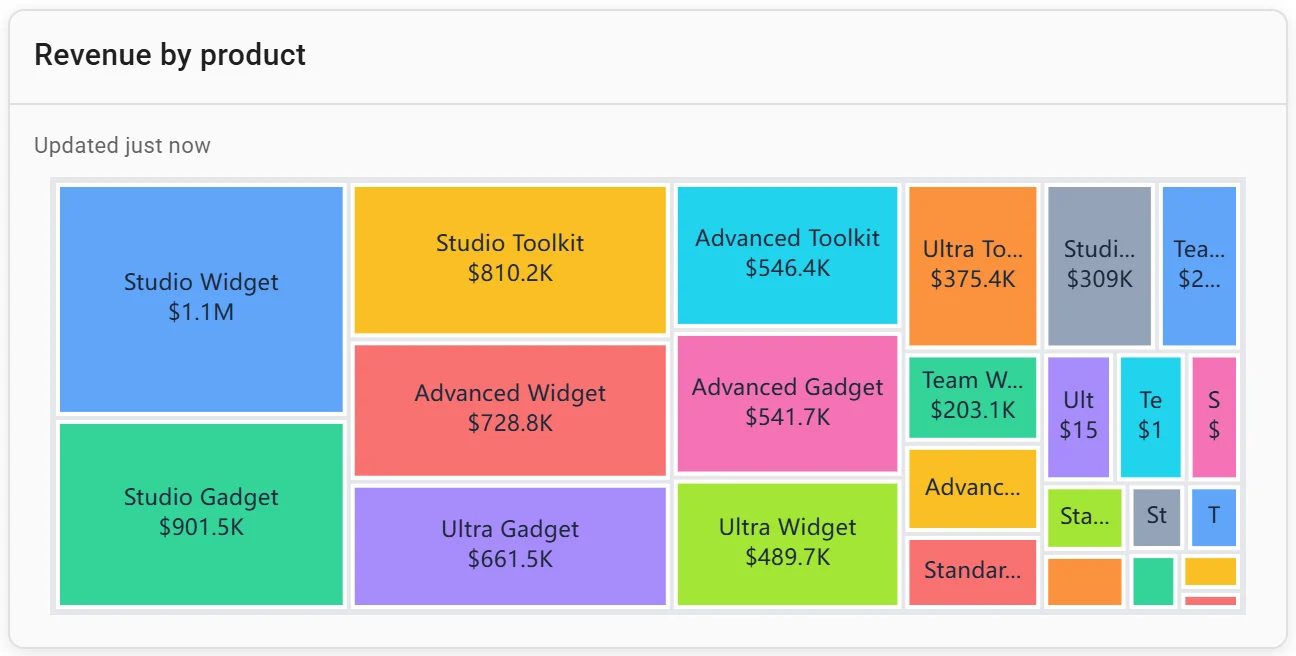
A treemap: revenue by product. Invented data.
Charts that show how values are spread
Histogram
A number cut into equal ranges (bins), with a bar counting the values in each. Ours counts 4,734 orders in $100 bins: 1,179 under $100, 1,294 from $100 to $200, and a thin tail past $1,500. Use it before quoting an average. Don't sort the bars, and try more than one bin width: bar chart vs histogram shows why.
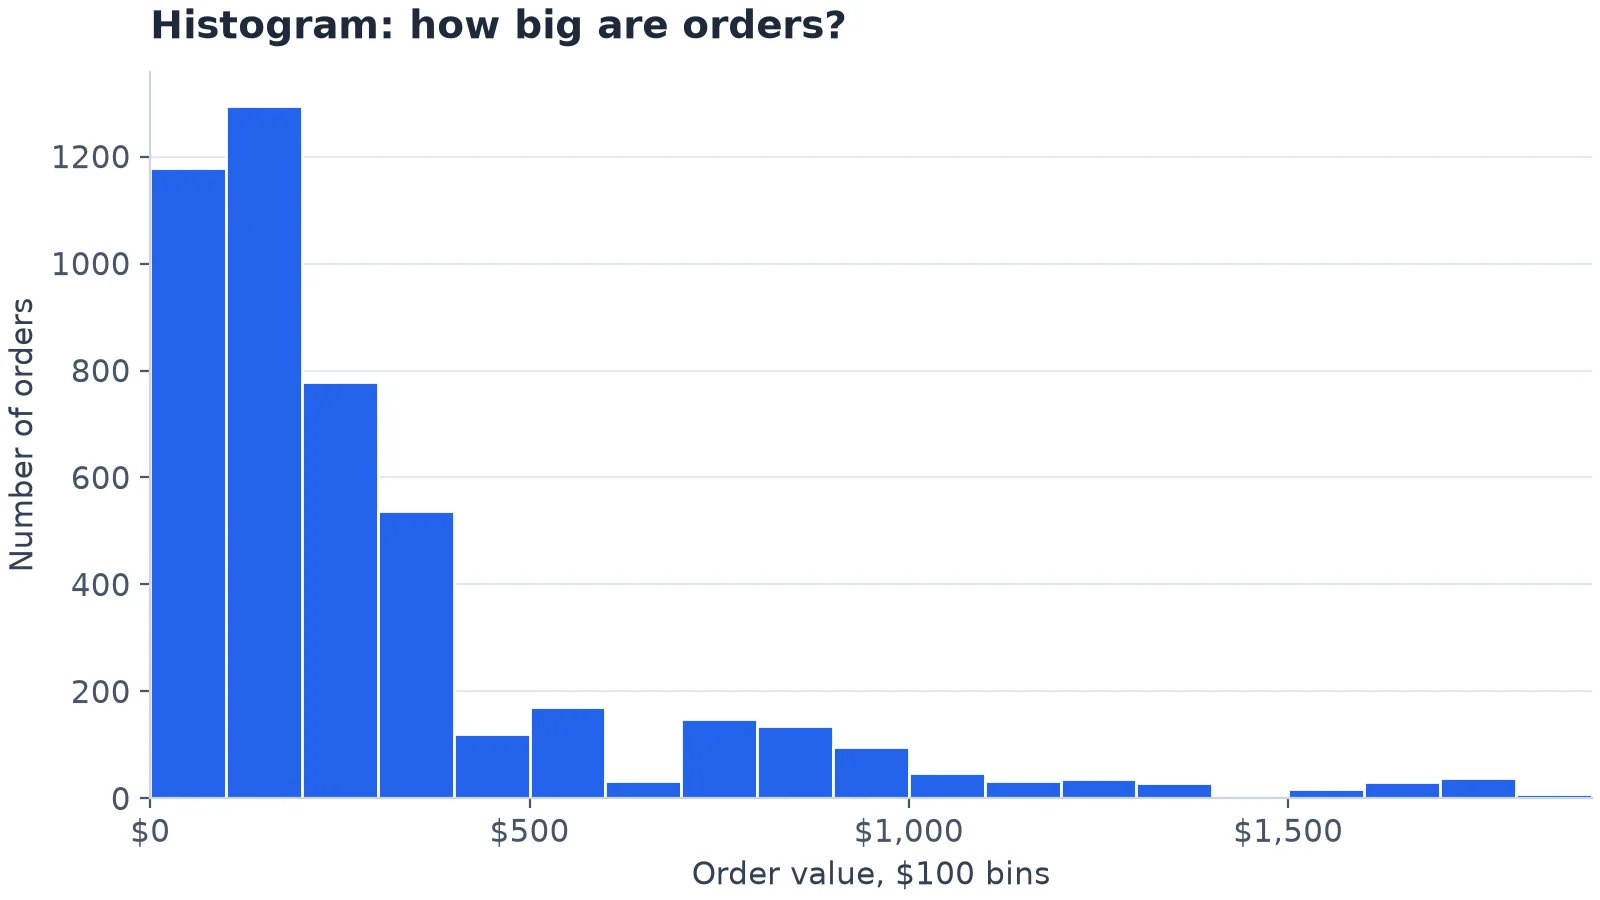
A histogram of order values in $100 bins. Drawn in matplotlib from invented data.
Box plot
One box per group. The box runs from the first to the third quartile, the line inside is the median, and in matplotlib's default the whiskers "extend from the box to the farthest data point lying within 1.5x the inter-quartile range (IQR) from the box". Dots beyond them are outliers. In ours, Services has the highest median order ($346) and Supplies the lowest ($107). Use it to compare spreads across groups. Don't use it for readers new to box plots, or where a group may have two peaks, which a box hides.
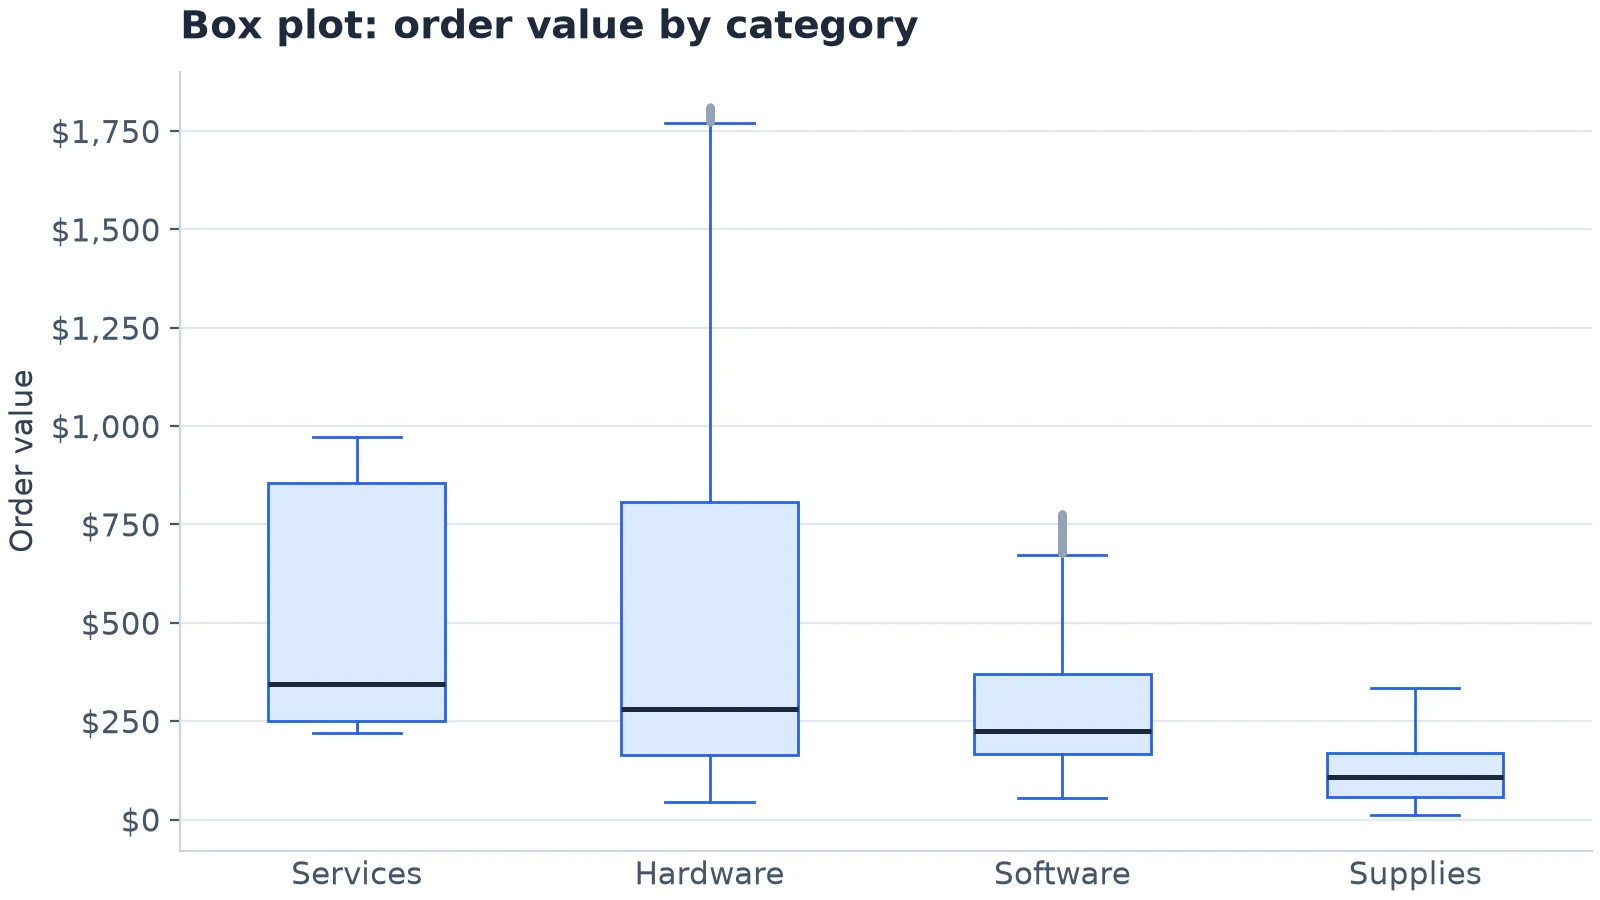
A box plot: medians, quartiles and outliers for four categories. Drawn in matplotlib from invented data.
Connect any database. Ask in plain English.
Start free →Charts that show relationships
Scatter plot
One dot per item, placed by two numbers. Ours has a dot for each of 729 days, by orders and revenue that day. Busier days bring in more (a correlation of 0.73), but the 42 days with 10 orders brought in anything from $1,437 to $7,272. (Dots are nudged sideways so days with the same count don't hide each other.) Use it to see whether two numbers move together and to find outliers. Don't use it when one axis is time, or with so many points that they merge.
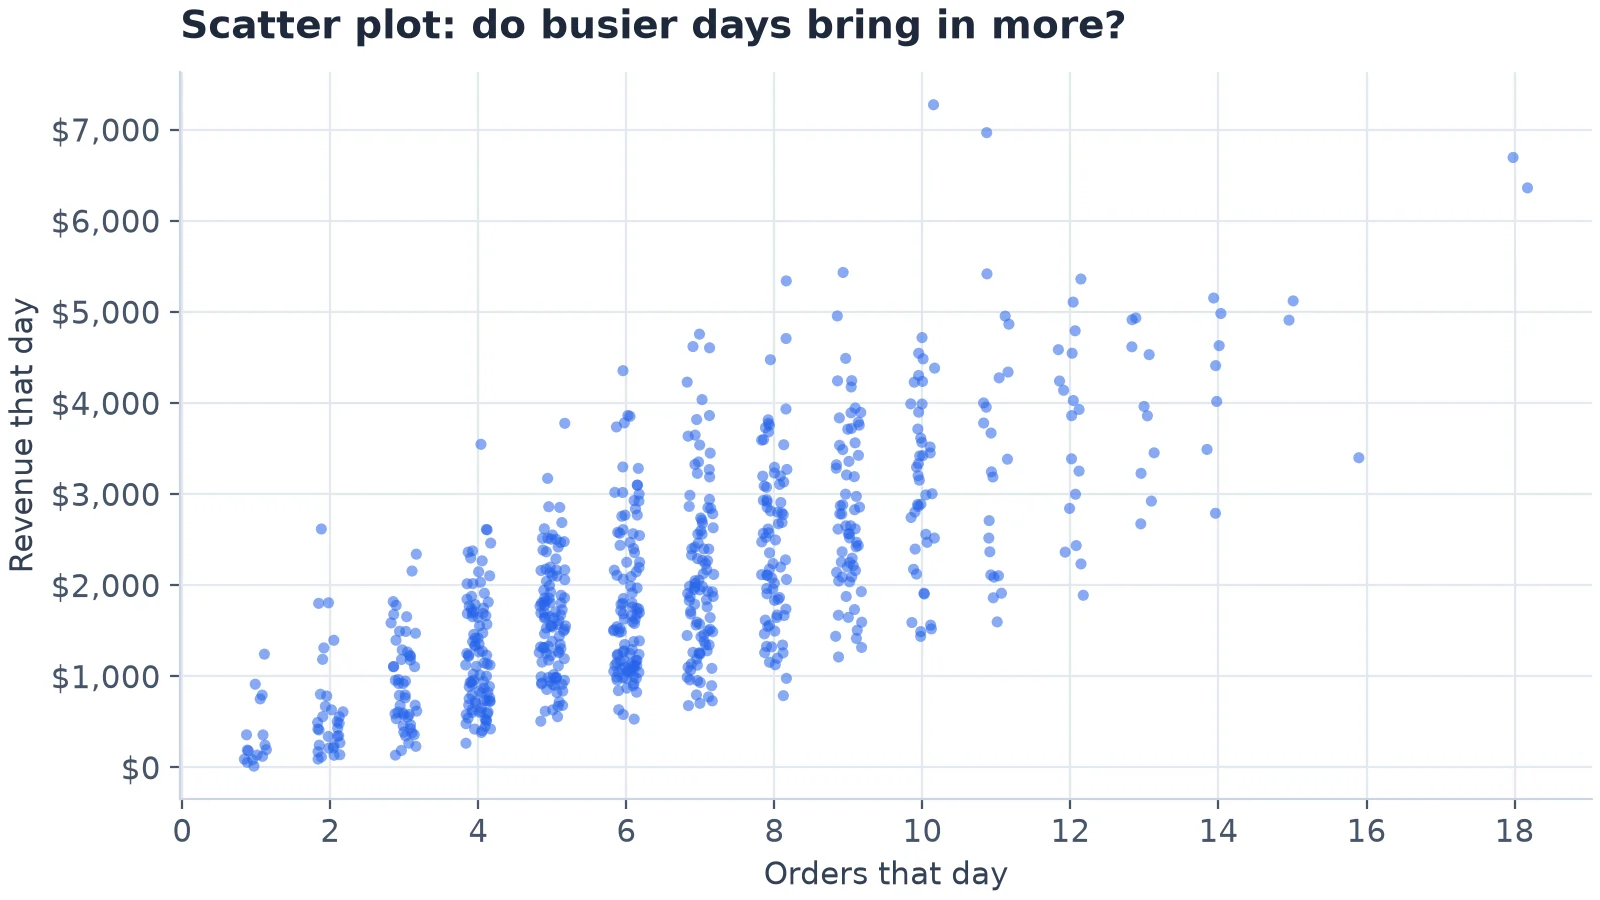
A scatter plot: one dot per day. Drawn in matplotlib from invented data.
Bubble chart
A scatter plot whose dot size is a third number. Use it when three measures describe each item. Don't use it when the sizes must be read precisely, or when the bubbles overlap.
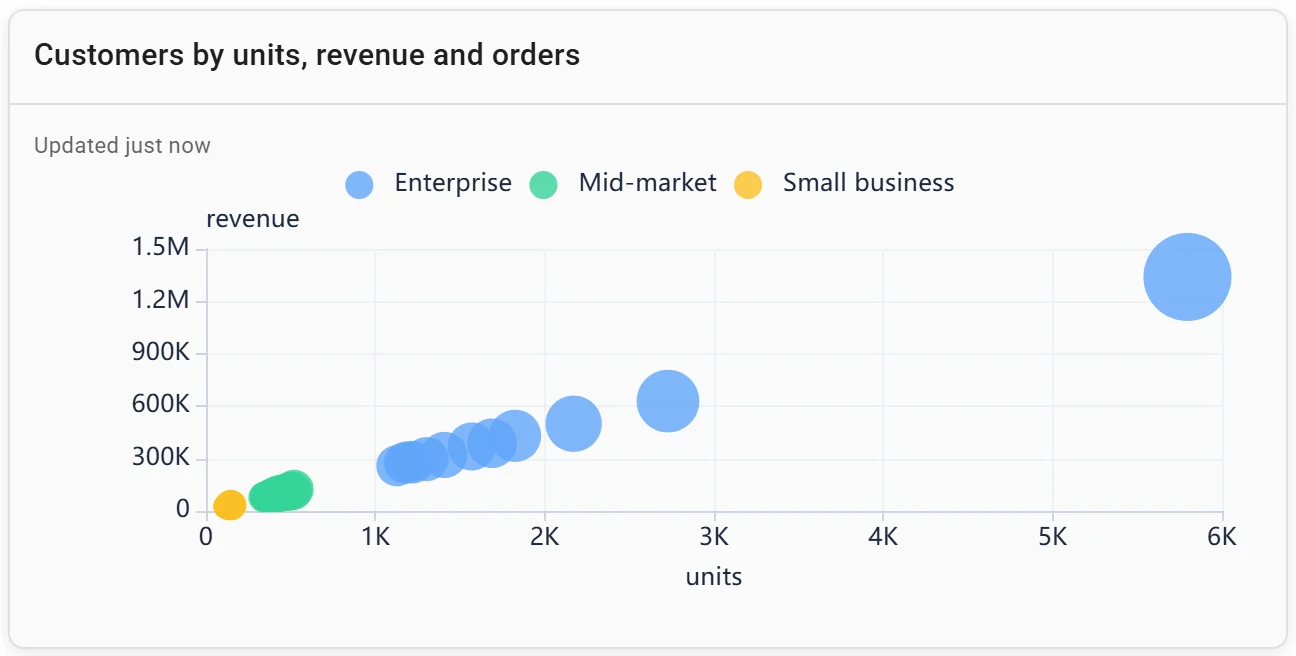
A bubble chart: customers by units, revenue and orders. Invented data.
Heatmaps: patterns across two dimensions
A grid with one cell per pair of categories, coloured by value. Four common heatmaps:
- Time by category: orders by month and category, like ours.
- Weekday by hour: when orders come in, as in matplotlib example 10.
- Cohort retention: the share of each signup month still active months later, as in our cohort retention dashboard.
- Correlation matrix: how strongly each pair of measures moves together, as in Plotly example 6.
Use one colour, light to dark, for amounts, and two colours either side of a midpoint for above and below it. Don't use a heatmap when readers need exact numbers, unless you print them in the cells.
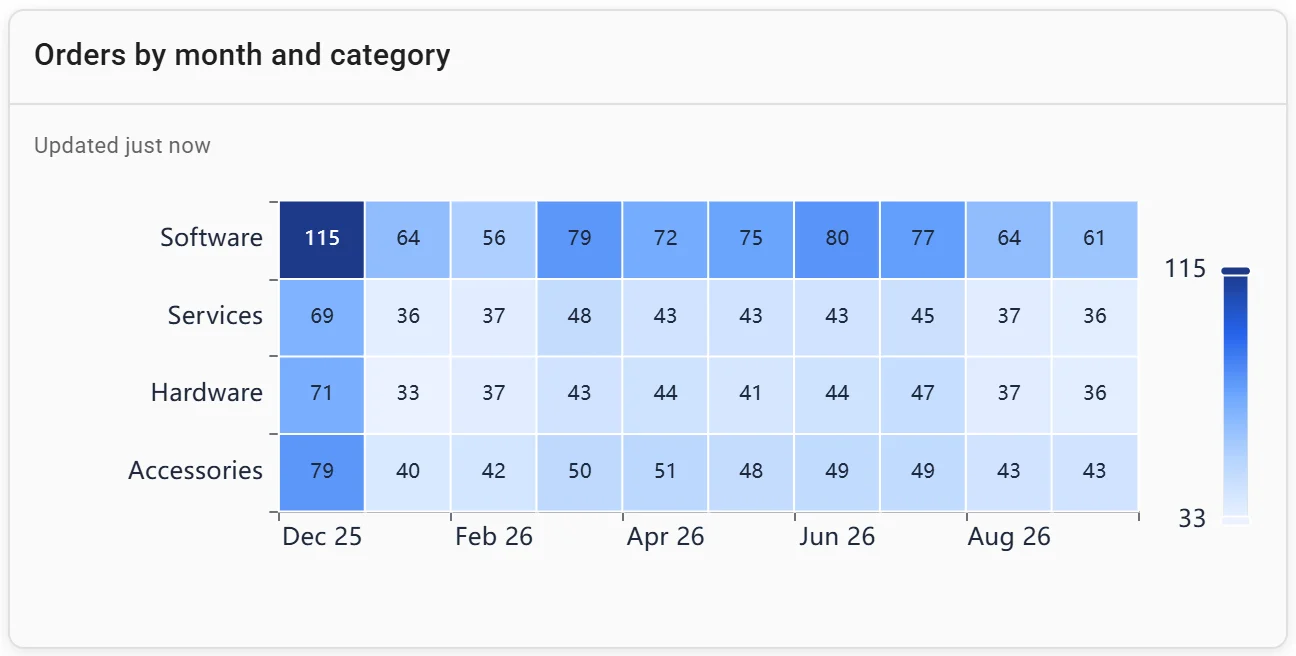
A heatmap: orders by month and category. Invented data.
When the answer is a number or a list
Number (KPI tile)
One figure in large type, such as revenue in the latest month. Use it for the three to five numbers people check first, each against a previous period. Don't use it alone where the trend matters; put a line chart under it. See our KPI dashboard examples.

Headline numbers on a Fastero dashboard. Invented data.
Table
Rows and columns of exact values, such as the top products with their revenue. Use it when people will look up or copy numbers. Don't use it when the point is a pattern.
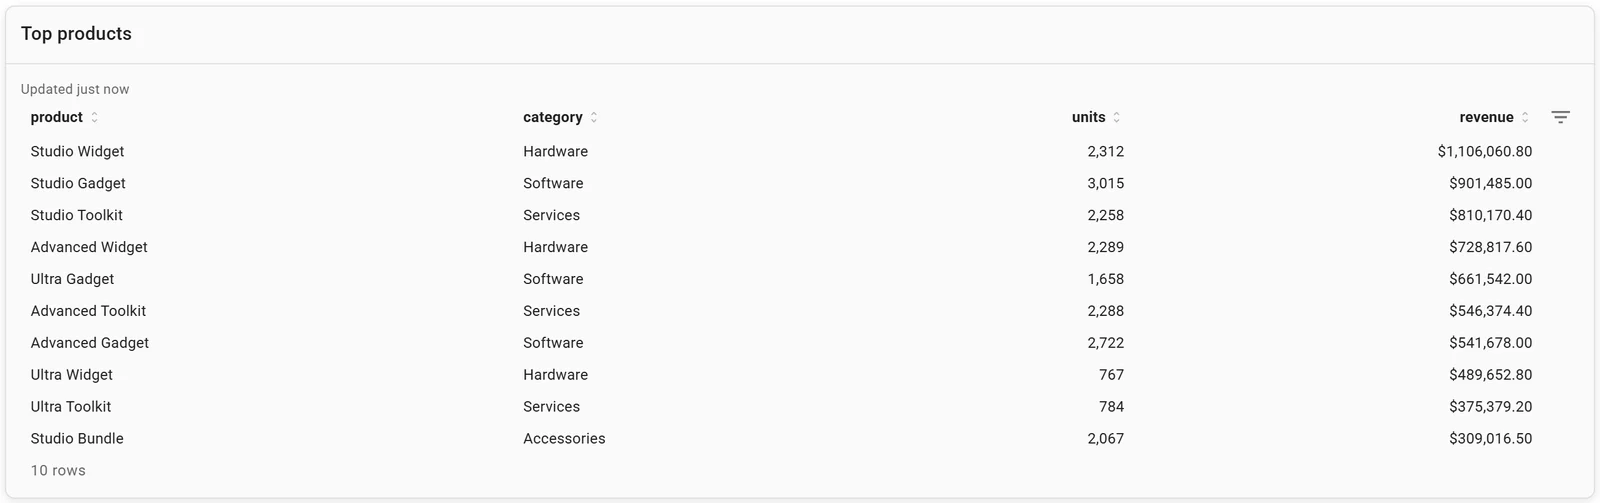
A table: top products. Invented data.
Charts that stay current
The twelve dashboard charts above come from one Fastero dashboard. Fastero is an AI and data platform where people and AI agents work together on a team's data:
- A chart on a connected database or warehouse, such as Postgres, Snowflake or BigQuery, is a saved SQL query. Uploaded CSV and Excel files can be charted too.
- Ask in plain English and the AI agent writes the SQL and draws the chart; the query stays with it for checking.
- Refresh: a dashboard refreshes on a timer (1, 5, 15 or 60 minutes) or, for Postgres and BigQuery data only, when the data changes. A chart from an uploaded file is a snapshot until you upload the file again.
- Sharing: colleagues sign in and viewers are free; a public link can be turned off; a scheduled email sends the charts with a PDF.
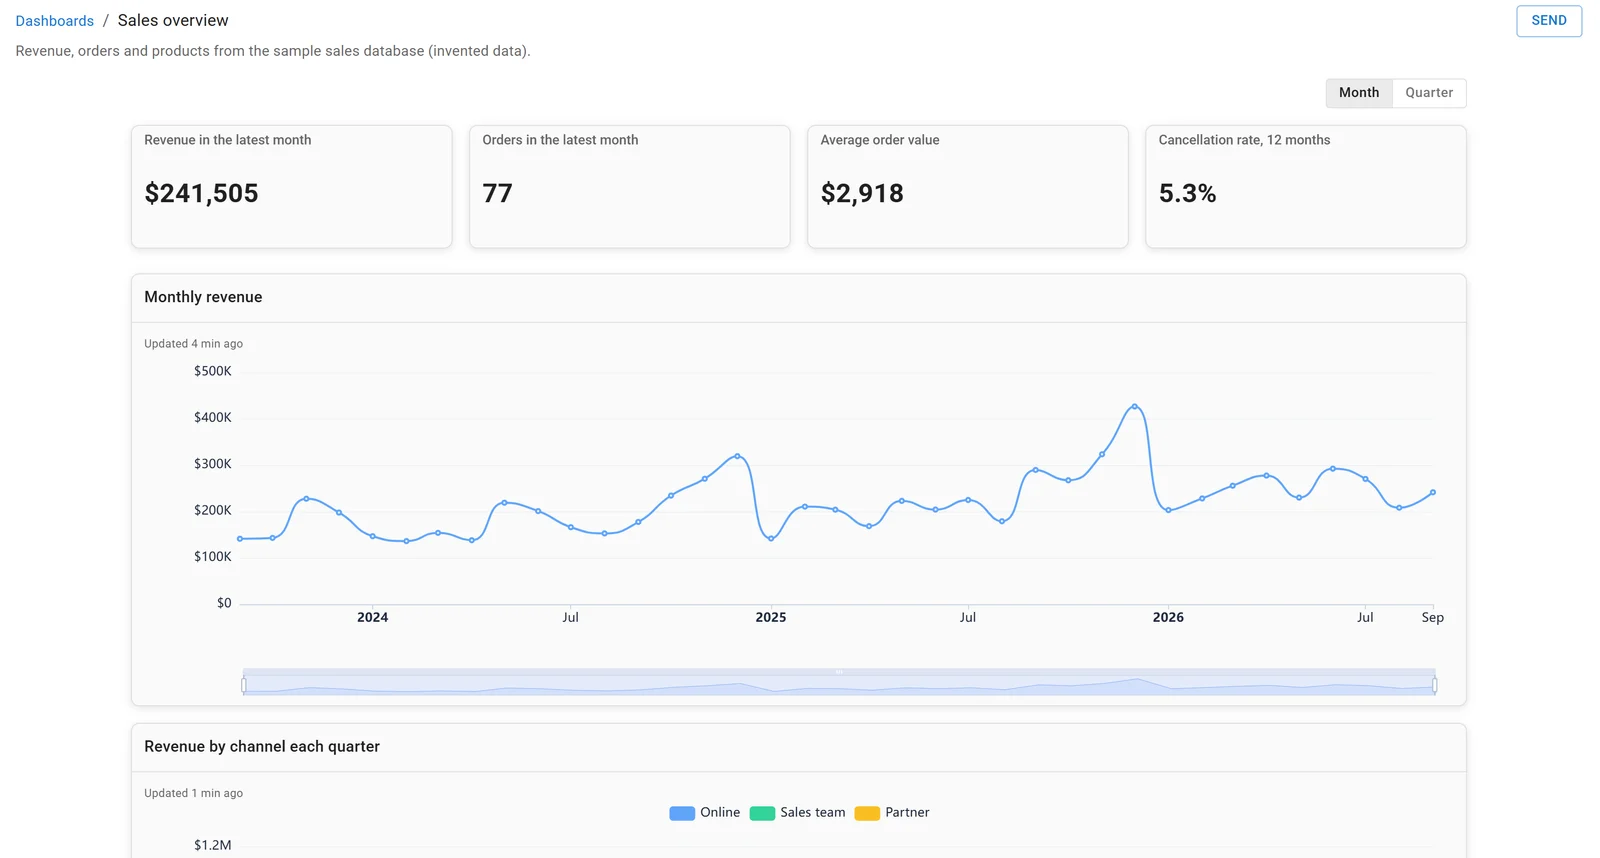
A dashboard in Fastero, built on the sample sales database. Invented data.
FAQ
What are the main types of charts?
Bar, line, pie, scatter and histogram charts. Between them they compare categories, show change over time, split a whole, relate two numbers and show how values are spread.
How many types of charts are there?
There's no fixed number; it depends on the tool. Google's help lists 18 chart types for Sheets, Datawrapper offers "over 20 different chart types, three map types", RAWGraphs has "Almost 30 visual models", Canva lists "30+ chart options" and Flourish "50+ chart types".
When should you not use a pie chart?
When there are more than about five parts, when the parts don't add up to one whole, or when you want to compare periods. A bar chart or a stacked bar is clearer in each case.
What is a heatmap used for?
To show where the highs and lows are across two dimensions at once, such as orders by month and category, activity by weekday and hour, or retention by signup month.
What chart shows change over time?
A line chart, for one or a few series over many periods. A stacked area chart shows the total and its mix; a combo chart sets each period against an average or target.
Sources
Read on 18 November 2026:
- Datawrapper: What to consider when creating a pie chart, How to create a pie chart, Pricing and FAQ (chart types)
- Matplotlib: Axes.boxplot (the whisker rule)
- Chart type counts: Google Sheets chart types, RAWGraphs, Canva Charts, Flourish pricing and FAQ
- Data: the four matplotlib charts use
sample-sales.csv, 4,734 invented orders, drawn with matplotlib 3.11.2, NumPy 2.5.5 and pandas 3.1.1 on Python 3.14.3.