 Fastero Dev Team
Almost every chart maker is free to start. They differ in what happens after the first chart: whether it updates when your numbers change, who can see it, and what you can take away. We checked nine on their own pages and built a chart with the open-source one, RAWGraphs.
The short answer: for data in a spreadsheet, Google Sheets and Excel for the web are free with an account, and the chart changes when the cells do. To publish a chart on a website, Datawrapper's free plan has unlimited charts, PNG downloads and live updates from a CSV link, with a "Created with Datawrapper" credit; Flourish's free charts are public, and its image export and live data are paid. RAWGraphs is free, open source and runs in your browser. Canva has 30+ chart types, but linking Google Sheets isn't on Canva Free. ChatGPT and Claude chart an uploaded file on their free plans, as a snapshot. For a chart on a database that stays current, use a tool that reruns the query, such as Fastero.
Fastero
Connect your database. Ask questions. Get dashboards.
Postgres, BigQuery, Snowflake, and 10+ sources — live-connected, AI-powered, no dashboard builder learning curve.
Try free →Free chart makers compared
Checked on each vendor's own pages on 18 November 2026.
| Tool | What's free | Limits worth knowing | Updates when the data changes | Sharing | Export |
|---|---|---|---|---|---|
| Google Sheets | All of it, with a Google account | 20 million cells or 100 MB a spreadsheet; 15 GB of storage, shared with Gmail | Yes, inside the sheet; a published chart can republish itself | Share the sheet, or publish the chart as a link or embed | SVG, PNG or PDF |
| Excel for the web | Excel in the browser, with a Microsoft account | 5 GB of OneDrive storage | Yes, inside the workbook | Share the workbook from OneDrive | No picture export; Microsoft says take a screenshot |
| Datawrapper | Unlimited charts, maps and tables | Credit line on every chart; PDF and SVG need Pro ($21 per user a month) | Yes, from a CSV link or Google Sheet, on every plan, for 30 days per publish | Publish and embed; no limit on views | PNG |
| Flourish | Unlimited projects, all templates | Published projects are public, with attribution | Live data is on Publisher, a sales-led plan | Public link and embed | Image and SVG need Presenter, via Canva Business |
| RAWGraphs | All of it: open source, Apache-2.0 | Nothing is hosted; data stays in the browser | No: paste the new data in | Send the exported file | Vector or raster image, plus a project file |
| Canva | 30+ chart types in any design | 1,000 rows and 100 columns; Google Sheets and other data apps need Business | Only from a Canva Sheet in the same design | As part of a design | Image or PDF; transparent backgrounds are paid |
| ChatGPT | Data analysis, "Limited" | Uploads "Limited"; interactive charts need Plus | No: a chart from an upload is a snapshot | Send the downloaded file | The generated image or file |
| Claude | Code execution, file creation, artifacts | 30 MB per file | No: a snapshot of the file | A chat artifact can be published to a public link | PNG image files |
| Fastero | Free plan, $0, no end date | 3 exports a month, 500 MB, $20 of AI to start | Yes: on a timer, or for Postgres and BigQuery only, when the data changes | Sign-in for colleagues (viewers free), public link, scheduled email | PDF by email; Excel downloads count as exports |
Google Sheets and Excel for the web
Both keep the chart inside the file, so editing a cell redraws it.
Google lists 18 chart types for Google Sheets, including histograms, box plots and waterfalls; our guide to types of charts says which to pick. A chart's menu downloads it ("You can download charts in SVG, PNG, or PDF format") or publishes it as a link or embed, with an option to "Automatically republish when changes are made". Google warns that "Charts and canvases published to the web show the data used to create them". And Sheets charts only what's in the sheet: it won't query your database.
Excel for the web comes with "free access to Word, Excel, and PowerPoint using Microsoft 365 for the web" and "5 GB of cloud storage". Microsoft's "Save a chart as a picture" article covers desktop Excel only, and its advice for moving a web chart into a slide is to "take a screenshot of the chart and save the picture."
Datawrapper and Flourish: charts to publish
Datawrapper has the more generous free plan: it lets you "create, publish, embed, and export Datawrapper visualizations as PNGs without limits", and you can "Create a chart or a map now – no need to sign up". Free charts keep the "Created with Datawrapper" credit. Live updates are free too: link a chart to a CSV on the web, or a Google Sheet with "Link external dataset", and it refreshes "every minute in the first 24h, every hour in the next 29 days". After that, "your visualization won't update automatically anymore" until you republish.
Flourish has "50+ chart types". Free gives "Unlimited projects" and "Public publishing and embedding, with attribution", so anything you publish is public. Image and SVG export need Presenter, which is "Available with a Canva Business or Enterprise plan", and "Live data updates via Google Sheets or CSV" need Publisher, which you buy by contacting sales.
Connect any database. Ask in plain English.
Start free →RAWGraphs: we built a chart with it
RAWGraphs is "A free and open source tool for data visualization" with "Almost 30 visual models", Sankey, alluvial and beeswarm charts among them. "The data you insert will be processed only by your web browser", and its README calls it "a missing link between spreadsheet applications" and "vector graphics editors": you make the chart here and finish it in Illustrator or Inkscape.
There's no browser on our test machine to click through the app, so we ran the libraries it's built on: rawgraphs-core "was born to simplify and modularize development of the RawGraphs web app". On 18 November 2026, in Node 24.12 with rawgraphs-core 1.0.0 and rawgraphs-charts 1.1.0, we fed it the 4,734-row invented sample CSV (trimmed; the full script also writes a PNG):
const { chart, parseDataset } = require('@rawgraphs/rawgraphs-core')
const { barchart } = require('@rawgraphs/rawgraphs-charts')

const { dataset, dataTypes, errors } = parseDataset(csvParse(fs.readFileSync('sample-sales.csv', 'utf8')))
const viz = chart(barchart, {
  data: dataset,
  dataTypes,
  mapping: {
    bars: { value: 'category' },
    size: { value: 'revenue', config: { aggregation: 'sum' } },
    color: { value: 'category', config: { aggregation: 'csvDistinct' } },
  },
  visualOptions: { width: 800, height: 450, marginLeft: 80, sortBarsBy: 'totalDescending' },
})
const svg = viz.renderToString(new JSDOM('').window.document)
rows parsed: 4734 parse errors: 0
inferred types: {"order_id":"number","order_date":{"type":"date","dateFormat":"YYYY-MM-DD"},"region":"string","channel":"string","segment":"string","category":"string","product":"string","quantity":"number","unit_price":"number","revenue":"number"}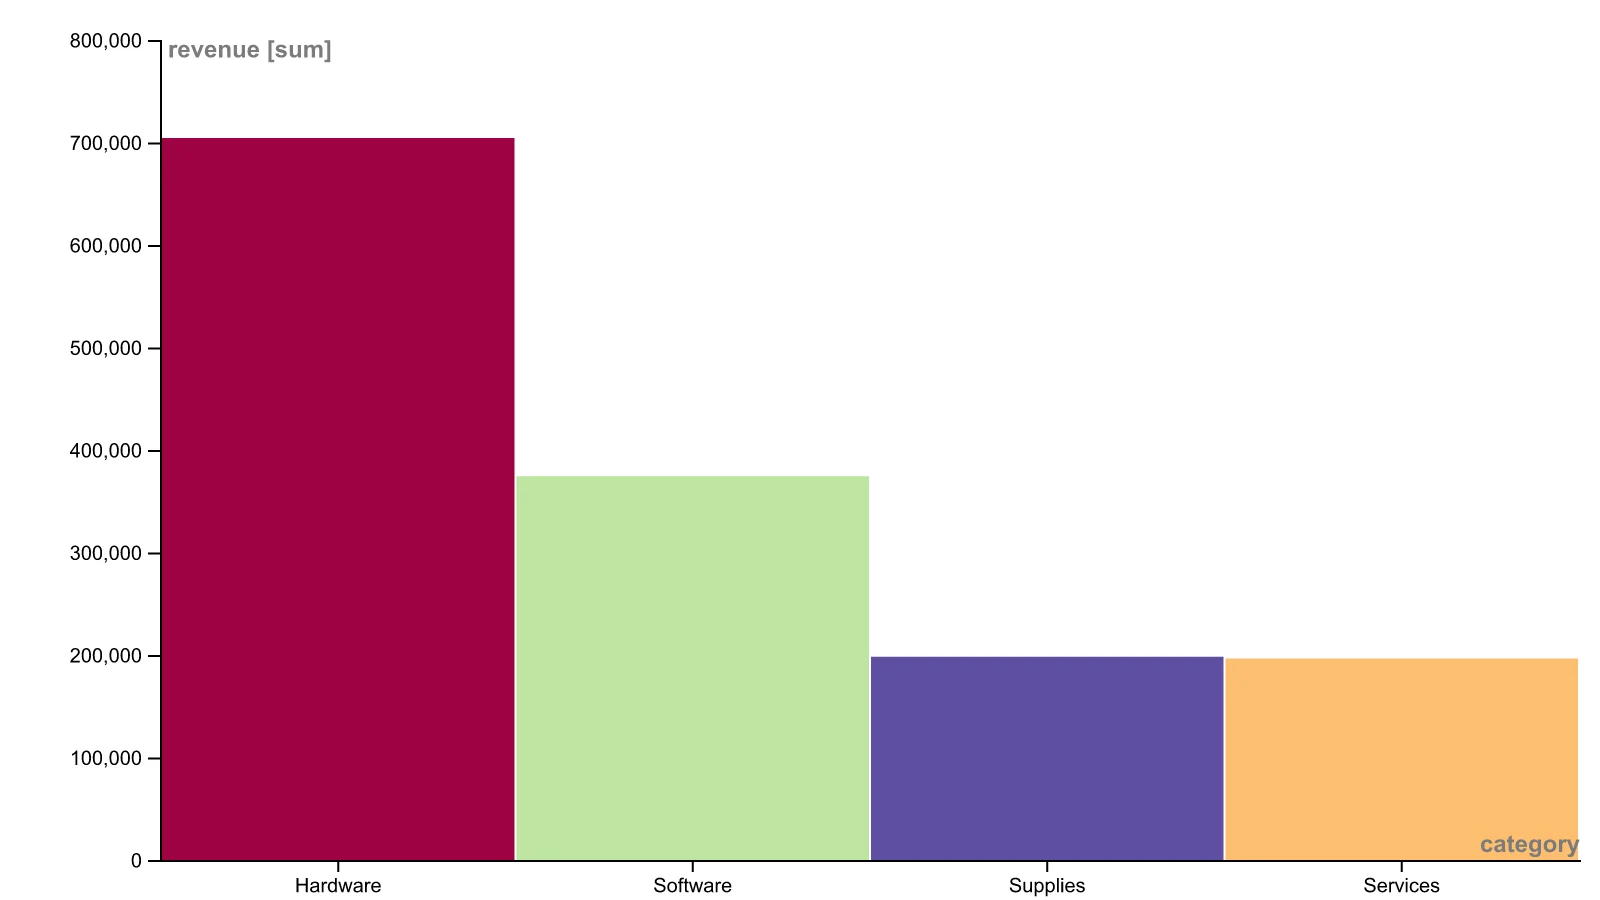
A bar chart rendered with RAWGraphs' own libraries from 4,734 invented orders.
- It read the file cleanly: 4,734 rows, no errors, and the right type for every column, date format included.
- The numbers are exact: working back from the bar heights in the SVG gives $704,343.33 for Hardware and $196,687.45 for Services, the same sums to the cent that SQL gives on the file.
- The defaults are bare: no title, an axis label reading revenue [sum], and bars 1 pixel apart, which makes a bar chart look like a histogram. Widen the padding; bar chart vs histogram explains why.
Nothing is hosted, so sharing means sending the file: RAWGraphs lets you "Save your project, or export it as vector or raster image".
Canva
Canva's "30+ chart options" go inside any design, such as a slide or a social post. You type the data, upload "a CSV or XLSX file up to 25MB", or connect a data app, but "you can only import up to 1000 rows and 100 columns of data". Data apps, Google Sheets among them, are "only available on Canva Business and Canva Enterprise". A chart updates by itself only when it's "connected to a Canva Sheet in the same design". Canva's pricing page refused our automated request, so its prices are left out.
ChatGPT and Claude
Both chart an uploaded file by writing and running code, and the chart is a snapshot: next month's numbers mean a new upload. ChatGPT's free plan marks data analysis and uploads "Limited". On Claude's free plan, Claude "can create data visualizations in image files like PNG" from files up to "30MB per file". Our AI chart generator comparison covers both.
Which one to use
- The data is in a spreadsheet you keep: Google Sheets or Excel for the web.
- A chart for a website, updated from a CSV: Datawrapper.
- An unusual chart that a designer will finish: RAWGraphs.
- A chart in a slide or social post: Canva, or Flourish if you already pay for Canva Business.
- A one-off chart from a messy file: ChatGPT or Claude.
- A chart on company data that a team opens every week: a tool that queries the database.
When the data is in a database
Every tool above charts a copy of the data: a pasted table, an uploaded file, a CSV link. When the numbers live in a database and the chart has to be right every Monday, something has to rerun the query. Fastero is an AI and data platform where people and AI agents work together on a team's data:
- Charts from SQL: connect Postgres, MySQL, SQL Server, Redshift, Snowflake, Oracle or BigQuery and ask for a chart in plain English: the AI agent writes the SQL, draws the chart and saves both. Uploaded CSV and Excel files can be charted too.
- Stays current: a dashboard refreshes on a timer (1, 5, 15 or 60 minutes) or, for Postgres and BigQuery data only, when the data changes. A chart from an uploaded file is a snapshot until you upload the file again.
- Sharing: colleagues sign in and viewers are free; "Just this person" sends one dashboard to an email address; "Anyone with the link" makes a public link you can turn off; a scheduled email sends the charts with a PDF.
- Price: Free is $0 with no end date, with $20 of AI and 3 exports a month; a new account starts with 14 days of Pro (checked 18 November 2026).
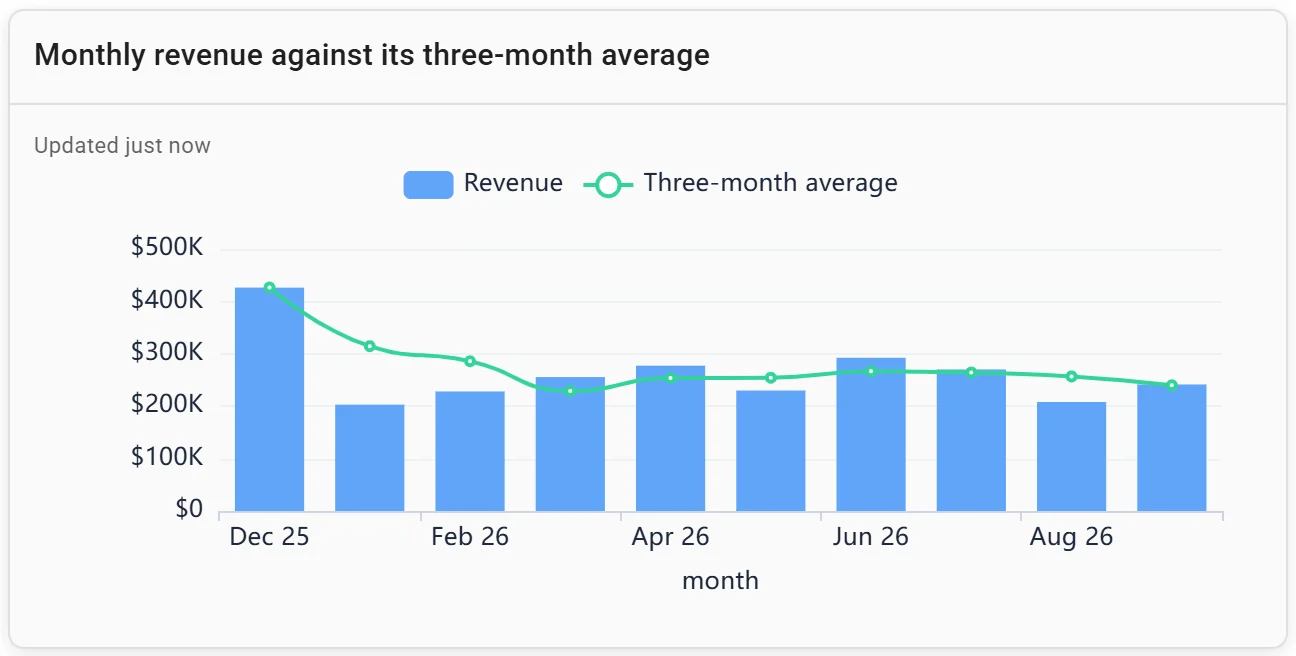
A combo chart: monthly revenue against its three-month average. Invented data.
More on the best free dashboard tools.
FAQ
What is the best free chart maker?
For data in a spreadsheet, Google Sheets: the chart updates with the sheet and downloads as SVG, PNG or PDF. To publish a chart online, Datawrapper, whose free plan has unlimited charts and live updates from a CSV link.
Is there a free chart maker without sign-up?
Datawrapper lets you "Create a chart or a map now – no need to sign up". RAWGraphs runs in your browser, which processes the data itself.
How do I make a chart that updates automatically?
Keep the chart where the data is: a chart in Google Sheets or Excel redraws when the cells change. Datawrapper can follow a CSV on the web or a Google Sheet, free, for 30 days per publish. For a database, use a tool that reruns the query.
Is Datawrapper free?
Yes. The free plan creates, publishes, embeds and exports charts as PNGs without limits, with a "Created with Datawrapper" credit. Pro, at $21 per user a month as of 18 November 2026, removes the credit and adds PDF and SVG downloads.
Can AI make a chart from my data?
Yes. ChatGPT and Claude make charts from an uploaded file by writing and running code, on free plans with limits. Our AI chart generator guide, linked above, compares twelve such tools.
Sources
Read on 18 November 2026:
- Google: Add a chart, Chart types, Save or publish a chart, Publish to the web, File limits, Storage
- Microsoft: Microsoft 365 for the web, Save a chart as a picture, Link to an Excel chart
- Datawrapper pricing and FAQ, Datawrapper live-updating options, Flourish pricing
- RAWGraphs: rawgraphs.io, rawgraphs-app, rawgraphs-core
- Canva: Charts, Import chart data, Download file types
- ChatGPT pricing, Claude pricing, Claude files, Claude artifact sharing, Fastero pricing