 Fastero Dev Team
Ask an AI for a chart and you'll get one in seconds. The question is where its numbers came from. Some tools analyse a file you upload, some query your database, and some draw whatever you type, inventing the numbers if you give them none. This guide sorts twelve of them by that question, then by price.
The short answer: an AI chart generator turns a file, a table or a sentence into a chart. General assistants work from your data: ChatGPT runs Python on an uploaded file (data analysis is "Limited" on its free plan, and interactive charts need Plus at $20 a month), and Claude makes charts in files and artifacts on its free plan. Gemini in Sheets and Copilot in Excel need paid Google or Microsoft plans. Design tools such as Canva, Graphy and Venngage chart a prompt, and Canva generates sample data if you give it none. For a chart that stays current, the tool has to query the data itself.
Fastero
Connect your database. Ask questions. Get dashboards.
Postgres, BigQuery, Snowflake, and 10+ sources — live-connected, AI-powered, no dashboard builder learning curve.
Try free →AI chart generators at a glance
Prices from each vendor's own page on 11 November 2026, in US dollars unless noted.
| Tool | Makes the chart from | Free plan | Paid from |
|---|---|---|---|
| ChatGPT | An uploaded file, run in Python | Data analysis limited, static charts only, 3 uploads a day | Go $8, Plus $20 a month |
| Claude | Uploaded files and connectors; Claude Data queries a warehouse | Files, code and artifacts on Free | Pro $17 a month yearly or $20 monthly |
| Julius AI | Uploaded files; databases on Business | Free daily credits | Plus $20, Pro $45, Business $450 a month |
| Gemini in Google Sheets | The open spreadsheet | No: needs a paid Workspace or Google AI plan | Google's paid plans |
| Google Colab | Data in a notebook | Colab is free; its AI agent graphs data | Colab's paid plans |
| Copilot in Excel | The open workbook | No: needs Microsoft 365 Personal or higher | Personal $99.99 a year |
| Copilot in Power BI | A Power BI model | No: needs paid Fabric or Premium capacity | Fabric F2 $262.80 a month |
| Tableau Pulse and Agent | Tableau data | No | Creator $75 per user a month |
| Canva AI charts | A prompt or a CSV | Limited access to its AI tools | Canva Pro |
| Flourish Assistant | Edits an existing Flourish chart | On all plans | Via Canva Business |
| Datawrapper | Pasted data (no AI on its pricing page) | Free, with its attribution | Pro $21 per user a month |
| Graphy | Data or a prompt | 5 charts, limited AI | Plus $16 per user a month, yearly |
Assistants that chart your own data
ChatGPT
Upload a CSV or spreadsheet and ChatGPT "writes and runs Python code in a stateful Jupyter notebook environment" to analyse it. "ChatGPT can create static charts as image outputs. Some charts can also be shown as interactive charts", but "Interactive charts are supported for bar, line, pie, and scatter charts" only. Two limits catch people: "The Python environment used for data analysis cannot make external web requests or API calls", so it can't read your database, and "Free users are limited to 3 file uploads per day." Files go up to "approximately 50 MB" for a CSV.
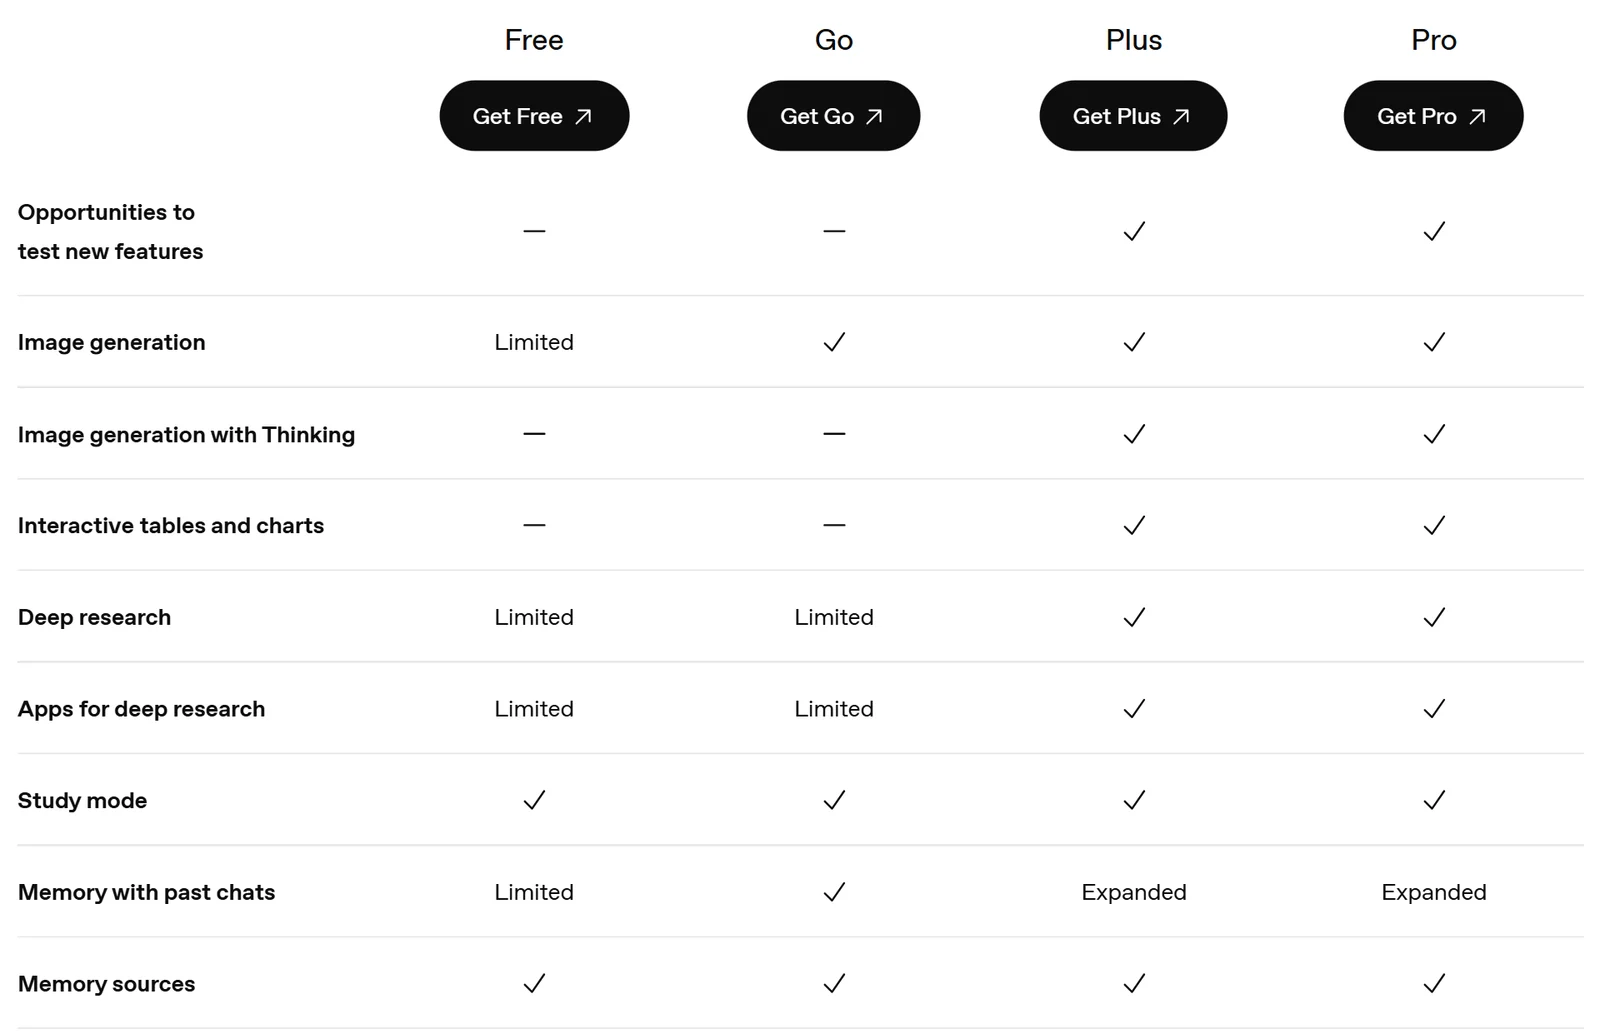
ChatGPT's plans on 11 November 2026: interactive charts start at Plus.
Claude
"Code execution and file creation is available to all Claude users", Free included, and Claude can "produce reports with charts and visualizations" or draw a chart as an artifact you can open beside the chat. For live data, Claude Data (until recently "Claude Dashboards") connects to a warehouse: "Claude writes a SQL query for each chart and runs it against your data source", so you can read the query behind every number. It's "available on Pro, Max, Ultra, Team, and Enterprise plans", and "It doesn't refresh on a schedule": charts update when someone opens them. Through a connector such as Fastero's, Claude can also chart from a database you've connected there.
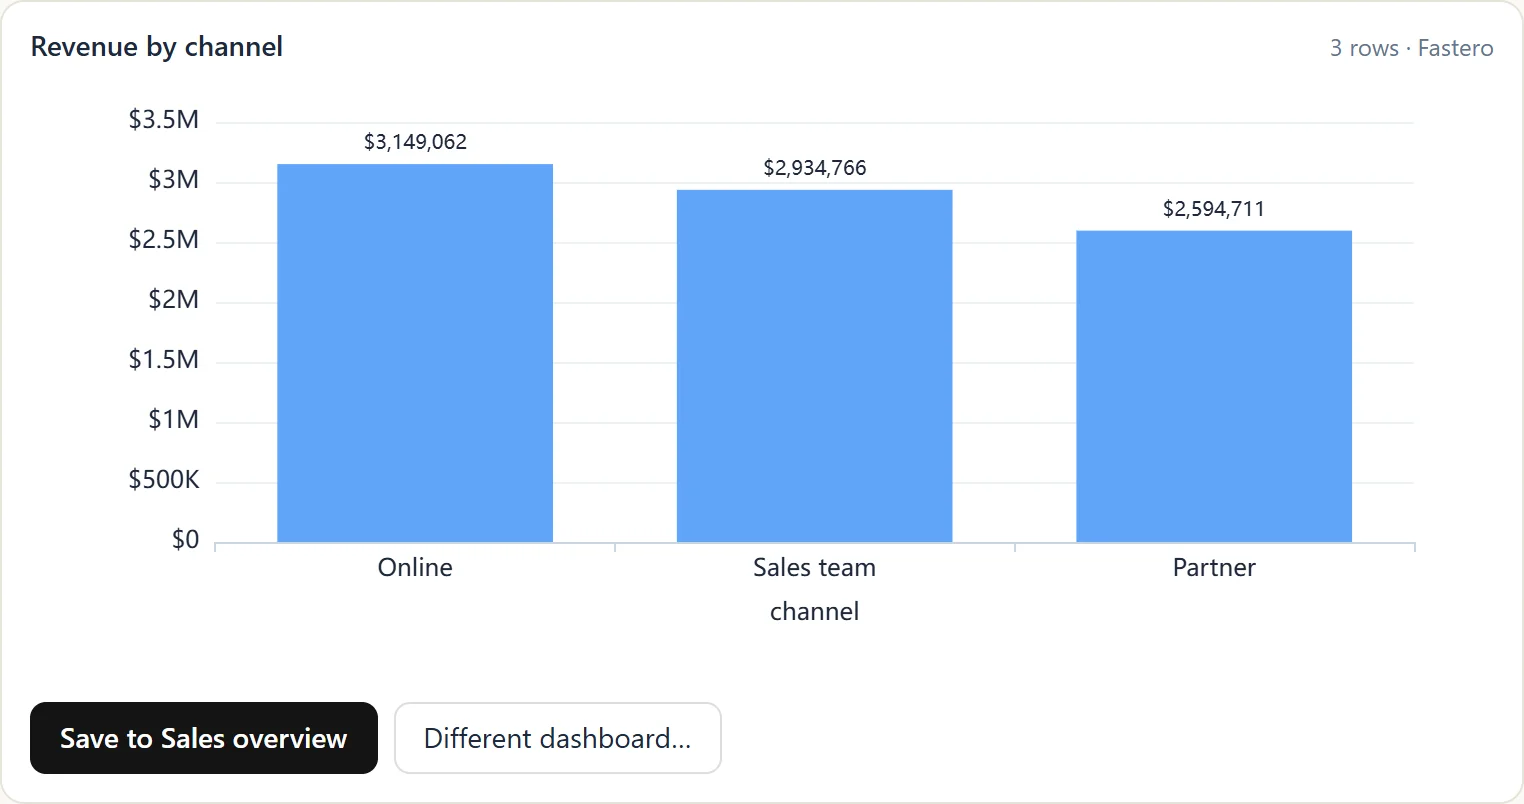
A chart Claude drew from a database through Fastero's connector, with a button to save it to a dashboard.
Julius AI
A data-analysis assistant built around charts from your files, with "Free daily credits" on its free plan. Plus costs $20 a month and Pro $45; database connectors ("Postgres, BigQuery, Snowflake + more data connectors") come with Business at $450 a month.
Gemini in Sheets and Colab
In Google Sheets, Gemini makes charts from the sheet, and since June 2025 "Gemini can produce fully editable charts that regenerate if the spreadsheet data changes." But "This feature requires an eligible Google Workspace or Google AI plan." The free route is Colab: "Users are simply asking Colab AI to graph their data, and it generates high-quality, clearly labeled charts", and "Colab is free of charge to use", within limits Google doesn't publish. See Colab's AI.
Copilot in Excel and Power BI
In Excel, "Describe the chart you want, and Copilot generates it." It needs Microsoft 365 Personal ($99.99 a year), Family or Premium, and "requires AutoSave to be enabled, meaning the file must be saved to OneDrive". Copilot in Power BI is a business feature: it needs "Paid Fabric capacity (F2 or higher) or Power BI Premium (P1 or higher)", and "A Power BI Pro or Premium Per User (PPU) license alone isn't sufficient". The smallest Fabric capacity costs $262.80 a month pay-as-you-go.
Tableau
Tableau's Standard edition includes "access to Tableau Pulse", its automated metric summaries, with Creator at "$75 per user/month, billed annually". Its chart-building Tableau Agent is only in "Tableau Cloud+ Edition and the Tableau+ Bundle", sold through sales.
Design tools that chart a prompt
These are for a chart in a presentation, social post or infographic, not for analysis.
- Canva: AI charts from a prompt or a CSV ("No, only CSV files are supported."). Read the fine print: "If you don't provide data, Canva AI will generate sample data based on your prompt." Free and Pro Lite users get "Limited access to Standard and Premium AI tools." Magic Charts linked to Canva Sheets stay "in sync with your spreadsheet data".
- Flourish: its AI Assistant edits charts you've already made, "using plain-language prompts", and is "Available on all plans." It's "Built on Claude".
- Datawrapper: free charts and maps with a "Created with Datawrapper" credit; no AI chart feature on its pricing page. Pro is $21 per user a month.
- Graphy: free for 5 charts with limited AI; Plus is $16 per user a month on yearly billing.
- Venngage and Piktochart: infographic tools with AI credits on their free plans: Venngage lists "80 Daily AI Credits at Signup", Piktochart 60 AI credits.
Connect any database. Ask in plain English.
Start free →Can you trust an AI chart?
Three checks before a chart goes in front of anyone:
- Where did the numbers come from? A design tool given a prompt may have made them up. An assistant given a file used that file, but check it read every row: big files get sampled or truncated.
- Can you see the calculation? ChatGPT shows its Python, Claude Data shows its SQL. If the tool can't show you how it got a number, don't send the number.
- Will it be right next week? A chart from an uploaded file is a snapshot. A chart from a query can be rerun. Only a tool that queries the data on a schedule, or whenever the chart is opened, stays current.
Charts that stay current, from your database
The tools above are good at one chart, once. A team usually needs the same chart every Monday, on today's numbers, where colleagues can open it.
Fastero is an AI and data platform where people and AI agents work together on a team's data. Connect a database or warehouse, ask for a chart in plain English, and the AI agent writes the SQL, draws the chart and saves both. "Every chart is a saved query, so the report shows today's numbers when it is opened, refreshes on a timer or when the data changes, and goes out as a PDF by email on the day you choose." Colleagues sign in to see it, and viewers are free. See the example dashboards, each with the SQL behind its numbers.
More on AI report generators, AI dashboard tools, Claude artifacts and the best Python visualisation libraries.
FAQ
What is the best free AI chart generator?
For your own data, Claude's free plan (charts in files and artifacts) and Google Colab's AI (charts from notebook data) are the most capable free options. ChatGPT's free plan makes static charts within its upload limits. For a design-led chart, Canva or Graphy.
Can ChatGPT make charts from data?
Yes. Upload a CSV or spreadsheet and ChatGPT analyses it in Python and draws the chart. On the free plan, data analysis is limited and charts are static images; interactive bar, line, pie and scatter charts need Plus or Pro.
Can Claude make charts?
Yes. On every plan, Claude makes charts in files it creates and as artifacts. On Pro and above, Claude Data connects to a warehouse, writes a SQL query per chart and reruns it when the chart is opened.
Can AI make a chart from Excel?
Yes. Copilot in Excel makes charts from a description, with a Microsoft 365 Personal, Family or Premium plan and the file saved to OneDrive. ChatGPT, Claude and Julius make charts from an uploaded Excel file.
Are AI-generated charts accurate?
Only as accurate as their data and calculation. Check that the tool used your data rather than sample data, look at the code or SQL behind the chart, and rerun it before sharing. Canva, for one, generates sample data when none is given.
Sources
Read on 11 November 2026; some pricing pages showed euros to our European connection, and US prices come from the vendors' help pages or announcements:
- OpenAI: Data analysis with ChatGPT, File uploads, Pricing, Introducing ChatGPT Go
- Anthropic: Claude pricing, Create and edit files, Claude Data
- Google: Gemini in Sheets, Editable charts in Sheets, AI-first Colab
- Microsoft: Copilot in Excel, Microsoft 365 plans, Copilot in Power BI, Fabric pricing
- Julius pricing, Tableau Cloud pricing, Canva AI charts and AI access, Flourish AI Assistant, Datawrapper pricing, Graphy pricing