 Fastero Dev Team
Supabase's dashboard now charts your own data, not only the project's health, but only for members of your Supabase organisation. For anyone else you need a dashboard tool on the database, and a few settings decide whether it works the first time.
The short answer: Supabase's Reports chart project health (database load and size, Auth sign-ups, API and Storage traffic) over the last 24 hours on Free, 7 days on Pro and 28 days on Team. For your own data, run a query in the SQL Editor, open its Chart tab for a bar or line chart, and add it to a custom report. Only members of your organisation see these, and on Free and Pro the narrowest role is Developer, with full access to the project's content. For a dashboard others open, connect Metabase, Grafana, an AI agent or Fastero with the Session pooler string (port 5432, IPv4 on every plan), sslmode=require and a read-only role. If Row Level Security is on, that role sees zero rows until you add a policy for it. Checked 18 November 2026.
Fastero
Connect your database. Ask questions. Get dashboards.
Postgres, BigQuery, Snowflake, and 10+ sources — live-connected, AI-powered, no dashboard builder learning curve.
Try free →What Supabase's own dashboard charts
| Feature | What it shows | Limits |
|---|---|---|
| Reports | Database, Auth, Storage, Realtime, API gateway, PostgREST and Edge Functions charts | Up to 24 hours on Free, 7 days on Pro, 28 days on Team and Enterprise; Supabase Cloud only |
| SQL Editor, Chart tab | A bar or line chart of a query's result: one X and one Y column, optionally cumulative | Results capped at 100, 500 or 1,000 rows unless you pick "No limit" |
| Custom reports | Saved SQL snippets as blocks, shown "as a table of results" or "as a chart", resized and reordered | Snippets are made in the SQL Editor first |
| Explorer and Notebooks | Database and log queries where "every result renders as a table or a chart"; notebooks save the queries with notes, not the results | Feature preview since 30 October 2026 |
As a team dashboard, all of this has two limits:
- Who can open it: the viewer must be a member of your Supabase organisation. The Read-Only and No-access roles "are only available on the Team and Enterprise plans", and Team starts at $599 a month. On Free and Pro the narrowest role is Developer: "full content access to project resources". None of the Supabase pages we read mention a public link to a report or emailing one.
- Whose rows it shows: "Queries you run in the Dashboard execute as postgres", and on Supabase postgres "has bypassrls". So a chart there sees every row, while a tool connected with its own role sees only what that role may: the same query can return thousands of rows in Supabase and none in Metabase.
Four ways to build a dashboard on a Supabase database
Prices checked 18 November 2026.
| Way | Best for | Who opens it | Price |
|---|---|---|---|
| Metabase | Business charts and dashboards, by clicking or in SQL | People with a Metabase login, or a guest embed | Open Source is free to self-host; Starter is $100 a month with 5 users, then $6 per user; Pro is $575 a month with 10 |
| Grafana | Monitoring the project, or time series from your tables | People with a Grafana login, or anyone with an externally shared link | Open source to self-host; Grafana Cloud Free has 3 active users; Pro is a $19 monthly fee including 3, then $8 per active user |
| An AI agent over MCP | A question answered today | You | Your AI client's plan |
| Fastero | Team dashboards, built by you or by Claude | Colleagues with their own login, or a public link | Free is $0; Pro is $20 per editor a month; viewers are free |
Metabase
Supabase's quickstart connects it with the details under "Session pooler"; in Metabase, "To connect to a Supabase database, select PostgreSQL." Set SSL Mode to require, because Metabase "automatically tries to connect to databases with SSL first, then without if that doesn't work", and use a read-only user, the role below. More in Metabase vs Grafana.
Grafana
For the project's health, add Supabase's Grafana Cloud integration from the Supabase dashboard: it scrapes the Metrics API (in beta, "~200 Postgres performance and health series") into a prebuilt dashboard, and "You can add the integration without creating a Grafana Cloud account first." For your tables, add a PostgreSQL data source with the Session pooler details and TLS/SSL Mode require. Use a read-only role: "Grafana does not validate the safety of queries, so users could run potentially harmful SQL (for example, DROP TABLE)."
An AI agent over MCP
Supabase's MCP server, https://mcp.supabase.com/mcp, lets Claude Code or Cursor run SQL on the project and answer in plain words. On real data Supabase says to "scope the server to that project, enable read-only mode, restrict the available feature groups": add ?project_ref=<ref>&read_only=true. Our Supabase MCP server guide covers what read-only mode doesn't stop; for a chart a colleague opens next week, see Claude dashboards.
Connection details that trip people up
- Use the Session pooler. Supabase's own table puts "A third-party tool, such as a BI client or database GUI" on the shared pooler in session mode: "Reachable over IPv4 from networks you don't control, and it supports prepared statements." The direct connection is IPv6 without the IPv4 add-on (Pro and above), and the shared pooler's port 6543, transaction mode, doesn't support prepared statements.
- Copy the host from Connect. It contains a cluster index, so "you can't work out your host from your region."
- Change the username. Through the shared pooler a custom role logs in as
[ROLE].[PROJECT-REF]:dashboard_reader.<your-project-ref>, notdashboard_reader. Percent-encode&,#,?or a space in the password (more in Postgres connection strings). - Require SSL. "Most drivers default to prefer, which falls back to sending your data in plaintext if the encrypted attempt fails." Use
sslmode=require, orverify-fullwith the root certificate from Database settings. The "Enforce SSL on incoming connections" switch refuses unencrypted clients, after a brief database reboot. - Know what any role can read. "When pg_net is enabled, any role that can connect to your database can read the request headers that pg_net queues, including API keys." Some grants every role gets can't be revoked, so Supabase suggests you "limit who can connect and set a connection limit on each role."
Connect any database. Ask in plain English.
Start free →A read-only role for your dashboard tool, tested
Supabase says not to give the postgres password to a third-party service "unless you absolutely trust them", but to create a user per service. Run this in the SQL Editor:
CREATE ROLE dashboard_reader WITH LOGIN PASSWORD '<a long random password>' CONNECTION LIMIT 5;
GRANT CONNECT ON DATABASE postgres TO dashboard_reader;
GRANT USAGE ON SCHEMA public TO dashboard_reader;
GRANT SELECT ON ALL TABLES IN SCHEMA public TO dashboard_reader;
ALTER DEFAULT PRIVILEGES IN SCHEMA public GRANT SELECT ON TABLES TO dashboard_reader;
ALTER ROLE dashboard_reader SET default_transaction_read_only = on;
ALTER ROLE dashboard_reader SET statement_timeout = '30s';
We can't sign in to Supabase here, so on 18 November 2026 we ran the same statements on Postgres 18.6 in Docker (postgres:18-alpine), on a sales table of 4,734 invented orders. As dashboard_reader, verbatim:
INSERT INTO public.sales (order_id, revenue) VALUES (99999, 1);
ERROR:  cannot execute INSERT in a read-only transaction
SET default_transaction_read_only = off;
SET
INSERT INTO public.sales (order_id, revenue) VALUES (99999, 1);
ERROR:  permission denied for table sales
The second error is the one that protects you. A session can switch the read-only setting off, as Supabase warns: "Use it to prevent accidental writes only." The missing INSERT grant is the lock. A table postgres created afterwards was readable at once, thanks to the default privileges line.
Then we turned on Row Level Security, as Supabase advises for "every table in an exposed schema". An excerpt, with our comments:
-- as postgres
ALTER TABLE public.sales ENABLE ROW LEVEL SECURITY;
ALTER TABLE
SELECT count(*) AS rows_seen_by_owner FROM public.sales;
 rows_seen_by_owner
--------------------
               4734
-- as dashboard_reader
SELECT count(*) AS rows_seen_by_reader FROM public.sales;
 rows_seen_by_reader
---------------------
                   0
-- as postgres
CREATE POLICY dashboard_reader_select ON public.sales FOR SELECT TO dashboard_reader USING (true);
CREATE POLICY
-- as dashboard_reader
SELECT count(*) AS rows_seen_by_reader FROM public.sales;
 rows_seen_by_reader
---------------------
                4734
No error, just empty charts. Add a FOR SELECT TO dashboard_reader policy to each table the dashboard reads, narrower than USING (true) if it should see only some rows. Views need care too: "Views bypass RLS by default because they are usually created with the postgres user." Our view of revenue by region showed all four regions to a role allowed only North, and one after ALTER VIEW ... SET (security_invoker = true). Policy patterns are in our row-level security guide.
When the dashboard is for people outside Supabase
Fastero is an AI and data platform where people and AI agents work together on a team's data, and a Supabase project connects to it as Postgres.
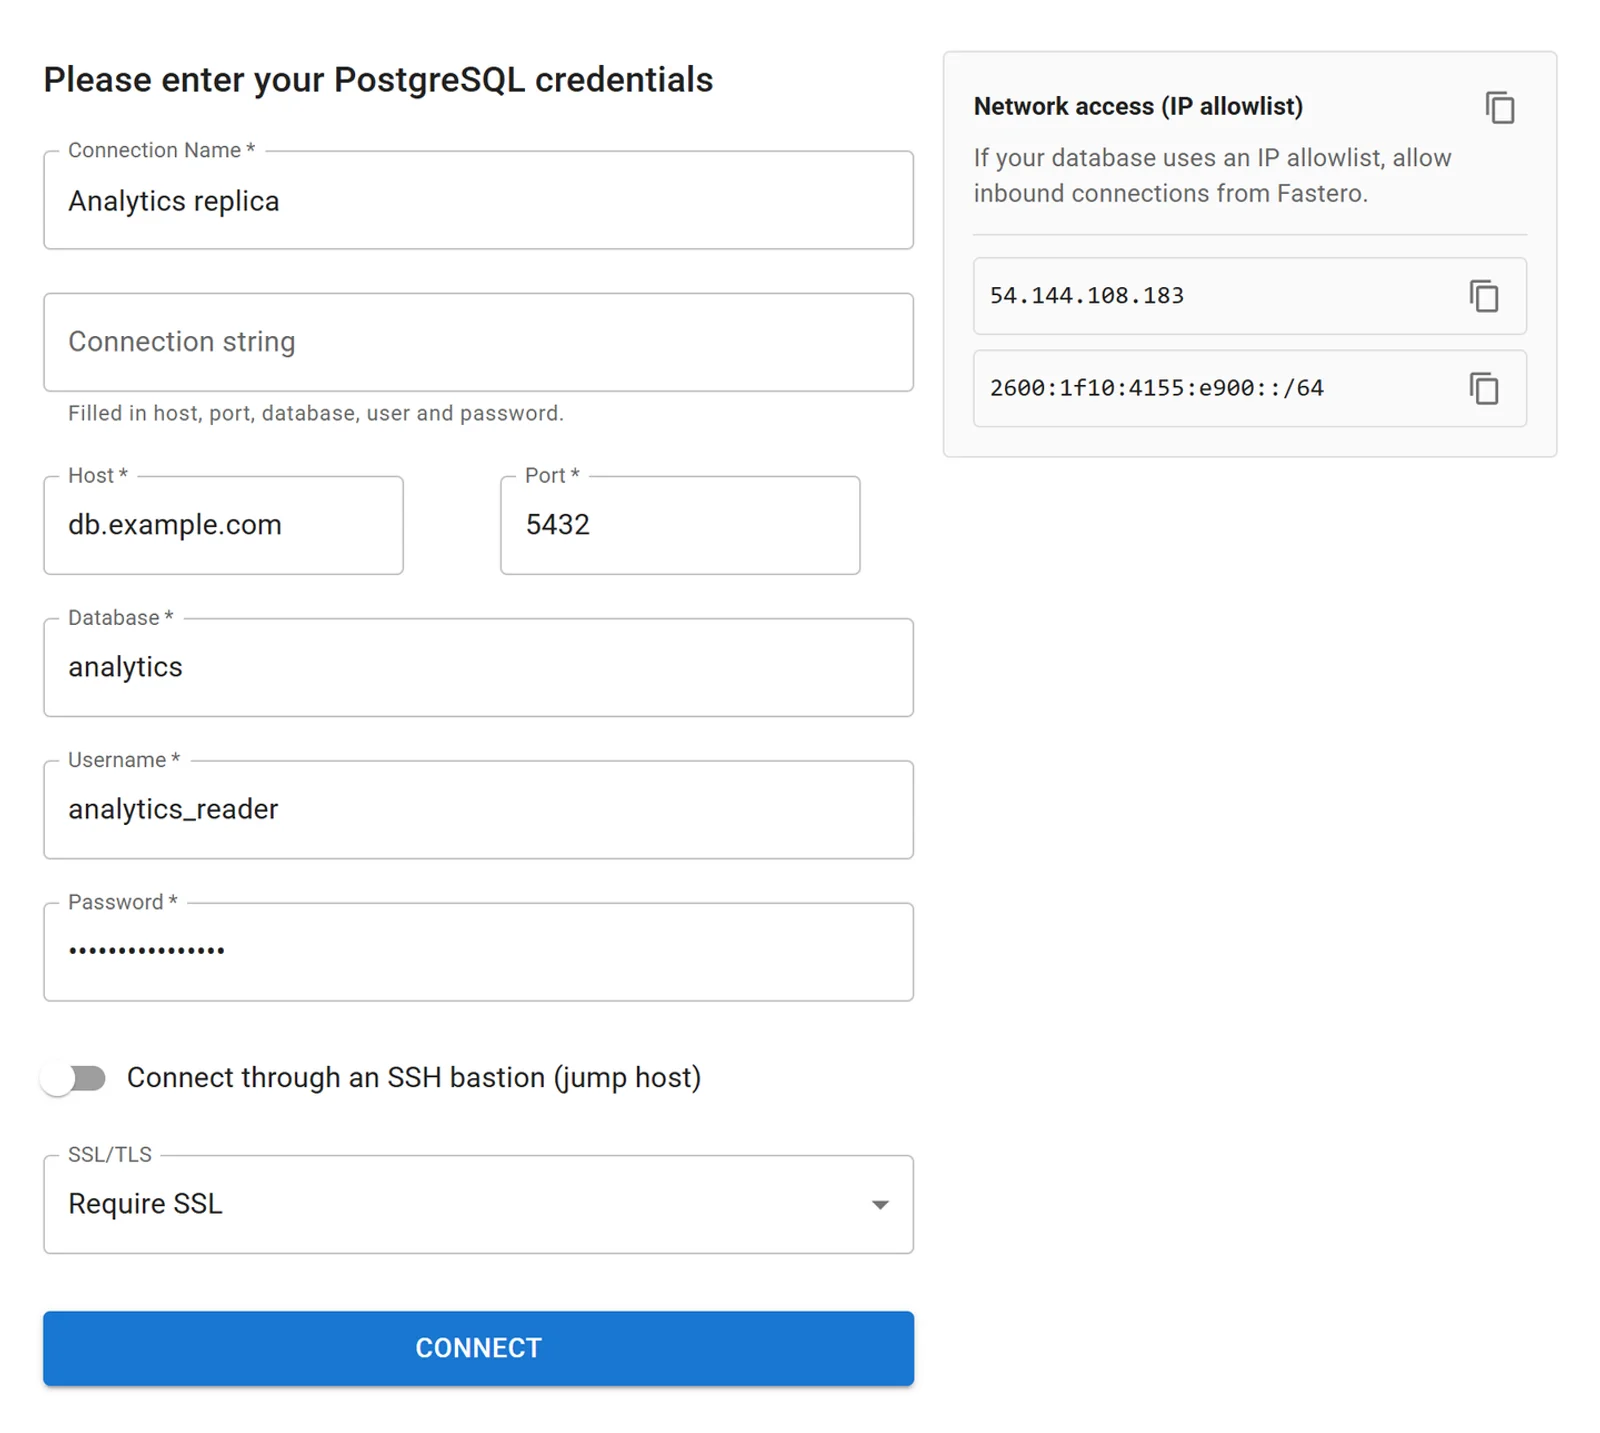
The Postgres connection form after pasting a connection string, with invented values.
- A guided connection. Choose Supabase and the Postgres form lists the steps: copy the Session pooler string from Connect, paste it, and type the password if the string shows a placeholder. Log in as
dashboard_reader.<your-project-ref>. - Dashboards colleagues open with their own login, no Supabase membership needed; viewers are free. Or send one dashboard to one email address (Just this person), or make a public link you can turn off (Anyone with the link).
- Refresh on a timer (1, 5, 15 or 60 minutes) or, for Postgres and BigQuery data only, when the data changes. Supabase is Postgres.
- A scheduled email, daily, weekly or monthly, with the numbers, charts and tables plus a PDF.
- Claude can build it: add the remote MCP server
https://api.fastero.com/api/v1/mcpto Claude Code, or Fastero from Claude's connector directory, and sign in through the browser. Its SQL is read-only, at most 500 rows per query.
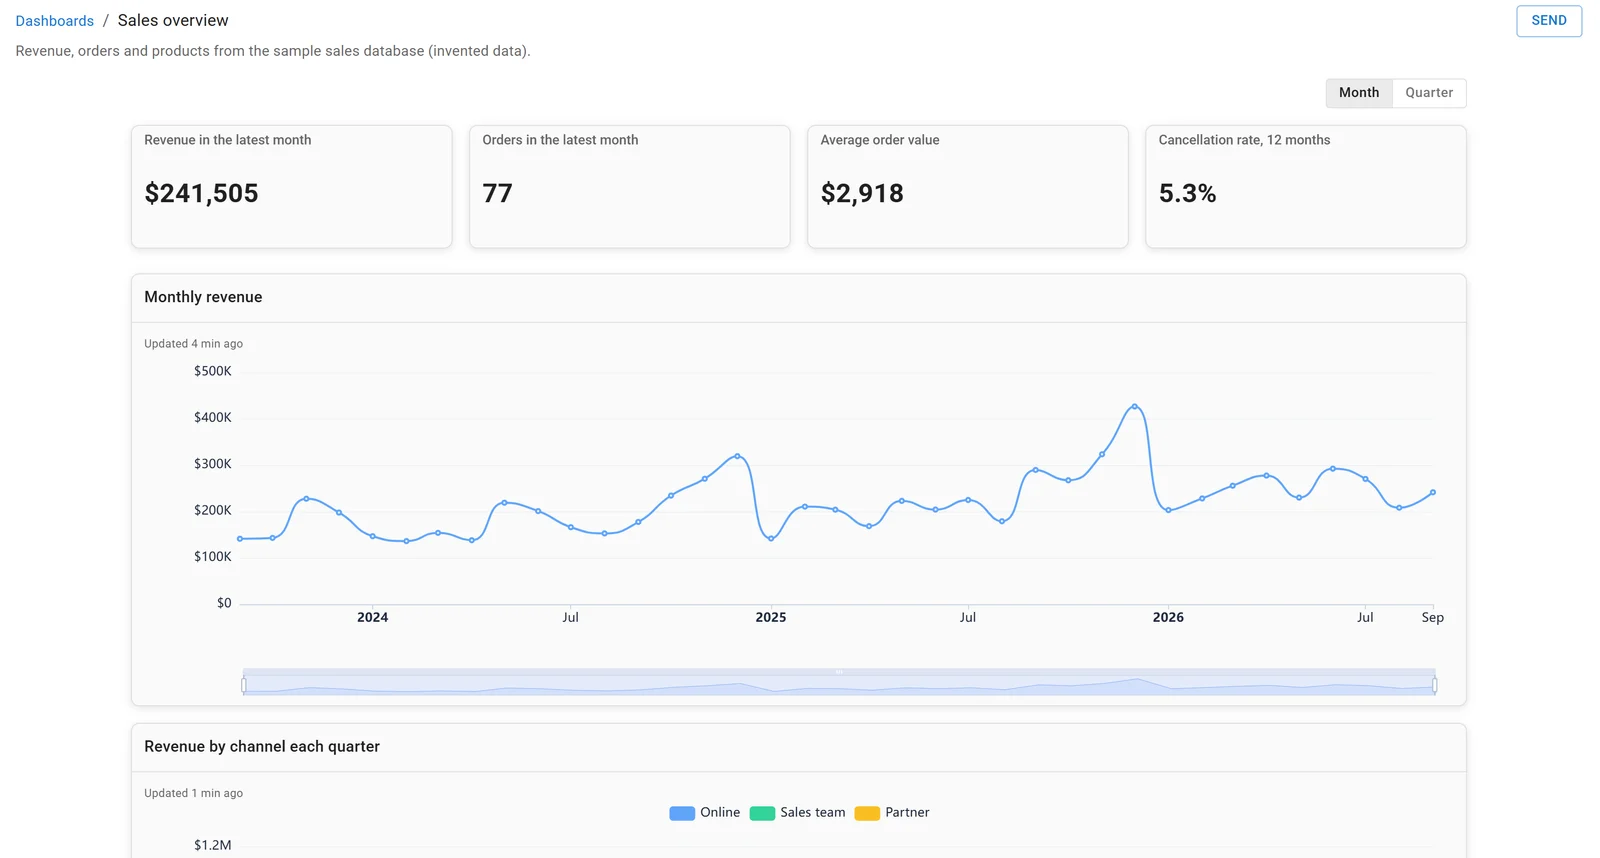
A dashboard in Fastero, built on the sample sales database. Invented data.
Free is $0 with no end date; Pro is $20 per editor a month.
FAQ
Can Supabase make charts?
Yes. The SQL Editor's Chart tab draws a bar or line chart from a query, custom reports collect them, and Explorer's notebooks chart any query cell. Reports chart the project's own health.
Can I share a Supabase report with someone outside my team?
Only by making them a member of your Supabase organisation. Read-Only is a Team and Enterprise role; on Free and Pro the narrowest, Developer, has full access to the project's content.
Why does my dashboard show no data from Supabase?
Usually Row Level Security: with RLS on and no policy for your dashboard's role, a table returns zero rows and no error. Supabase's SQL Editor runs as postgres, which bypasses RLS, so the query works there. Add a FOR SELECT policy for the role.
Should a BI tool use the direct connection or the pooler?
The Session pooler, on port 5432: Supabase recommends it for BI tools because it works over IPv4 and supports prepared statements. The direct connection needs IPv6 or the IPv4 add-on.
Does self-hosted Supabase have reports?
No: "Reports are only available for projects hosted on the Supabase Cloud platform and are not available for self-hosted instances." Neither is the Metrics API.
Sources
Read on 18 November 2026:
- Supabase docs: Reports, Metrics API, Grafana Cloud, Connect to your database, IPv4, SSL enforcement, Roles, Inherited privileges, Row Level Security, Access control, Metabase, MCP, Pricing
- Supabase blog: Studio updates (2 April 2025), Explorer and Notebooks (30 October 2026); Studio source for the Chart tab and row limits
- Metabase: PostgreSQL, Pricing. Grafana: PostgreSQL data source, Shared dashboards, Pricing, Grafana OSS
- Our own test on Postgres 18.6 in Docker, 18 November 2026, invented data
Try Fastero free: connect your Supabase database with a read-only role and build dashboards your team opens with their own login. No credit card required.