 Fastero Dev Team
A real-time dashboard can be a screen fed by a stream, one that re-runs its queries every few seconds, or one that waits for the database to say something changed. For most business numbers the timer is the right design; what matters is how short it is, who pays for each re-run, and when the database should tell the dashboard instead. We built a small one and counted its queries.
The short answer: a real-time dashboard shows data within seconds or minutes of it changing. There are three ways to build one. Poll: re-run the queries on a timer, which works with any database but costs viewers × charts × refreshes. Listen for changes: the database signals when rows change (Postgres LISTEN/NOTIFY, or logical replication for every change), and the dashboard re-queries only then. Stream: events flow through Kafka into a store the dashboard reads, which keeps the dashboard's queries off the source database and is the most to run. In our test, a Streamlit dashboard on a 2-second timer read the database 30 times a minute per open tab; a shared 10-second cache cut three tabs from 90 reads to 5. On a warehouse that bills each query, refresh every 5 minutes or when the data changes.
Fastero
Connect your database. Ask questions. Get dashboards.
Postgres, BigQuery, Snowflake, and 10+ sources — live-connected, AI-powered, no dashboard builder learning curve.
Try free →What "real time" means for a dashboard
Three different things go by the name. Streaming pushes each event to the screen as it arrives. Frequent refresh re-runs the queries on a timer, so the numbers are at most one interval old, and the queries run whether or not anything changed. Refresh on change waits for the database to say rows changed, then re-queries: in our Postgres test the signal arrived under 7 ms after the insert, and nothing ran while nothing changed.
Three ways to build a real-time dashboard
| Approach | How it works | Works with | Database load | Moving parts | Watch out for |
|---|---|---|---|---|---|
| 1. Poll on a timer | Re-run the queries every N seconds | Any database | Grows with viewers and refresh rate | Just the dashboard | Bills on pay-per-query warehouses |
| 2. Change notifications | The database announces changes (LISTEN/NOTIFY) or streams them (logical replication) |
Postgres; SQLite has a local check | Only when data changes | A trigger and a listener, or a replication slot | Payloads under 8000 bytes; an unread slot keeps WAL |
| 3. A stream into a store | Events go to Kafka; a consumer writes a store or pushes to screens | Anything that emits events, or a database via CDC | Moved off the source | Brokers, connectors, a store | The most infrastructure to run |
1. Polling on a timer: a working example
We built a dashboard of invented orders. A writer script appends an order to a SQLite file every 2 seconds; a Streamlit page reads it. We used SQLite rather than DuckDB because DuckDB's docs say its read-write mode means "one process can both read and write" (writing from several processes needs its Quack remote protocol), and here a second process writes. SQLite's write-ahead log mode suits this: "readers do not block writers and a writer does not block readers."
The page's body is a Streamlit fragment. Streamlit's docs: "If run_every is set, Streamlit will also rerun the fragment at the specified interval while the session is active, even if the user is not interacting with your app." An excerpt of the app we ran (Streamlit 1.67.0, Python 3.14.3, SQLite 3.50.4):
refresh = float(st.query_params.get("refresh", 5))
mode = st.query_params.get("mode", "timer")

@st.cache_data(ttl=10)   # one result shared by every viewer for 10 seconds
def cached_queries():
    return run_queries()

def changed():
    """PRAGMA data_version changes when another connection commits: a cheap 'anything new?' check."""
    if "watch" not in st.session_state:
        st.session_state.watch = sqlite3.connect(DB, check_same_thread=False)
    log("check")
    v = st.session_state.watch.execute("PRAGMA data_version").fetchone()[0]
    new = v != st.session_state.get("version")
    st.session_state.version = v
    return new

def body():
    if mode == "cache":
        result = cached_queries()
    elif mode == "change":
        if changed() or "result" not in st.session_state:
            st.session_state.result = run_queries()
        result = st.session_state.result
    else:
        result = run_queries()
    # ... three numbers, a chart and a table drawn from result

st.title("Live orders")
st.fragment(run_every=refresh)(body)()
run_queries() runs the page's three SQL queries and logs each run, which is how we counted. Two screenshots 8 seconds apart, at a 2-second refresh:
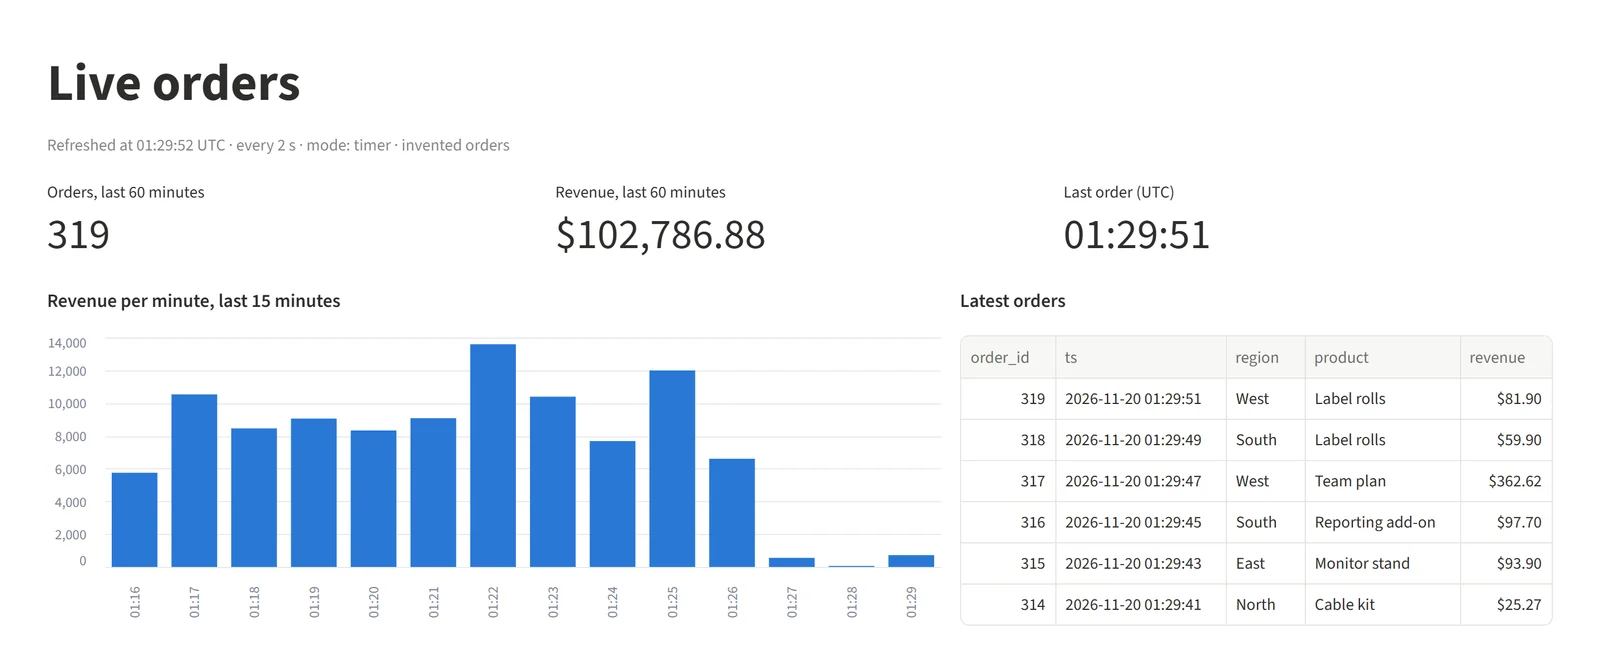
The dashboard at 01:29:52 UTC. Streamlit 1.67.0 over SQLite, invented orders.
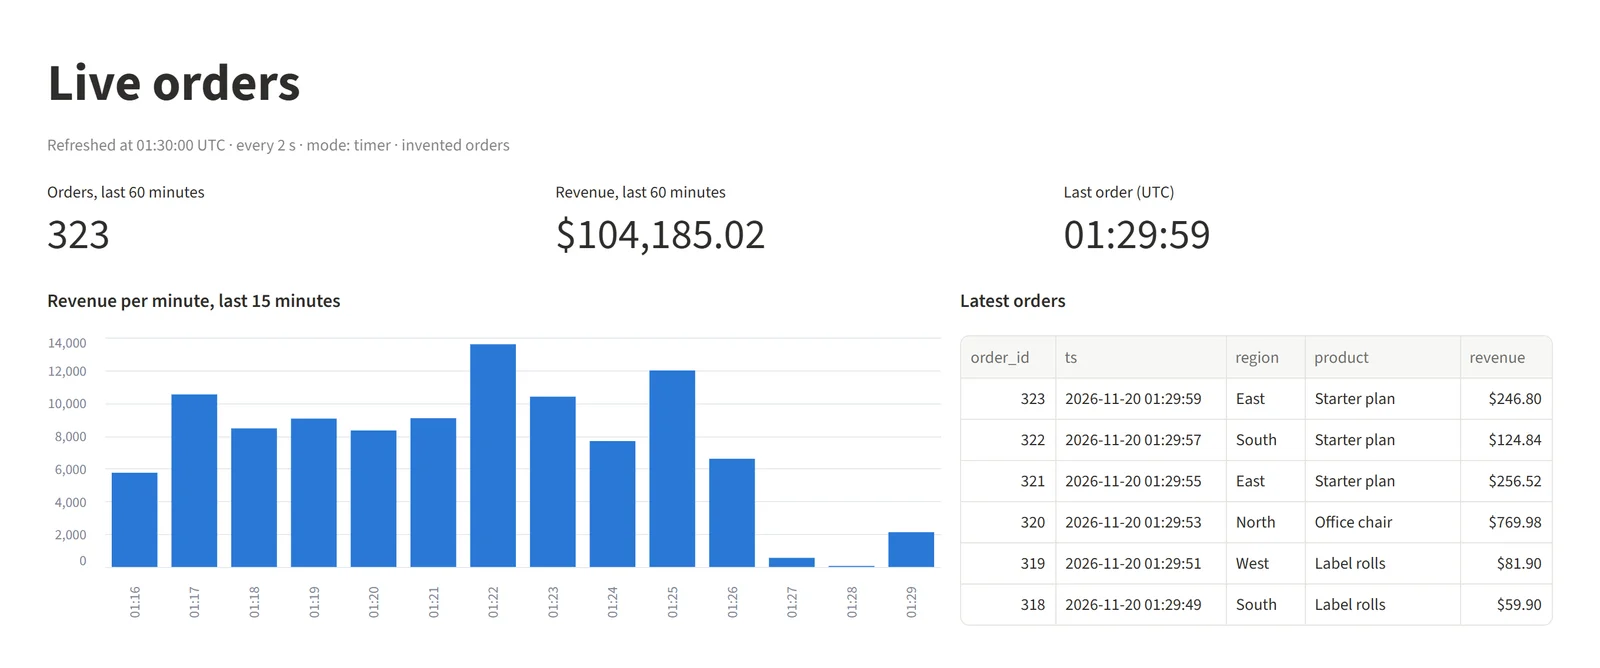
Eight seconds later: four more orders, without a click. Invented orders.
Measured: how many times the dashboard read the database
We opened the page in headless Chrome tabs, each its own Streamlit session, waited 10 seconds, then counted log lines for 60 seconds. Each read is the page's three SQL queries. Run on 20 November 2026:
| Setup | Database reads in one minute | One-line change checks |
|---|---|---|
| Timer 2 s, 1 tab | 30 | 0 |
| Timer 10 s, 1 tab | 6 | 0 |
| Timer 2 s, 3 tabs | 90 | 0 |
| Timer 2 s, 3 tabs, shared 10 s cache | 5 | 0 |
| Change check every 2 s, 3 tabs, new order every 2 s | 90 | 90 |
| Change check every 2 s, 3 tabs, new order every 20 s | 9 | 90 |
| Change check every 2 s, 3 tabs, no new orders | 0 | 90 |
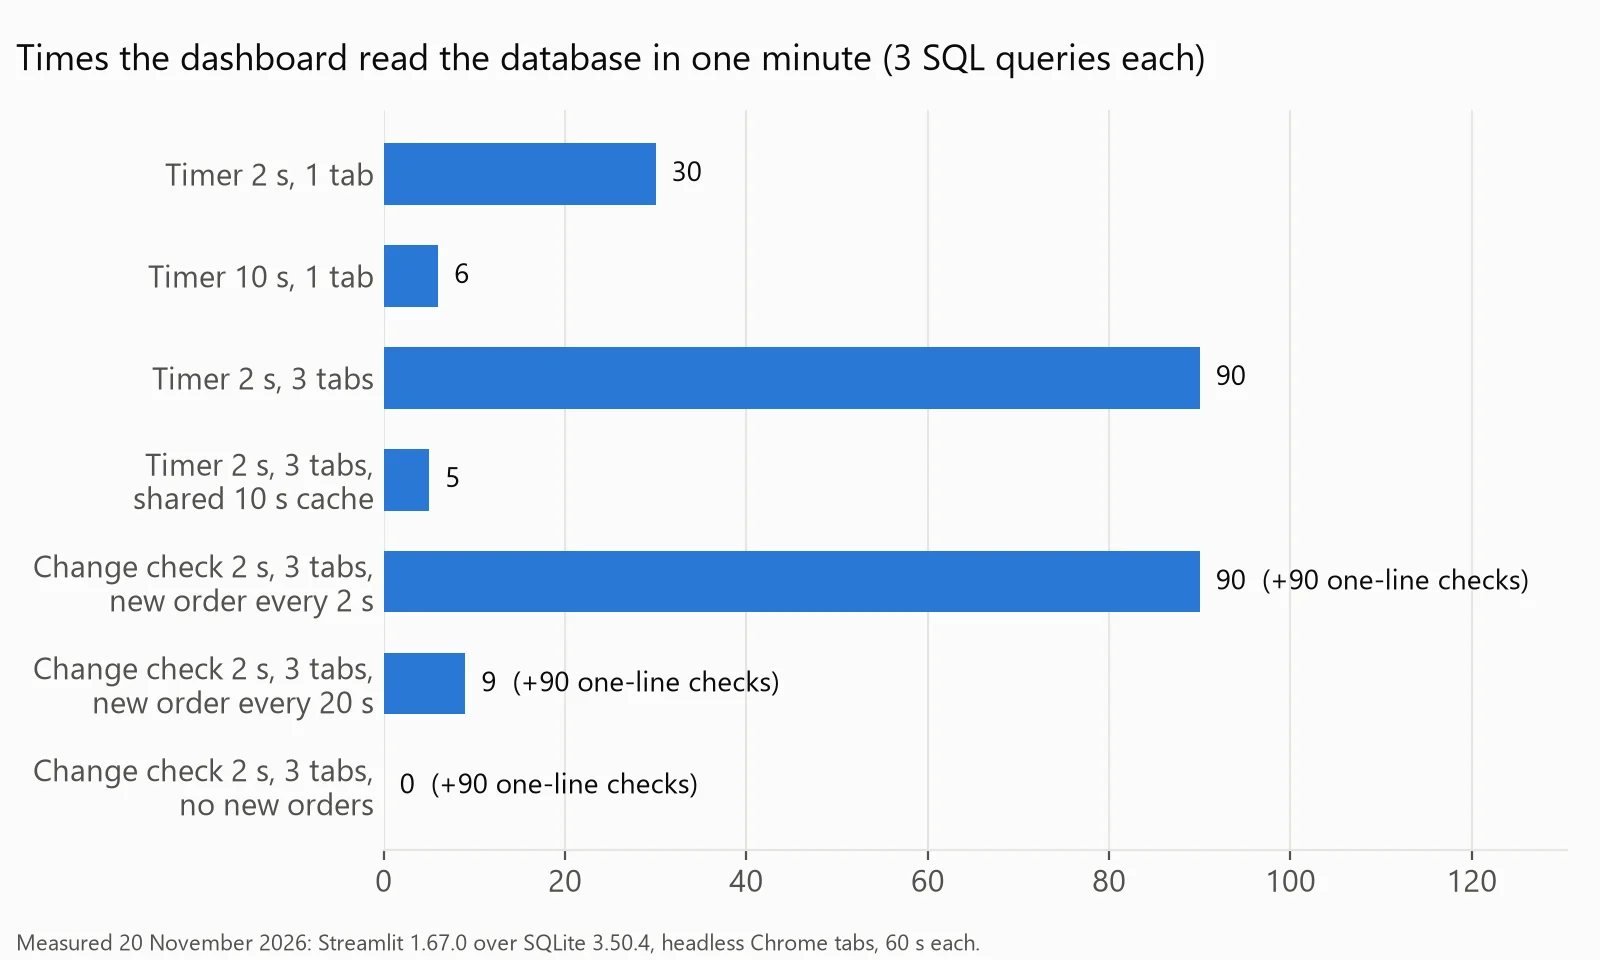
Database reads per minute by refresh setup. Measured with Streamlit 1.67.0 over SQLite 3.50.4 on invented orders.
Three things the numbers show:
- Polling cost is viewers × refreshes. Each tab has its own session and timer: three tabs, 90 reads; one, 30.
- A shared cache breaks the link to viewers. Streamlit's docs say "Global cached data is available across all users, sessions, and reruns", so three tabs shared one result: 5 reads, about one per 10-second cache.
- Checking for changes pays only when changes are rarer than the timer. With an order every 2 seconds, every check found one. With one every 20 seconds, 90 reads fell to 9; with none, to 0.
2. Change notifications from the database
In Postgres, NOTIFY "sends a notification event together with an optional 'payload' string to each client application that has previously executed LISTEN". The docs suggest putting it in a trigger, so "notification happens automatically when the table is changed". The rules to design around: notifications are "not delivered until and unless the transaction is committed"; the payload "must be shorter than 8000 bytes" in the default setup, so send a row's key, not the row; and if the queue (8GB in a standard installation) fills, "transactions calling NOTIFY will fail at commit".
We ran it on a throwaway local Postgres 18.6 in Docker, with psycopg 3.3.9. The trigger:
CREATE OR REPLACE FUNCTION notify_order() RETURNS trigger AS $$
BEGIN
  PERFORM pg_notify('orders', NEW.order_id::text);   -- channel 'orders', payload = the new id
  RETURN NEW;
END $$ LANGUAGE plpgsql;
CREATE TRIGGER orders_notify AFTER INSERT ON orders FOR EACH ROW EXECUTE FUNCTION notify_order();
A second connection ran LISTEN orders and waited. Output:
PostgreSQL 18.6 | psycopg 3.3.9
insert order 1 (North, 680.28) -> listener got NOTIFY 'orders' payload '1' after 6.8 ms
insert order 2 (West, 190.68) -> listener got NOTIFY 'orders' payload '2' after 5.6 ms
insert order 3 (East, 95.6) -> listener got NOTIFY 'orders' payload '3' after 5.5 ms
insert order 4 (South, 903.73) -> listener got NOTIFY 'orders' payload '4' after 5.6 ms
insert order 5 (West, 42.1) -> listener got NOTIFY 'orders' payload '5' after 4.6 ms
notifications received: 5 of 5
From sending the insert to the listener hearing about it took under 7 ms on one laptop. The dashboard then re-runs its queries once per change instead of once per tick.
When you need every change itself, not just a signal, use logical decoding, which Postgres describes as "extracting all persistent changes to a database's tables into a coherent, easy to understand format". Change-data-capture tools such as Debezium read it; Debezium's Postgres connector "captures row-level changes" and by default sends each table's changes to its own Kafka topic. Reading our slot with the built-in test_decoding plugin:
changes read from the slot:
   BEGIN 779
   table public.orders: INSERT: order_id[integer]:6 region[text]:'North' revenue[numeric]:120.00
   COMMIT 779
   BEGIN 780
   table public.orders: UPDATE: order_id[integer]:6 region[text]:'North' revenue[numeric]:125.00
   COMMIT 780
WAL the unread slot is holding after 200,000 more inserts: 27 MB
slot dropped
The last lines are the catch. Postgres warns that replication slots "will prevent removal of required resources even when there is no connection using them", so "if a slot is no longer required it should be dropped". A dashboard pipeline that stops reading keeps the database's write-ahead log growing. Our guide to workflows that trigger on database changes goes further.
Connect any database. Ask in plain English.
Start free →3. A stream such as Kafka feeding a store
Kafka's docs describe its jobs as "To publish (write) and subscribe to (read) streams of events" and "To store streams of events durably and reliably for as long as you want". Events are not deleted when read; each topic keeps them for as long as its retention setting says, and "A common production setting is a replication factor of 3". A consumer turns the events into a table or a running total, and the dashboard reads that, or receives pushes.
It is the most to run: brokers, connectors and a store. We didn't build it here; our Kafka real-time dashboard guide does.
What refreshing too often costs on a warehouse that bills each query
BigQuery's on-demand price in the US is $6.25 per TiB after the first free TiB a month, with "a minimum 10 MB data processed per query" (checked 20 November 2026). The cache doesn't rescue a live dashboard: results aren't cached when a table the query reads has changed, has "recently received streaming inserts", or when the query uses CURRENT_TIMESTAMP() or CURRENT_DATE, as a "last 60 minutes" chart does. Our calculator, for an 8-chart dashboard on one screen open 10 hours a day for 22 days (example inputs):
python 3.14.3 | 8 charts, one screen open 10 h a day for 22 days, no cache hits, after the free 1 TiB
refresh every | queries/month | each query reads 10 MB (the minimum) | each query reads 1 GiB
    2 seconds |     3,168,000 |                      $        182.58 |        $     19,329.69
     1 minute |       105,600 |                      $          0.04 |        $        638.28
    5 minutes |        21,120 |                      $          0.00 |        $        122.66
   15 minutes |         7,040 |                      $          0.00 |        $         36.72
       1 hour |         1,760 |                      $          0.00 |        $          4.49
Even on tables small enough to bill the 10 MB minimum, a 2-second timer costs $182.58 a month for one screen, and a second viewer with its own timer doubles the queries. If each query reads 1 GiB, every 5 minutes costs $122.66 and every 2 seconds $19,329.69. Our BigQuery pricing guide has the full rules.
Snowflake bills differently but lands in the same place: "per-second billing (with a 60-second minimum each time the warehouse starts)", and an X-Small Gen1 standard warehouse uses 1 credit an hour (checked 20 November 2026). A timer shorter than the warehouse's auto-suspend time means it never suspends while the screen is open: 10 credits a day for 10 hours.
When every 5 minutes is enough
| If | Refresh |
|---|---|
| The data is loaded in batches, hourly or nightly | Just after each load: on change, or a timer matching the load. A shorter timer re-reads the same rows |
| People read the screen a few times a day | Every 5 to 60 minutes |
| Someone acts within minutes (an order or support queue) | Every minute, or on change |
| Someone acts within seconds (live operations) | Change notifications or a stream |
| The warehouse bills each query | 5 minutes or longer, or on change |
Ask what the reader does differently with a number that is 4 minutes fresher. If the answer is nothing, a 5-minute timer or refresh on change is the real-time dashboard.
When the real-time dashboard is for a team
Fastero is an AI and data platform where people and AI agents work together on a team's data. Its dashboards need no polling code:
- Refresh. A dashboard refreshes on a timer (1, 5, 15 or 60 minutes) or, for Postgres and BigQuery data only, when the data changes. On a dashboard that reads BigQuery or another warehouse that bills each query, the shortest timer is 5 minutes.
- Connect once. Postgres (Supabase and Neon connect as Postgres) or BigQuery, among others; each chart is a saved SQL query you can open and check.
- Viewers are free. Colleagues open the dashboard with their own login. The Free plan is $0 with no end date; Pro is $20 per editor a month (checked 20 November 2026).
- For people who won't open it. A scheduled email, daily, weekly or monthly, sends the numbers, charts and tables plus a PDF.
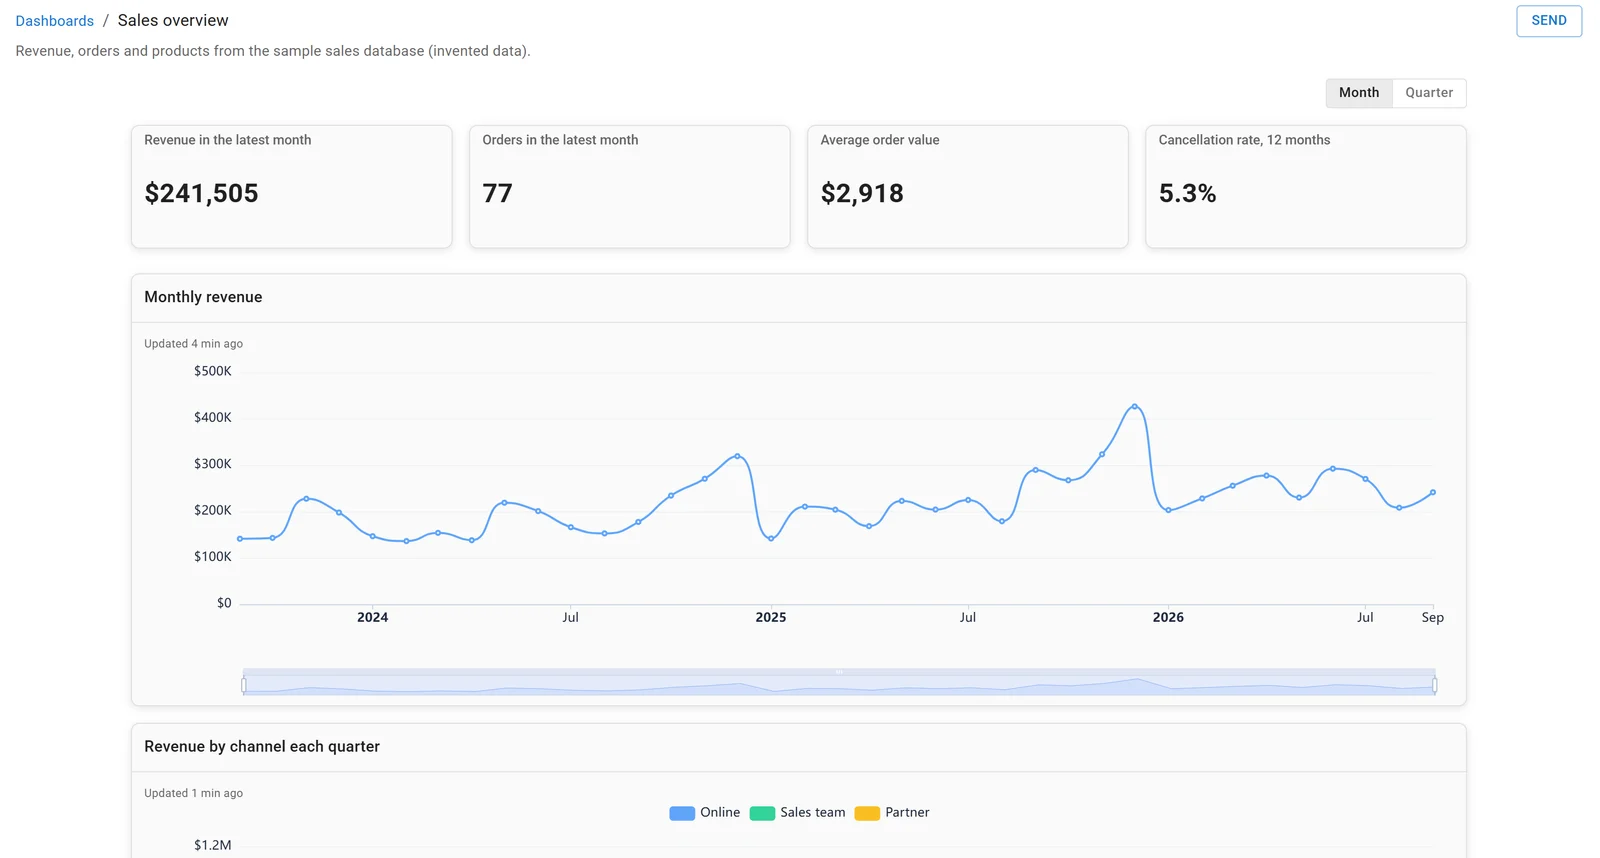
A dashboard in Fastero, built on the sample sales database. Invented data.
For building one from SQL, see live dashboards from any SQL query.
FAQ
What is a real-time dashboard?
A dashboard whose numbers update within seconds or minutes of the data changing, without anyone reloading the page. It does this by re-running its queries on a timer, by reacting when the database announces a change, or by reading a stream of events.
How do you build a real-time dashboard?
Start with a timer: in Streamlit, st.fragment(run_every=5) re-runs part of the page every 5 seconds. To query only when data changes, send NOTIFY from a Postgres trigger and LISTEN for it. To keep the dashboard off the source database, stream events through Kafka into a store.
What is the difference between real time and near real time?
Real time usually means seconds or less between an event and the screen; near real time allows a short delay. No standard fixes the line, so state the delay in seconds or minutes instead.
How often should a dashboard refresh?
As often as someone acts on the change. Data loaded hourly needs refreshing once an hour, after the load; a screen read a few times a day is fine at 5 to 60 minutes; an operations queue may need every minute or a change notification.
Can Streamlit make a real-time dashboard?
Yes. A fragment with run_every re-runs on that interval "while the session is active", redrawing only that part of the page. Each open tab runs its own timer, so cache shared queries with st.cache_data(ttl=...): in our test it cut three tabs from 90 database reads a minute to 5.
Does PostgreSQL support real-time notifications?
Yes: LISTEN and NOTIFY. A trigger calls pg_notify when rows change, and every connection listening on that channel is told after the transaction commits. Payloads must be under 8000 bytes by default, so send the row's id and let the dashboard re-query.
Sources
Read on 20 November 2026. The dashboard, the measurements, the Postgres test and the calculator ran that day in Python 3.14.3 venvs, on invented orders.
- Streamlit 1.67.0: st.fragment, Fragments, st.cache_data
- PostgreSQL 19 docs: NOTIFY, LISTEN, Logical replication, Logical decoding concepts; the test ran on PostgreSQL 18.6
- Debezium PostgreSQL connector, Apache Kafka introduction
- SQLite: Write-ahead logging, PRAGMA data_version; DuckDB: Concurrency
- Google Cloud: BigQuery pricing, Cached query results; Snowflake: Overview of warehouses
Try Fastero free: connect Postgres or BigQuery, build a dashboard, and set it to refresh on a timer or when the data changes. No credit card required.