 Fastero Dev Team
This tutorial builds one app, a sales dashboard over a CSV of 4,734 invented orders, in five steps. Each step is a complete file you can run. We ran every one on Streamlit 1.67.0 (released 5 November 2026) with Python 3.14 on 20 November 2026, and the screenshots are those runs.
The short answer: install Streamlit with pip install streamlit in a virtual environment (the docs support Python 3.11 to 3.15), write a Python script, and start it with streamlit run app.py. Streamlit reruns the whole script from top to bottom every time someone changes a widget, so a first app is ordinary pandas code plus a few calls: st.title, st.metric inside st.columns, st.dataframe, st.line_chart, and widgets inside with st.sidebar:. Put @st.cache_data on the function that loads your data so reruns don't reload it, split pages with st.Page and st.navigation, keep passwords in .streamlit/secrets.toml, and test the app with AppTest. Community Cloud hosts public apps for free.
Fastero
Host your Streamlit app for your team.
Deploy from GitHub with your team's login and secrets built in — no Docker, no auth proxy.
Try free →Install Streamlit and run a script
Streamlit's install guide uses venv and pip. These are its commands:
python -m venv .venv

# Windows PowerShell
.venv\Scripts\Activate.ps1
# macOS and Linux
source .venv/bin/activate

pip install streamlit
streamlit hello
streamlit hello opens a demo app to prove the install worked. Then start your own script. Ours, with the port set because we ran several apps at once (the default is 8501):
$ streamlit version
Streamlit, version 1.67.0

$ streamlit run step1_table.py --server.port 8641
2026-11-20 02:56:20.441 Uvicorn server started on :::8641

  You can now view your Streamlit app in your browser.

  Local URL: http://localhost:8641
(Network addresses trimmed.) When you save the file, Streamlit notices and offers to rerun; choose "Always rerun" and the browser follows every save.
How a Streamlit app runs
The one idea to understand: "Streamlit reruns your entire Python script from top to bottom" whenever the source changes and whenever someone uses a widget, such as dragging a slider or picking from a list. The widget's new value is simply what its function returns on that run.
Two things follow, and both appear in the steps below:
- Ordinary variables start again on every run. Anything that must survive a click goes in Session State; our Streamlit session state guide covers it with three tested apps.
- Slow work runs again on every run, unless you cache it (step 4).
Step 1: show the data as a table
import pandas as pd
import streamlit as st

st.title("Sales")

sales = pd.read_csv("sample-sales.csv", parse_dates=["order_date"])
st.write(f"{len(sales):,} orders (invented data)")
st.dataframe(sales, hide_index=True)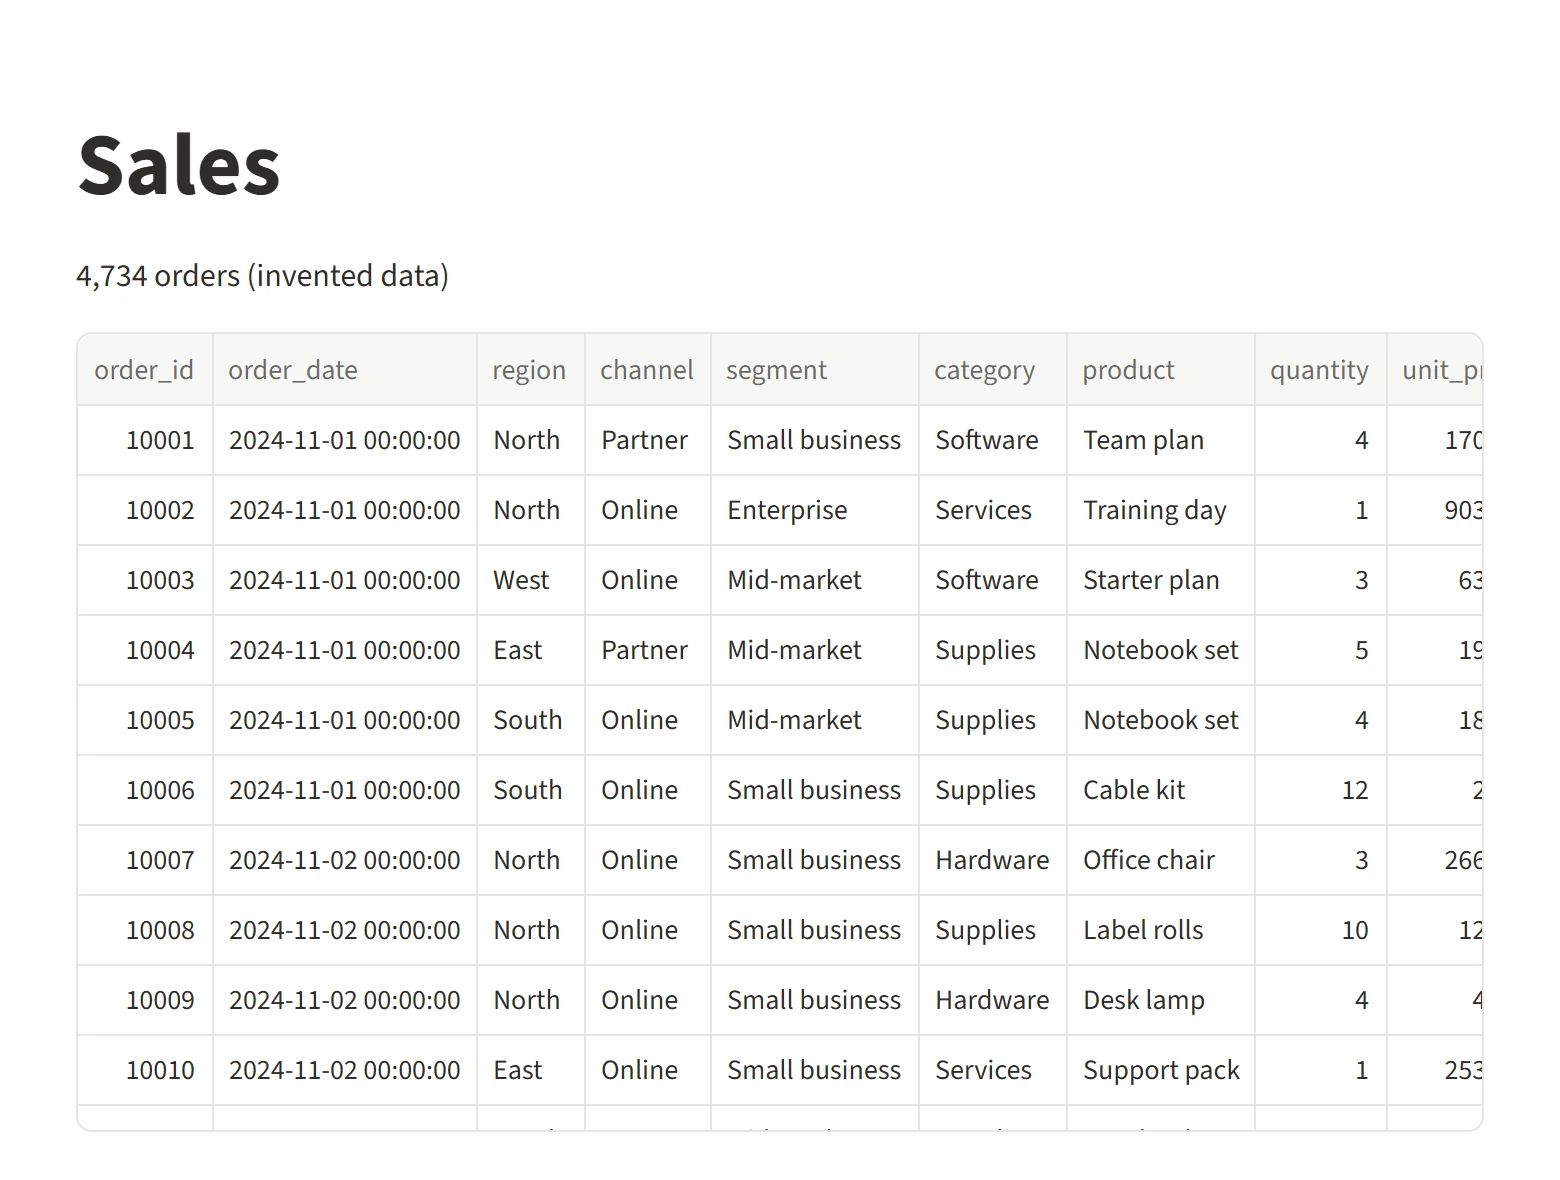
Step 1: six lines of code give you an interactive table. Invented data, Streamlit 1.67.0.
st.dataframe draws an interactive table; st.table would draw a static one. st.write takes almost anything, text, DataFrames or charts, and picks how to show it.
Step 2: add metrics and a chart
Replace the st.write line with three headline numbers and a monthly trend:
st.set_page_config(page_title="Sales", layout="wide")  # first, right after the imports

monthly = sales.resample("MS", on="order_date").revenue.sum()
this, last = monthly.iloc[-1], monthly.iloc[-2]

a, b, c = st.columns(3)
a.metric("Revenue, latest month", f"${this:,.0f}", f"{this / last - 1:+.1%}")
b.metric("Orders", f"{len(sales):,}")
c.metric("Average order", f"${sales.revenue.mean():,.2f}")

st.line_chart(monthly, y_label="Revenue ($)")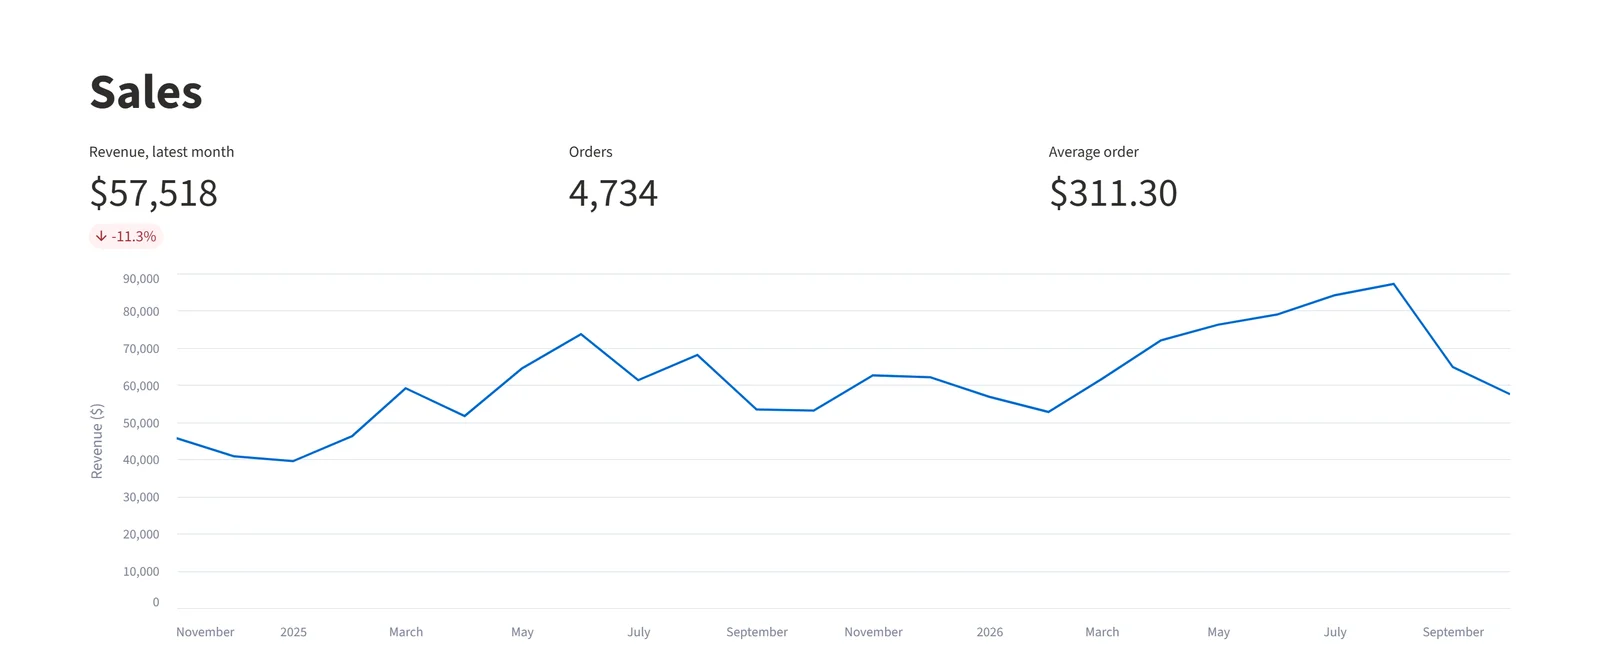
Step 2: st.metric draws the change arrow and colour from the third argument. Invented data.
st.columns(3) returns three containers side by side. The third argument to st.metric is the change: a negative value turns it red with a down arrow.
Step 3: put filters in the sidebar
Everything inside with st.sidebar: goes in the panel on the left. Add this after the CSV is read; the metrics and chart from step 2 stay below it and now use the filtered rows:
with st.sidebar:
    st.header("Filters")
    all_regions = sorted(sales.region.unique())
    regions = st.multiselect("Region", all_regions, default=all_regions)
    category = st.selectbox("Category", ["All"] + sorted(sales.category.unique()))

sales = sales[sales.region.isin(regions)]
if category != "All":
    sales = sales[sales.category == category]
if sales.empty:
    st.warning("No orders match these filters.")
    st.stop()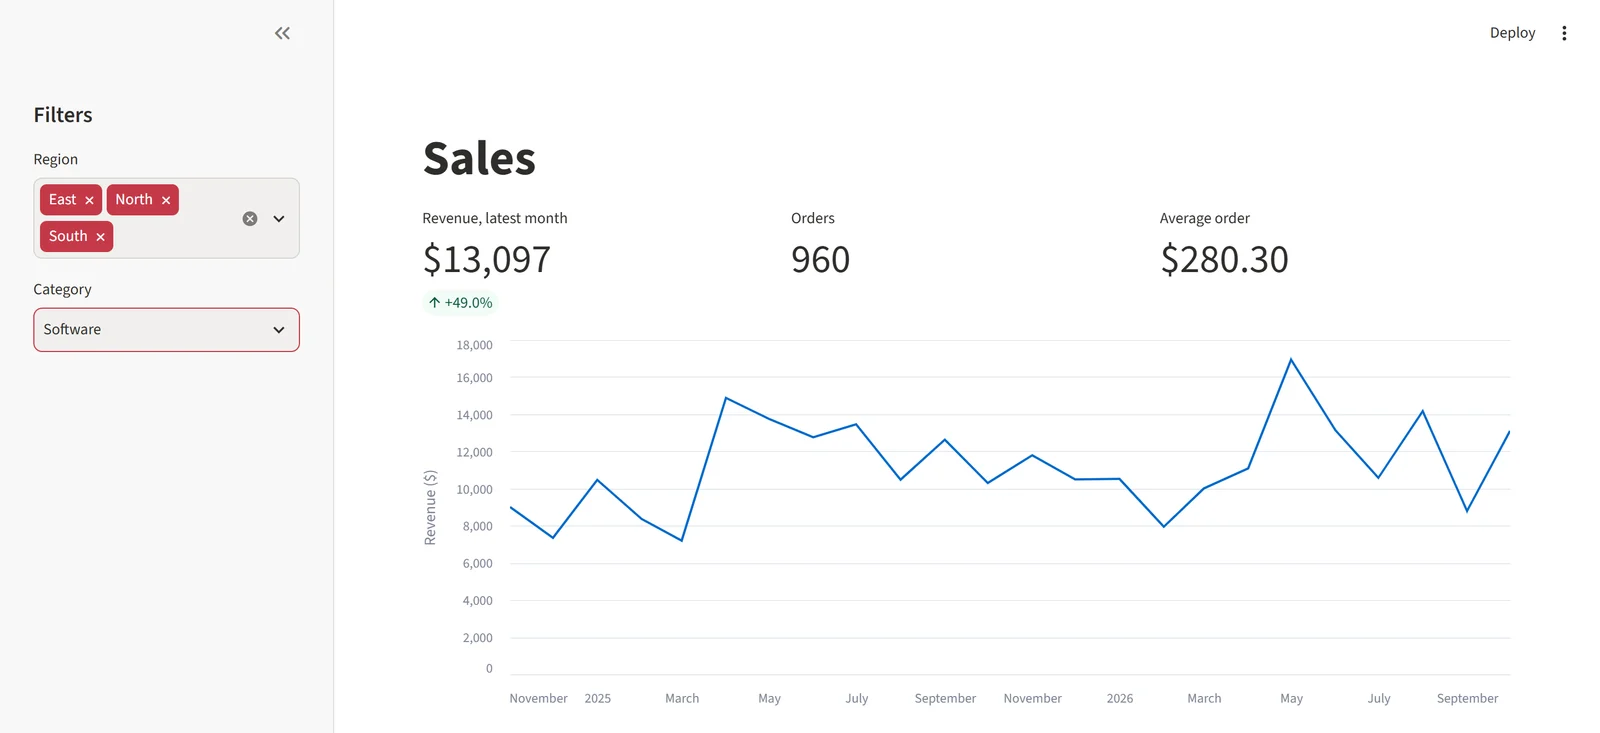
Step 3: removing West and choosing Software reruns the script, and every number follows. Invented data.
Remove a region and the whole script runs again with the new list. The st.stop() guard matters: we took it out, cleared every region, and the app showed IndexError: single positional indexer is out-of-bounds, because there was no month left for monthly.iloc[-1].
Step 4: cache the data load
Every click so far rereads the CSV. Move the read into a function and decorate it:
@st.cache_data
def load_sales(path):
    return pd.read_csv(path, parse_dates=["order_date"])

sales = load_sales("sample-sales.csv")
Streamlit keys the cache on the function's code and its arguments, so the file is read once and later runs get the stored result. We measured the load on 21 script runs with each version, driven by AppTest, on the sample file and on a copy repeated 50 times:
Python 3.14.3, Streamlit 1.67.0, pandas 3.1.1, Windows 11
sample-sales.csv: 4,734 rows, 21 script runs
  without cache, median of 21 loads: 9.0 ms
  st.cache_data, first load (miss):    10.9 ms
  st.cache_data, median of 20 hits:   1.28 ms
sample-sales-x50.csv: 236,700 rows, 21 script runs
  without cache, median of 21 loads: 253.9 ms
  st.cache_data, first load (miss):    493.9 ms
  st.cache_data, median of 20 hits:   16.84 ms
A second run gave 8.1 ms against 1.32 ms, and 242.7 ms against 15.58 ms. In the running app, with the load time printed in the sidebar, the first load after starting the server took 27.2 ms and the next click 1.8 ms:
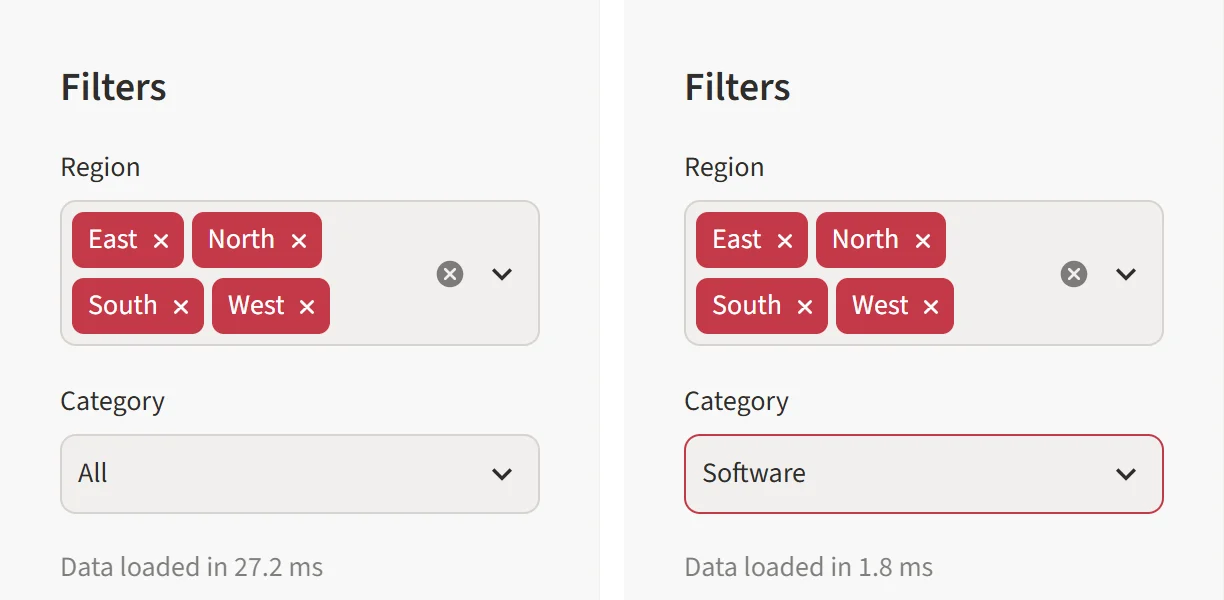
Step 4: the first load reads the file; the next click gets the cached copy. Invented data, Streamlit 1.67.0.
What the numbers show:
- A hit isn't free:
st.cache_data"creates a new copy of the data at each function call", so the big file still cost 17 ms. That copy is what stops one viewer's edits leaking into another's. - The first load can be slower than no cache, 494 ms against 254 ms on the big file, because the result is serialized for storage.
- The cache is shared: "By default, cached values are available to all users of your app", so only the first visitor after a restart pays for the read.
For a database or an API, add a time limit, @st.cache_data(ttl=600), so the app picks up new rows; the docs say you "should always set a ttl" there.
Step 5: add a second page
Streamlit recommends st.Page and st.navigation for multipage apps and calls the older pages/ folder "a legacy mechanism". The entrypoint, the file you pass to streamlit run, becomes a router:
app/
├── streamlit_app.py   # entrypoint: page setup and navigation
├── data.py            # the cached loader, shared by both pages
├── overview.py        # the code from steps 1 to 4, minus set_page_config
├── products.py
└── sample-sales.csv
# streamlit_app.py
import streamlit as st
st.set_page_config(page_title="Sales", layout="wide")
pg = st.navigation([
st.Page("overview.py", title="Overview", icon=":material/monitoring:", default=True),
st.Page("products.py", title="Products", icon=":material/inventory_2:"),
])
pg.run()# data.py
from pathlib import Path
import pandas as pd
import streamlit as st
CSV = Path(__file__).parent / "sample-sales.csv"
@st.cache_data
def load_sales():
return pd.read_csv(CSV, parse_dates=["order_date"])# products.py
import streamlit as st
from data import load_sales
st.title("Products")
sales = load_sales()
top = (
sales.groupby("product", as_index=False)
.agg(orders=("order_id", "count"), units=("quantity", "sum"), revenue=("revenue", "sum"))
.sort_values("revenue", ascending=False)
)
st.bar_chart(top, x="product", y="revenue", horizontal=True, sort="-revenue", x_label="", y_label="Revenue ($)")
st.dataframe(top, hide_index=True, column_config={"revenue": st.column_config.NumberColumn("revenue", format="dollar")})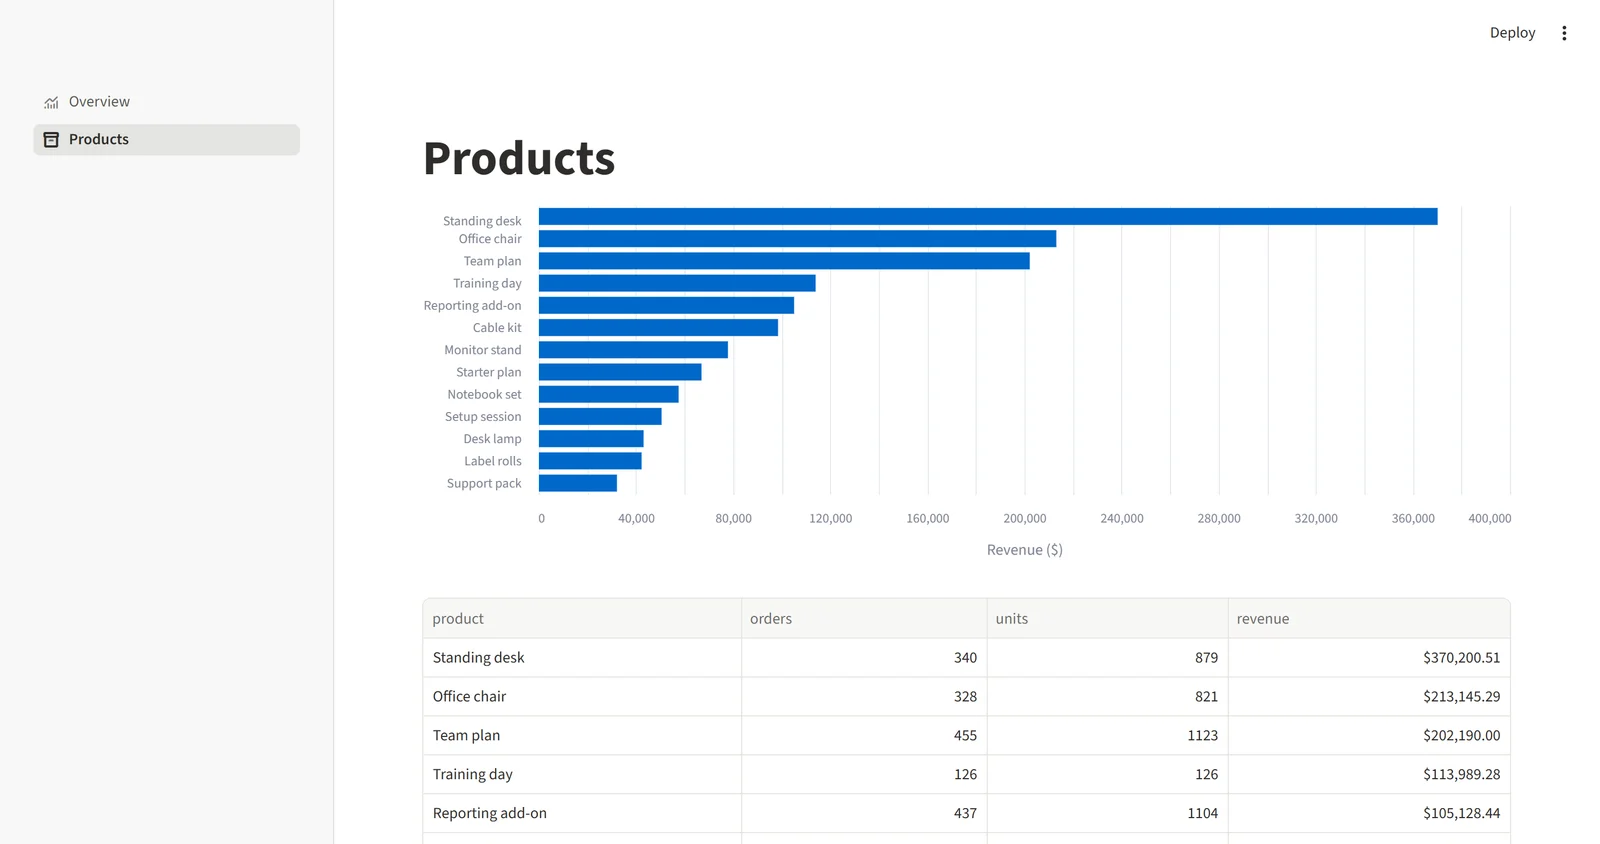
Step 5: a second page from st.Page and st.navigation. Invented data.
st.navigation can be called "once per app run" and only from the entrypoint. Imports such as from data import load_sales resolve from the app's folder, as they do under streamlit run. One thing you'll notice: pick a region on Overview, open Products, come back, and the filter has reset. Widgets belong to their page; the session state guide shows how to keep the choice.
Host your Streamlit app for your team.
Start free →Keep passwords out of the code
Put credentials in .streamlit/secrets.toml next to the app. "Add this file to your .gitignore", the docs warn. Their example:
db_username = "Jane"
db_password = "mypassword"st.write("DB username:", st.secrets["db_username"])Top-level keys also become environment variables. Each host takes secrets its own way: on Community Cloud you paste the file's contents into the app's settings. For a database, st.connection reads its settings from the same file; example 7 in our Streamlit dashboard examples uses it.
Test the app with AppTest
streamlit.testing.v1.AppTest runs the app without a browser: you set widget values, rerun, and check what it drew. Our tests for the finished app, in tests/test_app.py:
from streamlit.testing.v1 import AppTest

APP = "../app/streamlit_app.py"

def test_overview_shows_all_orders():
    at = AppTest.from_file(APP, default_timeout=10).run()
    assert not at.exception
    assert at.metric[1].value == "4,734"

def test_region_filter_narrows_orders():
    at = AppTest.from_file(APP, default_timeout=10).run()
    at.sidebar.multiselect[0].set_value(["West"]).run()
    assert at.metric[1].value == "1,371"

def test_no_region_shows_warning_not_error():
    at = AppTest.from_file(APP, default_timeout=10).run()
    at.sidebar.multiselect[0].set_value([]).run()
    assert not at.exception
    assert at.warning[0].value == "No orders match these filters."

def test_products_page_lists_13_products():
    at = AppTest.from_file(APP, default_timeout=10).run()
    at.switch_page("products.py").run()
    assert at.title[0].value == "Products"
    assert len(at.dataframe[0].value) == 13
$ python -m pytest tests/ -v -p no:cacheprovider
============================= test session starts =============================
platform win32 -- Python 3.14.3, pytest-9.2.0, pluggy-1.7.0 -- (path trimmed)
rootdir: (path trimmed)
plugins: anyio-4.16.0
collecting ... collected 4 items
tests/test_app.py::test_overview_shows_all_orders PASSED [ 25%]
tests/test_app.py::test_region_filter_narrows_orders PASSED [ 50%]
tests/test_app.py::test_no_region_shows_warning_not_error PASSED [ 75%]
tests/test_app.py::test_products_page_lists_13_products PASSED [100%]
============================== 4 passed in 5.71s ==============================Our first run failed: RuntimeError: AppTest script run timed out after 3(s). The default timeout is 3 seconds, and the first test in a fresh process is the slow one, most likely because it imports pandas and reads the file. default_timeout=10 fixed it. Note too that a relative path in from_file is resolved from the test file, not from where you run pytest, and that switch_page takes the page's path relative to the entrypoint.
Where you can share a Streamlit app
| Option | What Streamlit's docs say | Good for |
|---|---|---|
| Streamlit Community Cloud | Free; deploys from GitHub; one private app at a time; apps sleep after 12 hours without traffic; 690 MB to 2.7 GB of memory "as of February 2024" | Public demos, personal and educational apps |
| Streamlit in Snowflake | Apps run inside Snowflake under its access controls | Companies whose data is in Snowflake |
| Docker or Kubernetes | Official guides for both; Streamlit runs "as one Python process with no build step" | Your own servers or cloud account |
| Other platforms | Tutorials linked from the docs for Google Cloud Run, Heroku, Koyeb and others | Teams already on one of them |
Our guide to deploying a Streamlit app walks through Community Cloud and a Docker image step by step, and why your Streamlit app keeps sleeping covers the 12-hour rule. A self-hosted app is public until you add sign-in; Streamlit login shows six ways.
When the app is for your team
Community Cloud suits a public demo. An app colleagues open every day on company data needs their login, the database password kept out of the repository, and somewhere it runs. Fastero, an AI and data platform where people and AI agents work together on a team's data, hosts Streamlit apps for that:
- Behind your workspace's login on every plan: colleagues sign in to open it; viewers are free.
- Import from your repo: paste the repository address and branch; private repositories take an access token.
st.secretsworks: secrets you add in the workspace are written to the app's.streamlit/secrets.toml, so code that readsst.secretsruns unchanged.- On the Free plan an app starts when someone opens it and sleeps after 10 idle minutes. Always-on is a Pro feature ($20 per editor a month, checked 20 November 2026) and isn't part of the 14-day Pro trial.
- Every app gets 1 CPU and 2 GB of memory.
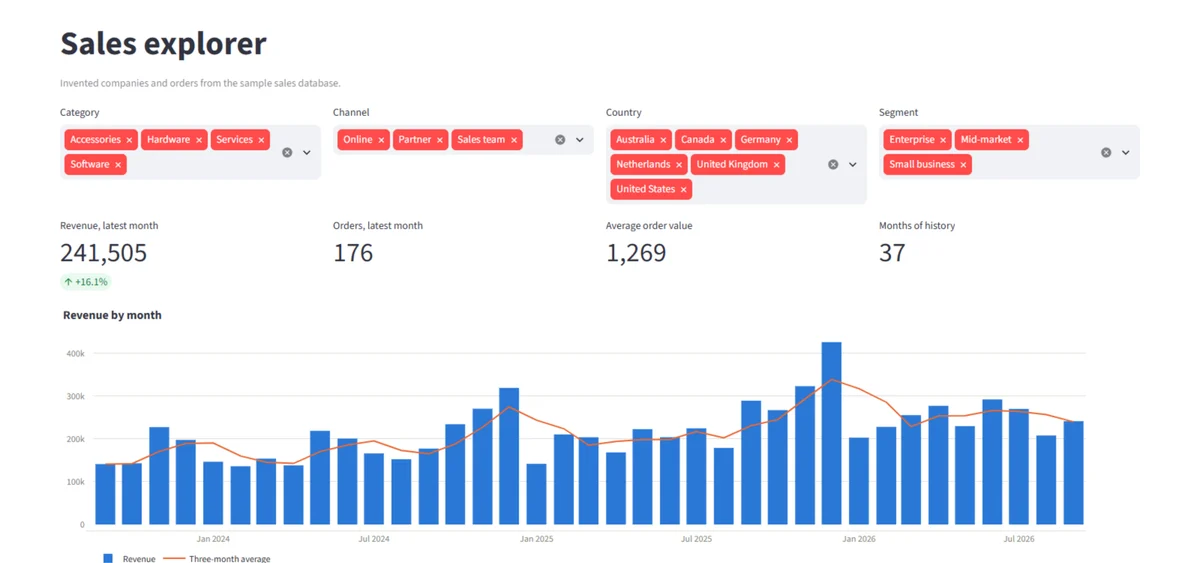
A Streamlit app hosted in Fastero. Invented data.
FAQ
Is Streamlit free?
Yes. Streamlit is open source under the Apache 2.0 licence and installs with pip install streamlit. Streamlit Community Cloud hosts public apps for free and allows one private app at a time.
What Python version does Streamlit need?
Streamlit's install guide supports Python 3.11 to 3.15, and version 1.67.0 on PyPI requires 3.11 or newer. We ran this tutorial on Python 3.14.3.
How do I run a Streamlit app?
Run streamlit run app.py in a terminal where Streamlit is installed, or python -m streamlit run app.py. The app opens in your browser on port 8501 unless you set --server.port, and stops when you press Ctrl+C.
Why does Streamlit rerun my whole script?
That's how Streamlit works: when you change a widget or save the file, it runs the script again from top to bottom with the new values. Cache slow functions with @st.cache_data and keep values that must survive a click in st.session_state.
How do I make a multipage Streamlit app?
Define each page with st.Page("page.py"), pass the list to st.navigation in your entrypoint file, and call .run() on what it returns. The older pages/ folder still works, but Streamlit now calls it legacy.
How do I deploy a Streamlit app for free?
Push the app and a requirements.txt to a GitHub repository and deploy it from Streamlit Community Cloud. Public apps are free; you get one private app, and apps sleep after 12 hours without a visitor.
Sources
Read on 20 November 2026, against Streamlit 1.67.0:
- Streamlit docs: Install using the command line, Basic concepts, Advanced concepts, Caching overview, st.cache_data
- Multipage apps overview, st.Page and st.navigation, Secrets management
- Get started with app testing, AppTest API, st.metric, st.bar_chart
- Deployment: Deploy, Deployment tutorials, Community Cloud: manage your app, Share your app, Docker
- Release notes, Streamlit on PyPI, Fastero pricing
Try Fastero free: run your Streamlit app behind your team's login, with secrets built in. No credit card required.