 Fastero Dev Team
NiceGUI and Streamlit both turn a Python file into a web app with no JavaScript. Most comparisons describe them in general terms and build a different demo in each. We built the same small dashboard in both, on the same data, and timed them.
The short answer: NiceGUI and Streamlit both turn Python into a web app, and since Streamlit 1.57 (April 2026) both run on Starlette and Uvicorn. The real difference is how the page updates. Streamlit reruns your whole script on every interaction (fragments and the new on_change="ignore" narrow that). NiceGUI builds the page once and runs only the Python function tied to each event. Our same sales dashboard took 20 lines in Streamlit and 27 in NiceGUI, and both were on screen in about three seconds. Pick Streamlit for the quickest data app and free hosting; pick NiceGUI for app-like interfaces with explicit events and state.
Fastero
Host your Streamlit app for your team.
Deploy from GitHub with your team's login and secrets built in — no Docker, no auth proxy.
Try free →The same dashboard in both
On 11 November 2026 we installed the current versions, NiceGUI 4.0.0 and Streamlit 1.67.0 with pandas 3.1.1, in a fresh Python 3.14 environment on a Windows 11 laptop. Both support 3.14, and both now need Python 3.11 or later. The app reads a file of invented orders and shows a region filter, total revenue, revenue by month and the rows as a table. Both showed $417,482 for the North region, matching pandas.
Streamlit: 20 lines
import pandas as pd
import streamlit as st


@st.cache_data
def load():
    return pd.read_csv("sample-sales.csv")


st.set_page_config(page_title="Sales dashboard", layout="wide")
df = load()

st.title("Sales dashboard")
region = st.selectbox("Region", ["All", *sorted(df["region"].unique())])
view = df if region == "All" else df[df["region"] == region]

st.metric("Revenue", f"${view['revenue'].sum():,.0f}")
monthly = view.groupby(view["order_date"].str[:7])["revenue"].sum()
st.bar_chart(monthly, x_label="Month", y_label="Revenue")
st.dataframe(view, hide_index=True)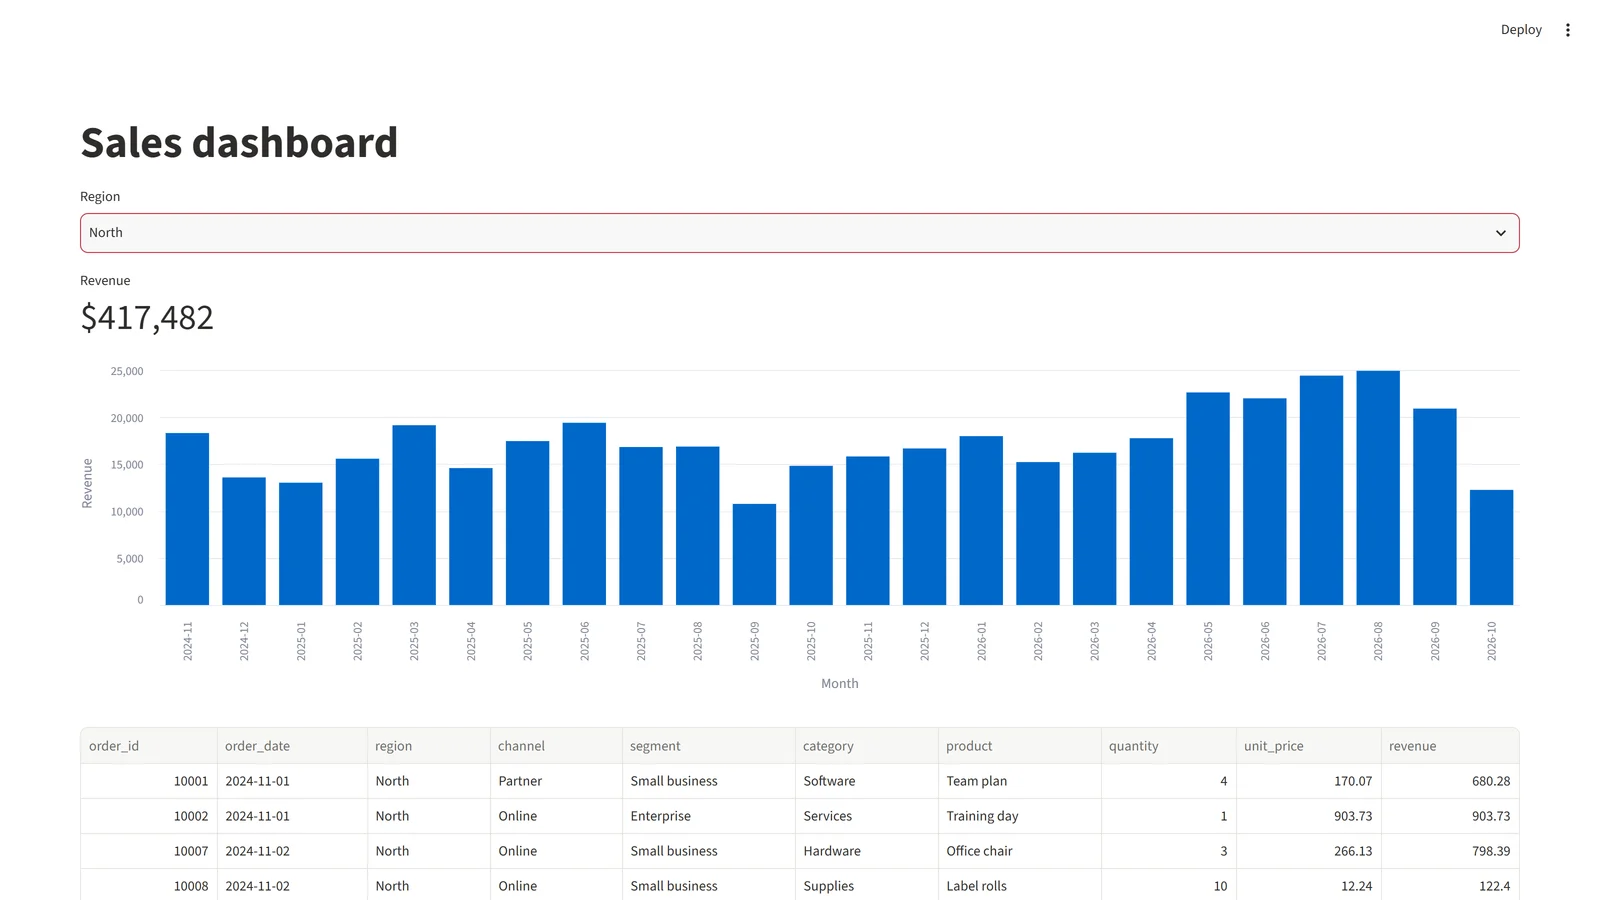
The Streamlit app, North selected. Invented data.
NiceGUI: 27 lines
import pandas as pd
from nicegui import ui

df = pd.read_csv("sample-sales.csv")


def root():
    ui.label("Sales dashboard").classes("text-3xl font-bold")
    region = ui.select(["All", *sorted(df["region"].unique())], value="All", label="Region",
                       on_change=lambda: dashboard.refresh()).classes("w-48")

    @ui.refreshable
    def dashboard():
        view = df if region.value == "All" else df[df["region"] == region.value]
        ui.label(f"Revenue: ${view['revenue'].sum():,.0f}").classes("text-2xl")
        monthly = view.groupby(view["order_date"].str[:7])["revenue"].sum().round(2)
        ui.echart({
            "xAxis": {"type": "category", "data": list(monthly.index), "name": "Month"},
            "yAxis": {"type": "value", "name": "Revenue"},
            "series": [{"type": "bar", "data": list(monthly.values)}],
        }).classes("w-full h-80")
        ui.table.from_pandas(view.reset_index(drop=True), row_key="order_id", pagination=10).classes("w-full")

    dashboard()


ui.run(root, port=8602, title="Sales dashboard", show=False, reload=False)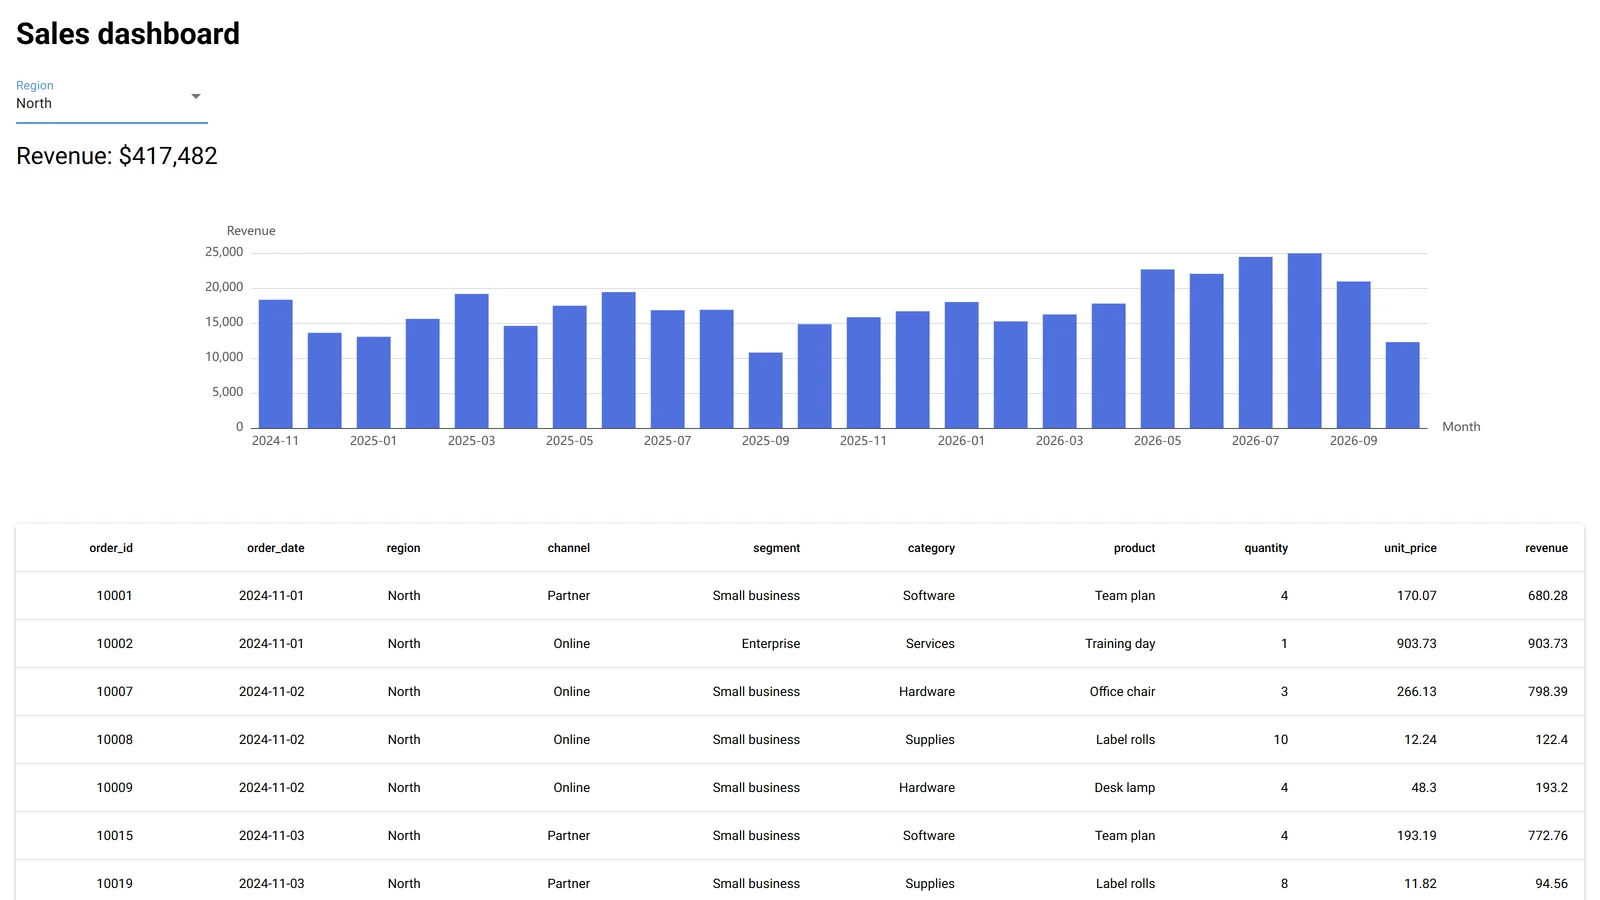
The NiceGUI app, the same data and filter.
Most of NiceGUI's extra lines are the chart's options and the explicit wiring of the filter to the part of the page it refreshes. Streamlit wires nothing: changing the filter reruns the script, and the script redraws everything.
What we measured
Medians of five warm runs each, one browser tab, on a laptop. Treat them as a comparison, not a benchmark.
| Streamlit 1.67.0 | NiceGUI 4.0.0 | |
|---|---|---|
| Start the process to dashboard on screen | 3.35 s | 2.93 s |
| Server answers its first request | 1.26 s | 2.12 s |
| Open the page to the revenue number showing | 1.74 s | 0.69 s |
| Change the region to the new number | 179 ms | 117 ms |
| First page load | 138 requests, about 5.3 MB | 22 requests, about 1.0 MB |
| Memory, server with one tab open | about 189 MB | about 160 MB |
Streamlit answers sooner because it serves a static page and runs your script only once the browser connects. NiceGUI builds the page in Python when it's requested, so it answers later but arrives with the content. The very first Streamlit start after installing took 11.7 seconds, while Python compiled the new packages.
Host your Streamlit app for your team.
Start free →How each runs your code
We added a print line to every block and watched what ran.
- Streamlit ran the script top to bottom when the page opened, again when the region changed, and again for a second browser tab. That's by design: "when something must be updated on the screen, Streamlit reruns your entire Python script from top to bottom", and "For each browser tab that connects to the Streamlit server, a new session is created." The CSV was read only once because of
@st.cache_data; without it, every click re-reads the file. - NiceGUI loaded the CSV once at start, built the page once per visit, and on a region change re-ran only the
@ui.refreshableblock, which "will automatically delete all elements created by the function and recreate them." Everything else stayed put. "All UI events are sent to backend and invoke Python functions, which can then generate UI updates".
Streamlit has spent 2026 adding ways to rerun less: fragments, which "allow rerunning a portion of your code instead of your full script", gained parallel=True in May, and since 1.63 (September) on_change="ignore" "updates a widget in the browser without rerunning your app."
State
In Streamlit, "Each full-script rerun starts with a blank slate for regular Python variables, but values stored in Session State persist", per tab, and st.cache_data shares data across sessions. In NiceGUI, objects live as long as the page, and app.storage "features five built-in storage types", from per tab to per user. The classic NiceGUI bug is the opposite of Streamlit's: "Module-level state is shared across ALL users", so load shared data there, as we did with the CSV, and keep anything per-visitor inside the page function.
Two gotchas we hit
- NiceGUI's table showed an extra column after filtering. Since 3.12, "Any DataFrame index other than an unnamed RangeIndex is auto-included as column(s)."
reset_index(drop=True)fixes it. - NiceGUI opens a browser and a reloader by default (
show=True,reload=True); turn both off on a server.
Deployment and login
| Streamlit | NiceGUI | |
|---|---|---|
| Free hosting from the makers | Community Cloud: free, from GitHub, "one private app at a time", apps sleep after 12 hours without traffic | None. On Air, a free tech preview, gives a temporary public URL "valid for 1 hour" |
| Self-hosting | Any server; behind several replicas it needs session affinity | Any server, or "our pre-built multi-arch Docker image"; one worker per app, with "additional steps required to allow multiple workers" |
| Inside an existing app | st.App exposes the server (since 1.57) |
Mounts into a FastAPI app with ui.run_with |
| Desktop app | No | Yes: a native window, or packaged with nicegui-pack |
| Login | Built in: "Streamlit supports user authentication with OpenID Connect (OIDC)" since 1.42 | None built in; the official example is "just a simple authentication example" |
| Licence | Apache 2.0 | MIT |
What changed in 2025 and 2026
- February 2025, Streamlit 1.42: "st.login() and st.logout() to authenticate users with any OpenID Connect provider."
- October 2025, NiceGUI 3.0: "script mode" and a
rootpage parameter for single-page apps. - April 2026, Streamlit 1.57: "Streamlit now uses Starlette/Uvicorn instead of Tornado", the same stack NiceGUI uses through FastAPI.
- September 2026, Streamlit 1.63 and 1.64:
on_change="ignore", andst.echarts_chart, the chart library NiceGUI'sui.echartuses. - October 2026, Streamlit 1.66: Python 3.10 dropped.
- 4 November 2026, NiceGUI 4.0: "a major release focused on cleaning up", with about 14% less memory per connected client.
- 5 November 2026, Streamlit 1.67: an experimental option lets "AI agents and other programs" use your app "over HTTP or through an MCP endpoint".
The older framing, that Streamlit runs on Tornado without a login while NiceGUI is FastAPI, is out of date. The difference that remains is reruns against event handlers.
Which to pick
Pick Streamlit when the app is a data view: filters, charts and tables over a dataset, built quickly by someone who thinks in scripts. It has free hosting, a login built in, and the larger set of examples and components. Streamlit says it will "Turn your data scripts into shareable web apps in minutes."
Pick NiceGUI when the app behaves like an application: many controls with their own state, pages that update in pieces, real-time updates, a desktop window or a device's control panel. Its makers say "It is great for micro web apps, dashboards, robotics projects, smart home solutions and similar use cases", and they built it because they found Streamlit does too much magic "when it comes to state handling".
Hosting a Streamlit app for your team
If you chose Streamlit, the next problem is where it runs. Community Cloud allows one private app at a time and puts idle apps to sleep, and a team app usually needs a sign-in, secrets kept out of the code, and access to the company's database.
Fastero is an AI and data platform where people and AI agents work together on a team's data, and it hosts Streamlit apps behind your team's sign-in, next to the workspace's database connections and secrets. Fastero runs Streamlit, not NiceGUI. More on where to host a Streamlit app, Streamlit vs Dash, Streamlit vs Gradio and eight Streamlit dashboard examples.
FAQ
Is NiceGUI faster than Streamlit?
In our test, slightly: both started in about three seconds, NiceGUI answered a filter change in 117 ms against Streamlit's 179 ms, and its first page load was about 1 MB against 5 MB. For a dashboard that's rarely what decides it.
Does NiceGUI rerun the script like Streamlit?
No. NiceGUI builds the page once and calls the Python function tied to each event; a @ui.refreshable function rebuilds only its own block. Streamlit reruns the whole script on each interaction, unless you use fragments or on_change="ignore".
Is NiceGUI better than Streamlit for dashboards?
For a simple data dashboard, Streamlit is quicker to write: 20 lines against 27 in our test. NiceGUI is better when the dashboard has many interacting controls, or needs to update parts of the page independently.
Can I deploy NiceGUI on Streamlit Community Cloud?
No: Community Cloud deploys Streamlit apps. NiceGUI runs on any server, in its official Docker image, or temporarily through its free On Air preview.
Does NiceGUI have authentication?
Not built in. NiceGUI's documentation gives "just a simple authentication example" using middleware and per-user storage. Streamlit has had built-in OpenID Connect login since version 1.42.
Do I need JavaScript for either?
No. Both are written entirely in Python. NiceGUI renders Vue and Quasar components for you; Streamlit renders its own React front end.
Sources
Read on 11 November 2026; our test used NiceGUI 4.0.0, Streamlit 1.67.0 and pandas 3.1.1 on Python 3.14.3, Windows 11:
- NiceGUI: README, nicegui.io, Storage, Refreshable, Configuration and deployment, authentication example, releases, PyPI, llms.txt
- Streamlit: Architecture, Main concepts, Session State, Fragments, Authentication, Community Cloud, Share your app, Manage your app, release notes for 2025 and 2026, PyPI