 Fastero Dev Team
An executive dashboard is the screen a leader opens to decide which team to call. It holds fewer numbers than a team's own dashboard, and each one needs something beside it to compare with. Below are eight examples, all real Fastero dashboards on invented data, with the numbers read first and the trap in each.
The short answer: an executive dashboard shows four to six headline numbers, each against last period or a target, then one trend and the breakdown that explains it. The company overview takes one number from each team: recurring revenue, net revenue retention, new customers and cash runway. Revenue, pipeline, finance, support, marketing and data-platform screens each go one level down. Most mislead in a predictable way: a monthly arrow in a seasonal business, an ARR that counts one-off fees, a pipeline judged by the 3x rule, runway worked out from a single month.
Fastero
Connect your database. Ask questions. Get dashboards.
Postgres, BigQuery, Snowflake, and 10+ sources — live-connected, AI-powered, no dashboard builder learning curve.
Try free →Executive dashboard examples at a glance
| Dashboard | Read first | The trap |
|---|---|---|
| Company overview | MRR, net revenue retention, new customers, cash runway | NRR shown without its window |
| Subscription revenue | MRR, net new MRR, customer churn, MRR per customer | ARR that includes one-off fees |
| Sales pipeline | Won this month, win rate, pipeline coverage, days to close | Judging coverage by the 3x rule |
| Finance | Cash, net burn, runway, gross margin, spend against budget | Runway from gross burn or one month |
| Customer support | Tickets, median first reply, median time to solve, share rated good | Averages for waiting times |
| Marketing | Signups, new customers, cost per new customer, visit-to-signup rate | Blended CAC hiding paid channels |
| Data platform | Tables on time, failed runs, warehouse spend, tests passing | Counting only the tables someone set a check on |
| Sales and orders | Revenue, orders, average order value, revenue by channel | Month-on-month arrows in a seasonal business |
Formulas for every number are in our KPI dashboard examples and 30 KPI examples; this post is about what a leader reads first and where it goes wrong.
1. Company overview
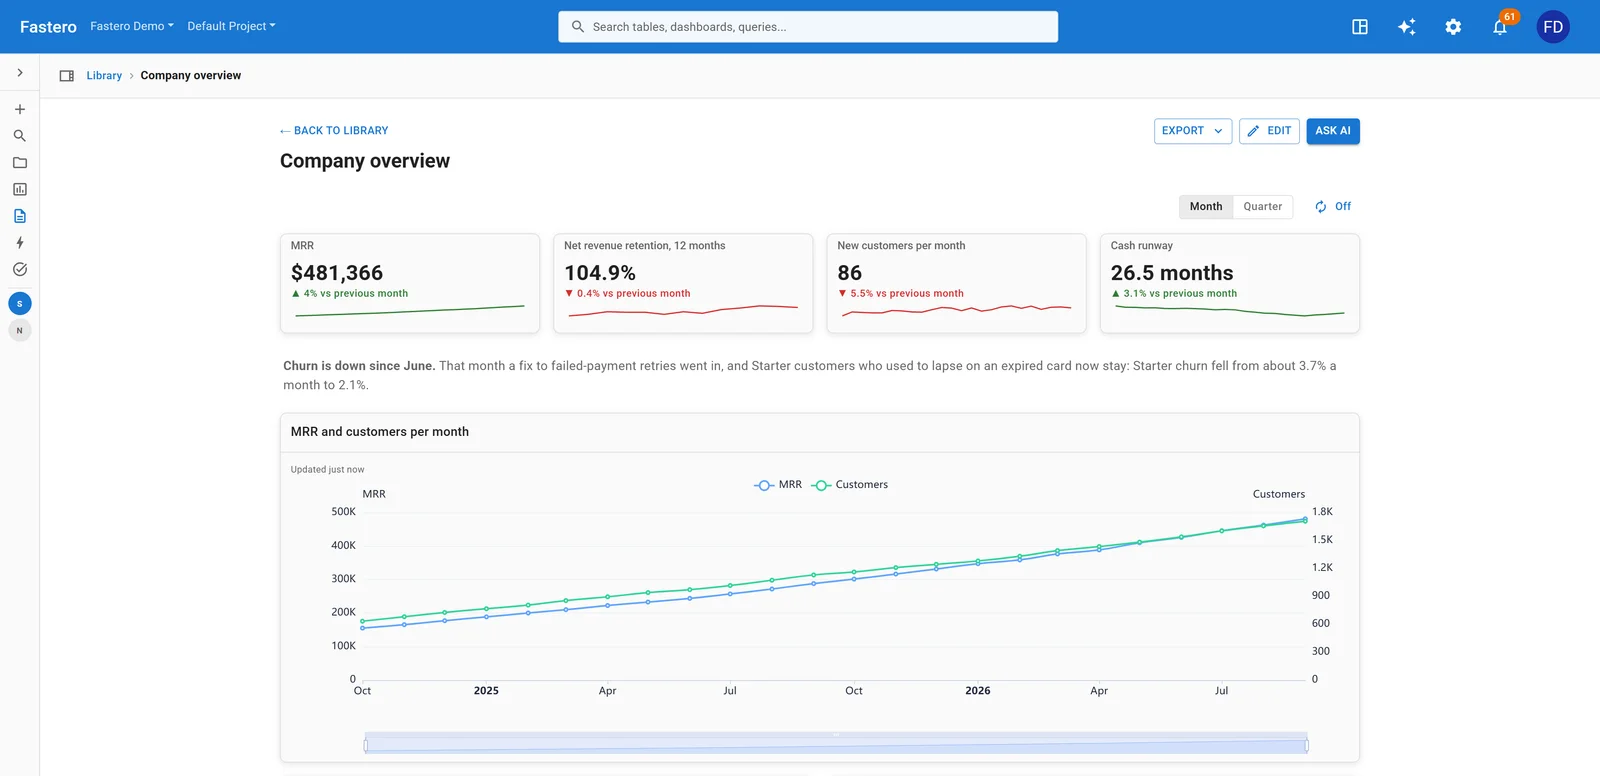
A company overview for a software company. Sample data.
One number per area, each saying whether that area is fine, so a bad one tells you whom to ask. A short note on what changed, as here on churn, saves the meeting's first question.
The trap: net revenue retention with no window. ChartMogul's formula compares "MRR today from a customer cohort ÷ MRR from that same cohort a year ago". A month-on-month figure is a different number. Put "12 months" on the tile.
2. Subscription revenue
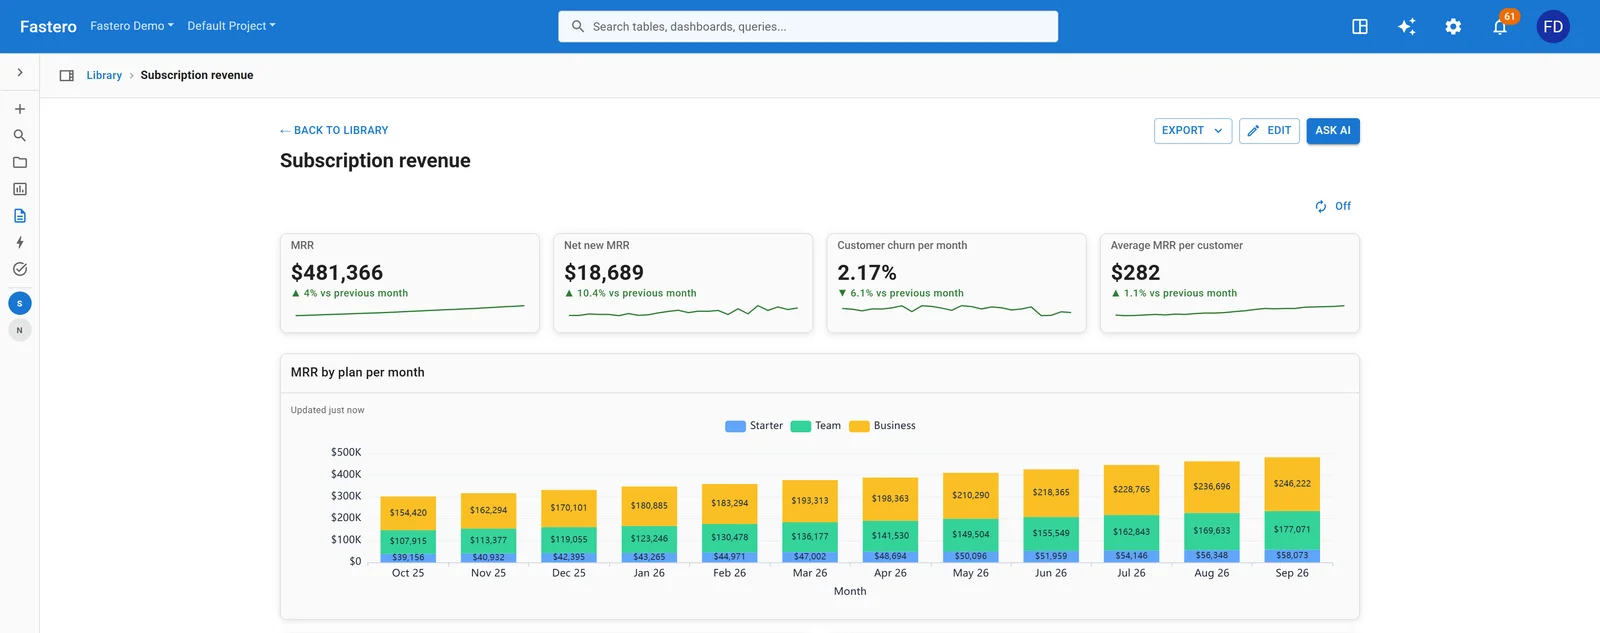
MRR by plan for the last twelve months, under the four numbers that sum it up. Sample data.
MRR is the size, net new MRR the direction, churn the leak, and MRR per customer shows whether growth comes from more customers or bigger ones. The chart by plan shows which plan carries the business.
The trap: ARR that isn't recurring. ChartMogul notes ARR means either annualized run rate (MRR × 12) or annual recurring revenue (contracts of 12 months or more), and warns that "folding one-time fees or services revenue into ARR overstates predictable, recurring revenue". a16z lists the same mistake: counting "hardware, setup, installation, professional services" when multiplying a month by 12.
3. Sales pipeline
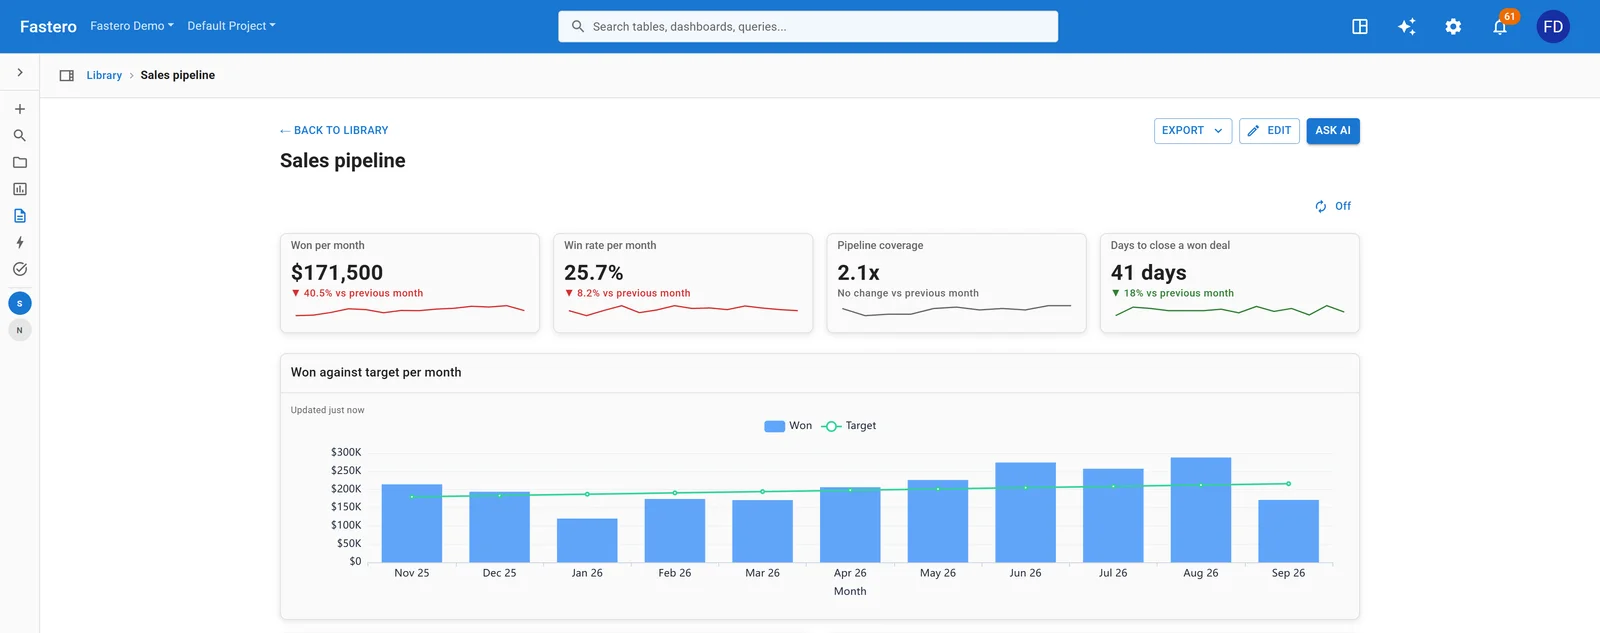
Deals won against the monthly target. Sample data.
Won this month against target is the result; win rate, coverage and days to close say whether next month will be any better. Leaders read this one weekly.
The trap: the 3x rule. Salesforce's own blog says three times coverage "works only when your win rate is exactly 33% and your sales cycle is exactly one year". Its formula instead is annual quota ÷ win rate ÷ (365 ÷ sales cycle in days); at a 25% win rate and a 60-day cycle, a $100,000 quota needs $65,757 in pipeline, not $300,000.
4. Finance dashboard
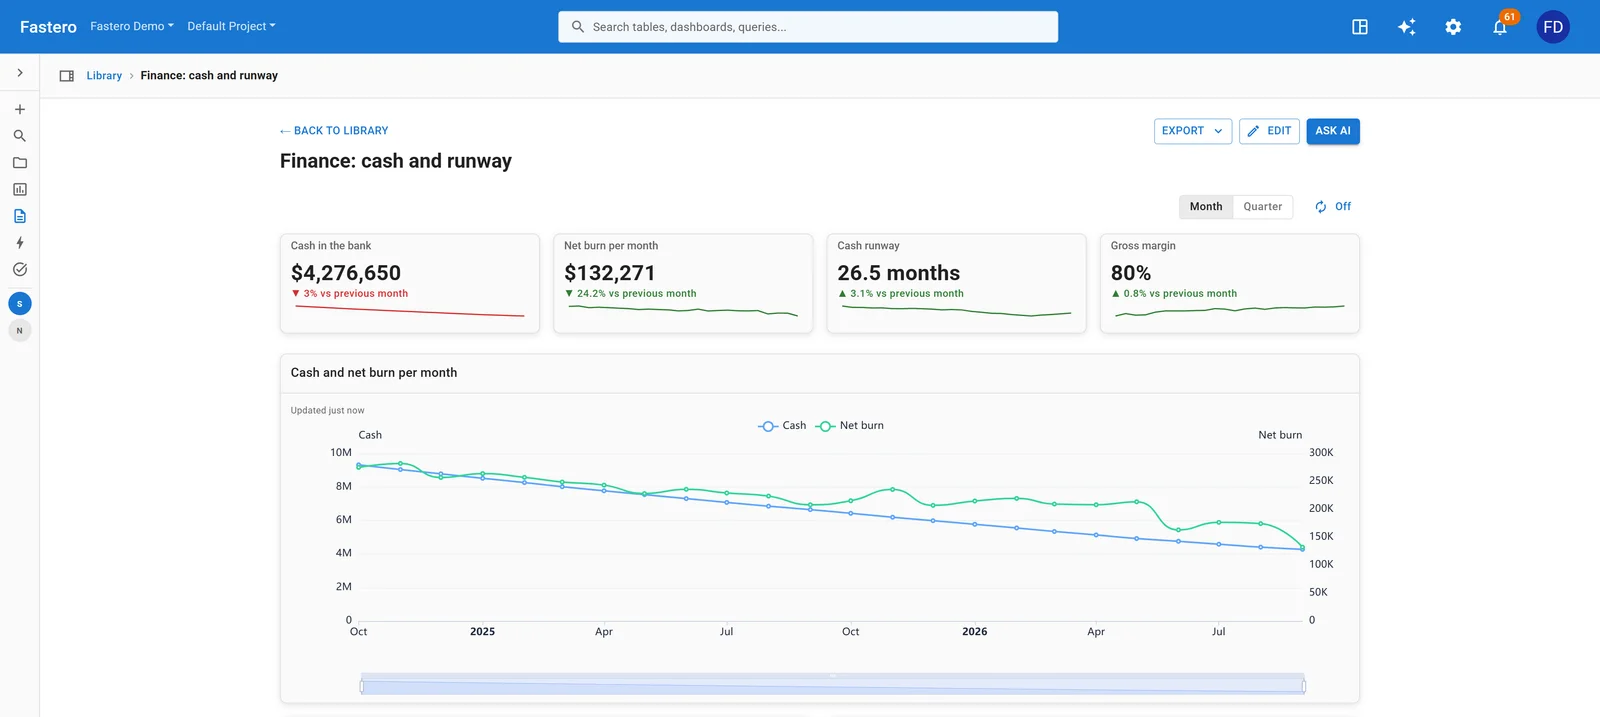
Cash falling as the company spends, with runway still over two years. Sample data.
A financial dashboard for leadership needs six numbers: cash in the bank, net burn, runway, gross margin, revenue against last year and spending against budget. Cash and runway say how long the money lasts; gross margin, whether each sale pays for itself; budget against actual is where the next decision usually sits.
The trap: runway from the wrong burn. Stripe defines runway as "total cash on hand divided by monthly net burn rate", and net burn as cash spent minus revenue. Using gross burn shortens it; using one unusual month swings it. a16z's simple monthly burn averages a whole year: cash at the start of the year minus cash at the end, divided by 12.
5. Customer support
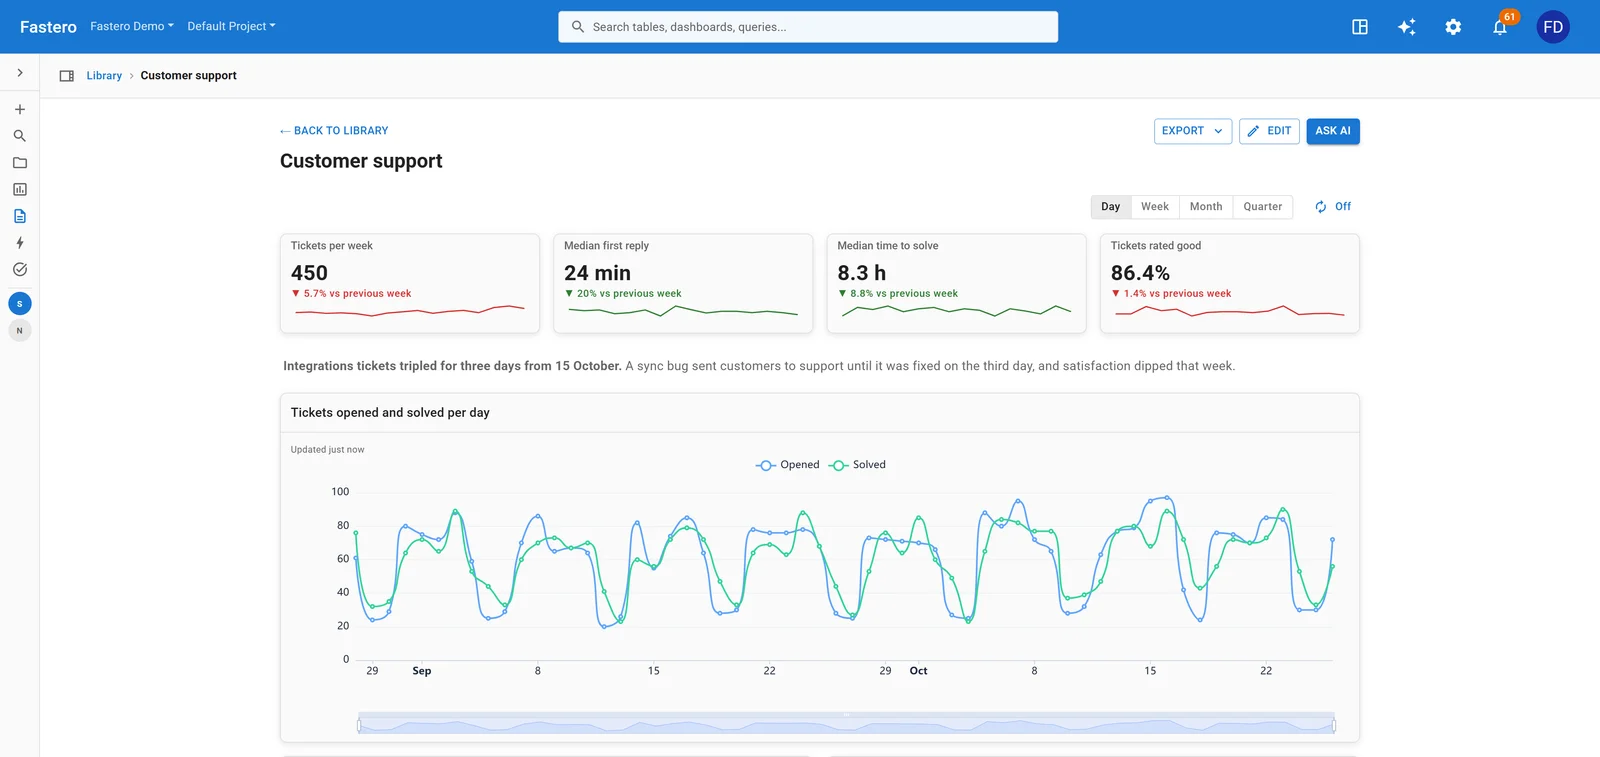
Tickets, reply times and satisfaction. Sample data.
Ticket volume says how busy; first reply and time to solve say how long customers wait; the share rated good says how they felt about it. Zendesk defines first reply time as the time between ticket creation and "the first public agent reply on the ticket".
The trap: averages for waiting times. A handful of tickets left open for weeks drags an average far above what a typical customer waits, so show medians, and show how many people rated next to the share rated good.
6. Marketing
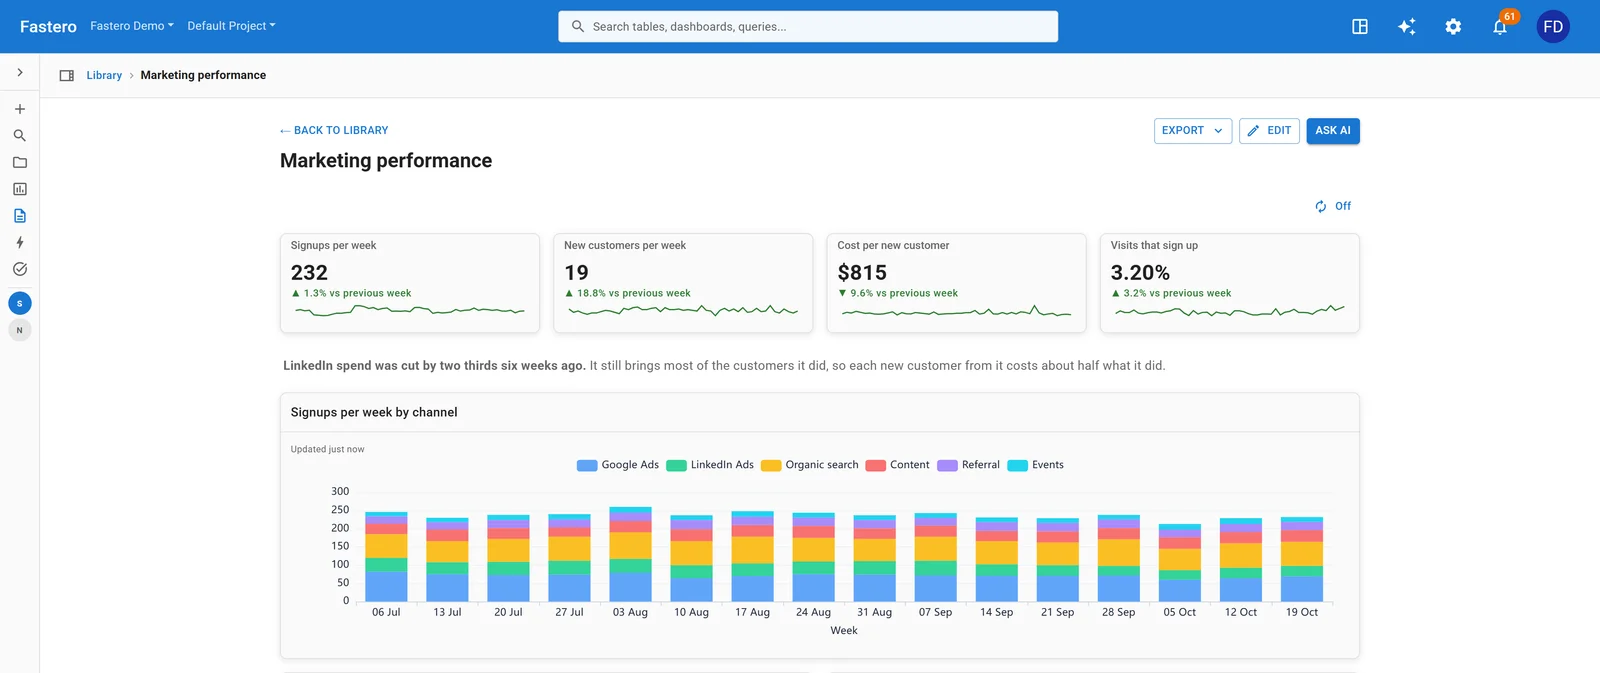
Signups by channel each week, with what a new customer costs. Sample data.
Signups and new customers are the volume, cost per new customer its price, and the visit-to-signup rate says whether the site or the traffic is the problem.
The trap: one blended CAC. a16z: blended CAC "isn’t wrong, it doesn’t inform how well your paid campaigns are working", which is why investors weigh paid CAC more. Costs also rise with scale; a16z's example is $1 per user for the first 1,000, $2 for the next 10,000, and $5 to $10 for the next 100,000. Show CAC by channel under the blended number.
7. Data platform
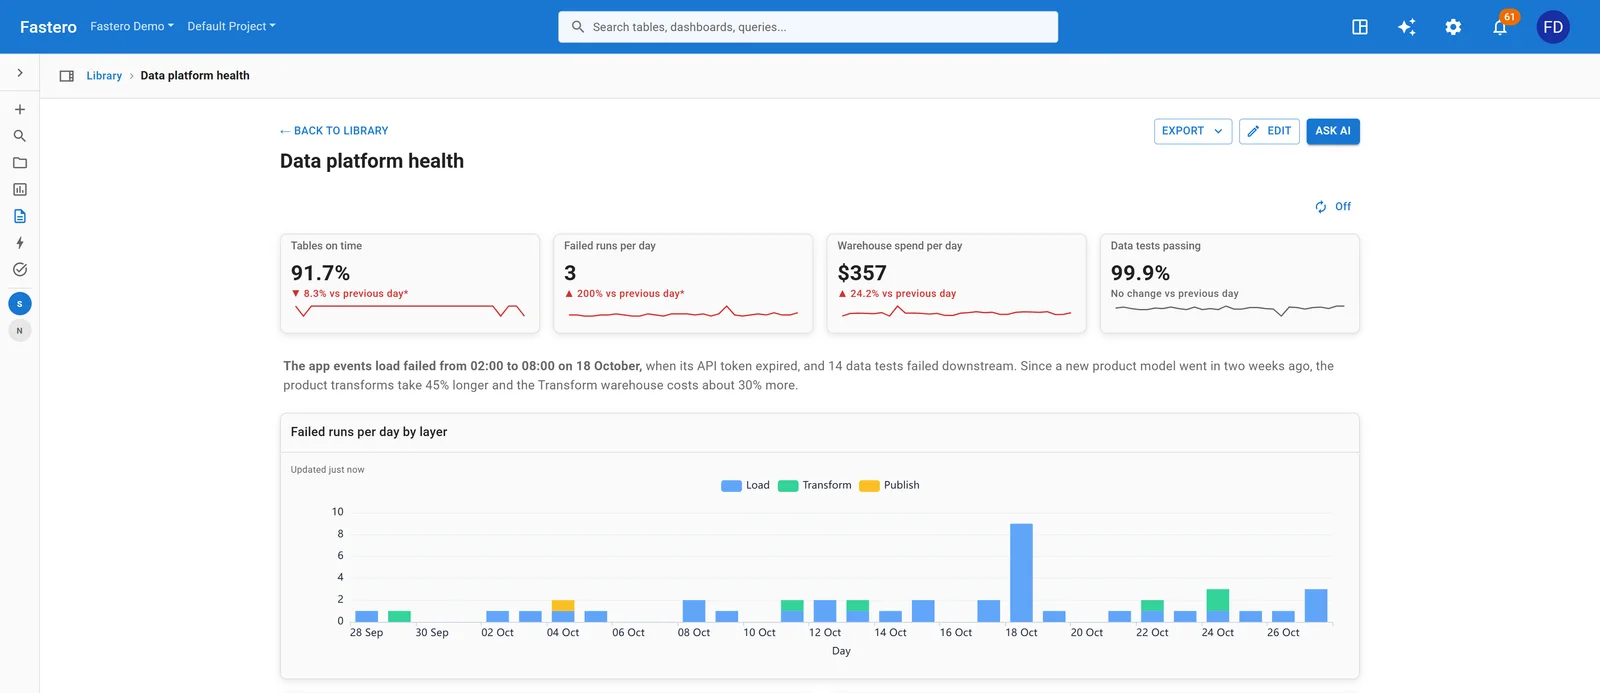
Failed runs per day by layer: the spike is a load whose API token expired. Sample data.
For a head of data or a CTO: are the tables everyone else reads on time, did last night's jobs run, what does the warehouse cost, and are the tests passing? If the share of tables on time drops, every number on the other seven dashboards is suspect.
The trap: a freshness score that only counts tables someone configured. In dbt, a source has a warn_after and an error_after, and "If neither is set, dbt will not check freshness for that resource." Count unchecked tables as not on time, or show them as their own number.
Connect any database. Ask in plain English.
Start free →8. Sales and orders
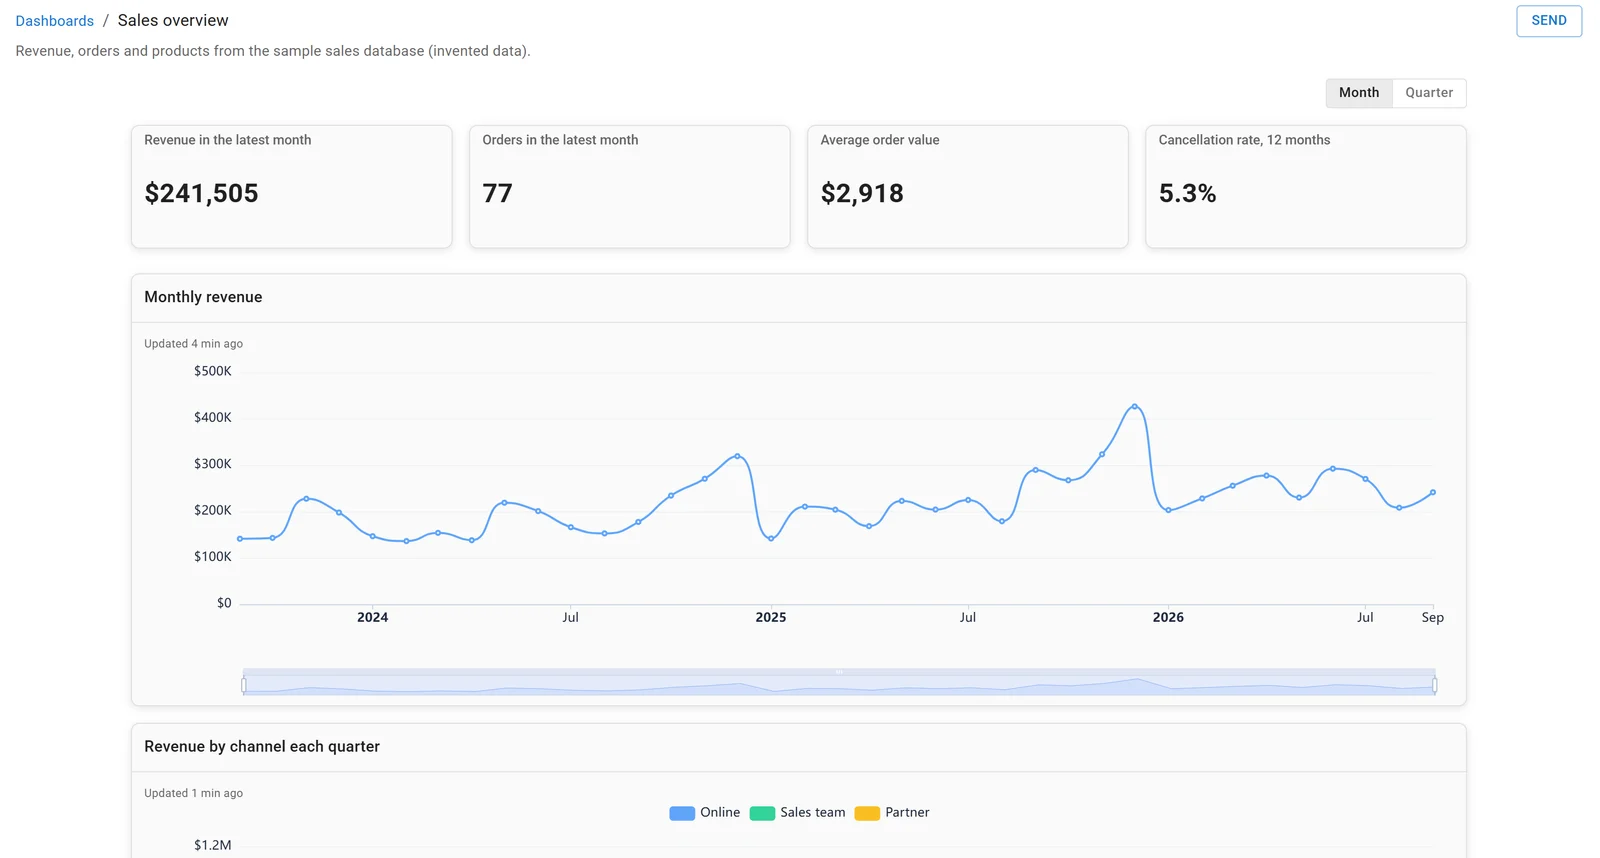
A dashboard in Fastero, built on the sample sales database. Invented data.
For a business that sells products: revenue, orders, average order value and where the orders came from. Our executive dashboard example has the SQL for each chart.
The trap: a month-on-month arrow in a seasonal business. We checked it on an invented file of 4,734 orders (November 2024 to October 2026) in DuckDB 2.0.0 on 18 November 2026:
WITH monthly AS (
  SELECT date_trunc('month', order_date) AS month, sum(revenue) AS revenue
  FROM sales
  GROUP BY 1
),
t AS (
  SELECT month, revenue,
         lag(revenue, 1)  OVER (ORDER BY month) AS prev_month,
         lag(revenue, 12) OVER (ORDER BY month) AS same_month_last_year,
         sum(revenue) OVER (ORDER BY month ROWS BETWEEN 11 PRECEDING AND CURRENT ROW) AS last_12_months
  FROM monthly
)
SELECT strftime(month, '%Y-%m')                              AS month,
       round(revenue)                                        AS revenue,
       round(100 * (revenue / prev_month - 1), 1)            AS vs_last_month_pct,
       round(100 * (revenue / same_month_last_year - 1), 1)  AS vs_last_year_pct,
       round(last_12_months)                                 AS last_12_months
FROM t
ORDER BY month DESC
LIMIT 3;
┌─────────┬─────────┬───────────────────┬──────────────────┬────────────────┐
│ month │ revenue │ vs_last_month_pct │ vs_last_year_pct │ last_12_months │
│ varchar │ double │ double │ double │ double │
├─────────┼─────────┼───────────────────┼──────────────────┼────────────────┤
│ 2026-10 │ 57518.0 │ -11.3 │ 8.3 │ 816730.0 │
│ 2026-09 │ 64819.0 │ -25.7 │ 21.4 │ 812334.0 │
│ 2026-08 │ 87202.0 │ 3.6 │ 28.1 │ 800913.0 │
└─────────┴─────────┴───────────────────┴──────────────────┴────────────────┘September's tile, compared with August, says revenue fell by a quarter. Compared with September last year, it rose 21.4%, and the last 12 months kept climbing, to 816,730 by October: 24.3% more than the 12 months before. An executive who sees only the first arrow calls the wrong meeting. Put the year-ago comparison on the tile, or a trailing-12-month number beside it.
Building an executive dashboard on your own data
Every dashboard above was built in Fastero, an AI and data platform where people and AI agents work together on a team's data. For a leadership team:
- Connect the database or warehouse, then ask Fastero's assistant, or Claude through Fastero's connector, for the screen you want. Every number is a saved query someone can open and check.
- It refreshes on a timer (1, 5, 15 or 60 minutes) or, for Postgres and BigQuery data only, when the data changes.
- It can email itself every Monday, or daily or monthly, with the numbers, charts and tables plus a PDF.
- For a board member or investor, the Send dialog's "Just this person" sends one dashboard to an email address; they see only that dashboard, after a code sent to their inbox. "Anyone with the link" makes a public link you can turn off.
- Viewers are free on every plan. The Free plan is $0 with no end date; Pro is $20 per editor a month (checked 18 November 2026).
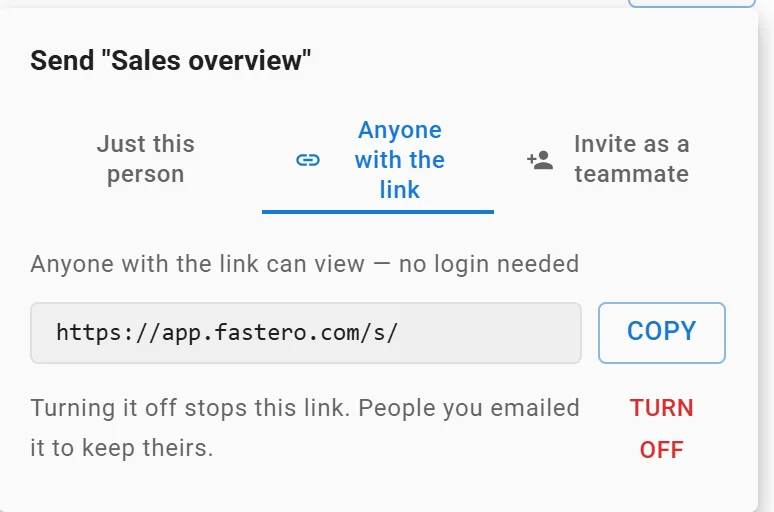
A dashboard's public link: anyone with it can view without a login, and turning it off stops it. Link shortened.
To send the same numbers as a written update, see our weekly report template. To choose the one number above all the others, see north star metric.
FAQ
What should an executive dashboard include?
Four to six headline numbers, each against last period or a target, one trend chart and the breakdown that explains it. For a company overview, take one number from each area: revenue, retention, new customers and cash runway.
What is the difference between an executive dashboard and an operational dashboard?
An executive dashboard shows outcomes across the business, reviewed weekly or monthly, to decide where to look. An operational dashboard shows one team's work in detail, often daily, to decide what to do next.
What should a financial dashboard show?
Cash in the bank, net burn, cash runway, gross margin, revenue against last year and spending against budget. Stripe defines runway as total cash on hand divided by monthly net burn.
How many KPIs should be on an executive dashboard?
As many as fit on one screen with their comparisons; each example above leads with four. No research fixes an exact number, so cut any tile nobody has acted on in a quarter.
How often should an executive dashboard be updated?
As often as the decisions it supports: sales and support numbers daily, finance monthly. If leadership meets weekly, have the dashboard email itself before the meeting, so everyone reads the same numbers.
Sources
Read on 18 November 2026:
- ChartMogul: Net revenue retention, ARR
- a16z: 16 startup metrics
- Salesforce: Why the 3x pipeline coverage rule is broken
- Stripe: What burn rate is and how to calculate it
- Zendesk: About native Support time duration metrics
- dbt: freshness
- Queries: DuckDB 2.0.0 on an invented file of 4,734 orders, run 18 November 2026
Try Fastero free: connect your data, ask for the screen your leadership team needs, and send it every Monday. No credit card required.