 Fastero Dev Team
A North Star metric is the single number a whole company agrees to grow, picked because it tracks the value customers get rather than the revenue that follows. Picking the number, and reading it every week without fooling yourself, is where teams go wrong.
The short answer: Sean Ellis defines the North Star metric as "the single metric that best captures the core value that your product delivers to customers". Airbnb's is nights booked. Amplitude's North Star Playbook adds that it should lead revenue, sit within product and marketing's influence, and have three to five input metrics beneath it that teams move directly. To pick one, find the moment customers get value, count it per week, and check that it rises before revenue does. Track it weekly against a four-week average and the same week last year.
Fastero
Connect your database. Ask questions. Get dashboards.
Postgres, BigQuery, Snowflake, and 10+ sources — live-connected, AI-powered, no dashboard builder learning curve.
Try free →North Star metric vs KPIs vs the "one metric that matters"
| What it is | How long it lasts | |
|---|---|---|
| North Star metric | The one number that measures value delivered to customers | Amplitude: six to 12 months at an early-stage startup, one to three years at an established company |
| One metric that matters | The input to focus on right now | Weeks or months |
| KPIs | Each team's targets, some unrelated to the North Star | Reviewed each period |
Ellis calls the North Star "a persistent overall success metric"; the one metric that matters is the lever to pull now. At LogMeIn, he told Intercom, the North Star was remote control sessions, but "95% of new signups never had a single remote control session", so for months the focus was getting signups to a first session. For team-by-team KPIs, see 30 KPI examples.
North Star metric examples by business type
| Business type | Company | North Star | Source |
|---|---|---|---|
| Subscription software | LogMeIn | Remote control sessions | Sean Ellis, Intercom interview |
| Subscription software | Slack | 2,000 messages per team | Morgan Brown, Hacking Growth co-author, who calls such numbers "guiding lights" |
| Marketplace | Airbnb | Nights booked | Sean Ellis |
| Ecommerce, delivery | A grocery delivery service | Total monthly items received on time | Amplitude playbook, worked example |
| Ecommerce, delivery | Burger King's digital team | Digital transactions per user | Amplitude playbook |
| Ecommerce, delivery | A delivery app | "Happy Deliveries": deliveries with no issues | Amplitude playbook |
| Media | Netflix, 2005 | Share of customers who put three or more DVDs in their queue in their first session | Amplitude playbook |
| Media | Daily active users | Sean Ellis | |
| Media | A content subscription | "Frequent Content Sharers": subscribers who share an average of two or more articles a week over 12 weeks | Amplitude playbook, worked example |
| A data tool | Amplitude | Weekly learning users: active users who share a learning that at least two others consume within seven days. Before that, weekly querying users | Amplitude blog, 2019 |
Two sources disagree here. Ellis cites Facebook's daily active users; Amplitude's playbook says DAU and registered users "say nothing about what your customers value" and lists DAU first among its vanity metrics. For a feed that gets better as more people use it, Ellis's argument, the count of users is close to the value. For most products it isn't.
How to pick a North Star metric
- Name the game you're in. Amplitude sorts products into an attention game (time spent is the value), a transaction game (finding and buying the right thing) and a productivity game (getting a job done).
- Find the moment of value in that game: a night stayed, an order delivered, a report shared.
- Count that moment per week, or per user per week, so it can grow and you see it move often.
- Test it against your history. It should rise before revenue does. If it doesn't, it isn't leading anything.
- Name it and define it. Amplitude's template: "Our North Star Metric is called X, which we define as Y."
Amplitude's checklist adds that it should be actionable, understandable outside the data team, and not a vanity metric. Revenue fails as a North Star because MRR and ARPU "tell you what happened in the past".
Input metrics beneath it
Amplitude calls inputs "a set of three to five influential, complementary factors". Its grocery example has four: customers placing lots of orders, orders with lots of items, fulfilling lots of orders, and delivering them on time. Ellis's usual list is new signups, activations, and engagement and retention. The North Star itself should be out of direct reach; in John Cutler's words, "If you can move your North Star directly, it’s probably not a good North Star."
Common North Star traps
| Trap | What happens | Fix |
|---|---|---|
| A vanity metric | Downloads, page views or registered users rise while nobody gets more value | Count the value moment, not the visit |
| Revenue as the North Star | You learn about a problem after the quarter closes | Use the behaviour that precedes revenue |
| One per team | Teams fight over resources, the thing the framework exists to stop | Amplitude: one North Star per product with one P&L and customer base |
| Staring at the metric | Nobody can act on it directly | Set goals on the inputs |
| Reading single weeks | One good week, then a panic | Compare a four-week average and the same weeks last year |
| Counting a part week | The latest week looks like a collapse because it isn't over | Only report whole weeks |
The last two are where a weekly report goes wrong, and both show up in the data below.
How to track a North Star metric weekly in SQL
The invented data: 4,734 orders, 1 November 2024 to 31 October 2026, from a company selling software, hardware, services and supplies. With no customer ids or delivery data, the North Star here is orders per week; a real business would pick something closer to value, like "Happy Deliveries". DuckDB 2.0.0, Python 3.14, run on 18 November 2026, with the file loaded as a table called sales.
The file ends on a Saturday, so its last week has six days in it: 39 orders. date_trunc('week', ...) starts weeks on Monday, and the WHERE line below keeps whole weeks only. The window functions run before the filter, so last year's weeks are still there to compare with.
WITH weekly AS (
  SELECT date_trunc('week', order_date) AS week,          -- weeks start on Monday
         count(*)                        AS orders
  FROM sales
  GROUP BY 1
),
scored AS (
  SELECT week, orders,
         orders - lag(orders) OVER w                                AS vs_last_week,
         round(avg(orders) OVER (w ROWS BETWEEN 3 PRECEDING AND CURRENT ROW), 1) AS avg_4_weeks,
         lag(orders, 52) OVER w                                     AS same_week_last_year
  FROM weekly
  WINDOW w AS (ORDER BY week)
)
SELECT strftime(week, '%Y-%m-%d') AS week_starting, orders, vs_last_week, avg_4_weeks, same_week_last_year
FROM scored
WHERE week + INTERVAL 6 DAY <= (SELECT max(order_date) FROM sales)   -- whole weeks only
ORDER BY week DESC
LIMIT 6;
┌───────────────┬────────┬──────────────┬─────────────┬─────────────────────┐
│ week_starting │ orders │ vs_last_week │ avg_4_weeks │ same_week_last_year │
│ varchar │ int64 │ int64 │ double │ int64 │
├───────────────┼────────┼──────────────┼─────────────┼─────────────────────┤
│ 2026-10-19 │ 40 │ -23 │ 45.3 │ 41 │
│ 2026-10-12 │ 63 │ 24 │ 47.0 │ 41 │
│ 2026-10-05 │ 39 │ 0 │ 41.8 │ 37 │
│ 2026-09-28 │ 39 │ -8 │ 47.0 │ 40 │
│ 2026-09-21 │ 47 │ 5 │ 54.0 │ 40 │
│ 2026-09-14 │ 42 │ -18 │ 56.8 │ 44 │
└───────────────┴────────┴──────────────┴─────────────┴─────────────────────┘Read week by week, this is chaos: up 24, then down 23. The four-week average says orders have fallen from 56.8 a week in mid-September to 45.3. The last column says why that's less alarming than it looks: the same weeks last year were at 37 to 44. Over the four latest whole weeks, orders were 181 against 159 in the same weeks a year earlier: up 13.8%.
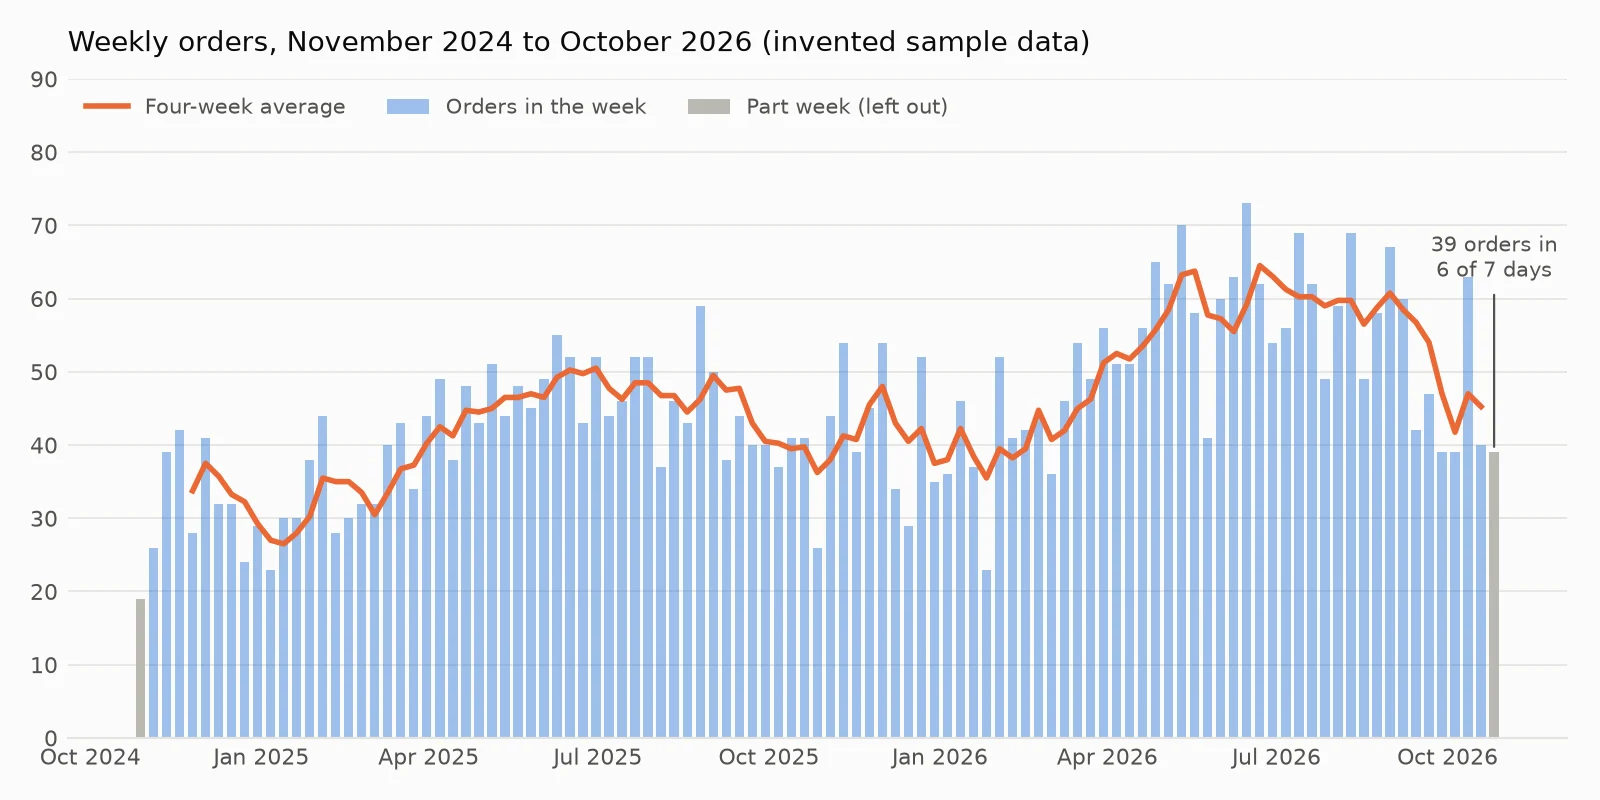
Weekly orders on invented data, with the four-week average. The grey bars are part weeks: report them and the latest week always looks like a drop.
Then the inputs, the numbers teams can move. Here they are orders by channel, which add up to the North Star, and units per order:
SELECT strftime(date_trunc('week', order_date), '%Y-%m-%d') AS week_starting,
       count(*) FILTER (WHERE channel = 'Online')     AS online,
       count(*) FILTER (WHERE channel = 'Sales team') AS sales_team,
       count(*) FILTER (WHERE channel = 'Partner')    AS partner,
       count(*)                                       AS orders,
       round(sum(quantity) / count(*), 2)             AS units_per_order,
       round(sum(revenue))                            AS revenue
FROM sales
WHERE order_date BETWEEN DATE '2026-09-28' AND DATE '2026-10-25'
GROUP BY 1
ORDER BY 1 DESC;
┌───────────────┬────────┬────────────┬─────────┬────────┬─────────────────┬─────────┐
│ week_starting │ online │ sales_team │ partner │ orders │ units_per_order │ revenue │
│ varchar │ int64 │ int64 │ int64 │ int64 │ double │ double │
├───────────────┼────────┼────────────┼─────────┼────────┼─────────────────┼─────────┤
│ 2026-10-19 │ 20 │ 9 │ 11 │ 40 │ 3.78 │ 12275.0 │
│ 2026-10-12 │ 32 │ 18 │ 13 │ 63 │ 3.59 │ 18809.0 │
│ 2026-10-05 │ 15 │ 12 │ 12 │ 39 │ 4.28 │ 10343.0 │
│ 2026-09-28 │ 18 │ 15 │ 6 │ 39 │ 4.05 │ 9070.0 │
└───────────────┴────────┴────────────┴─────────┴────────┴─────────────────┴─────────┘The 63-order week came from Online (32) and the sales team (18) at once, and both fell back the next week. Revenue is there as a check: if the North Star rose for months and revenue didn't follow, it would be the wrong North Star. For more on the averages, see moving averages in SQL.
Connect any database. Ask in plain English.
Start free →Putting the North Star in front of people every week
Amplitude's product and leadership teams report on theirs "weekly". Fastero is an AI and data platform where people and AI agents work together on a team's data, and it can do the reporting part:
- Connect the database, then ask Fastero's assistant, or Claude through Fastero's connector, for a dashboard with the North Star first and its inputs beneath. Each number is a saved query you can open.
- Schedule it to email every week, on the day and at the time you choose. Each email has the numbers, charts and tables plus a PDF, and the same dialog can post to Slack once Slack is connected.
- Between emails it refreshes on a timer (1, 5, 15 or 60 minutes) or, for Postgres and BigQuery data only, when the data changes.
- Colleagues open it with their own login, and viewers are free on every plan. Free is $0 with no end date; Pro is $20 per editor a month (checked 18 November 2026).
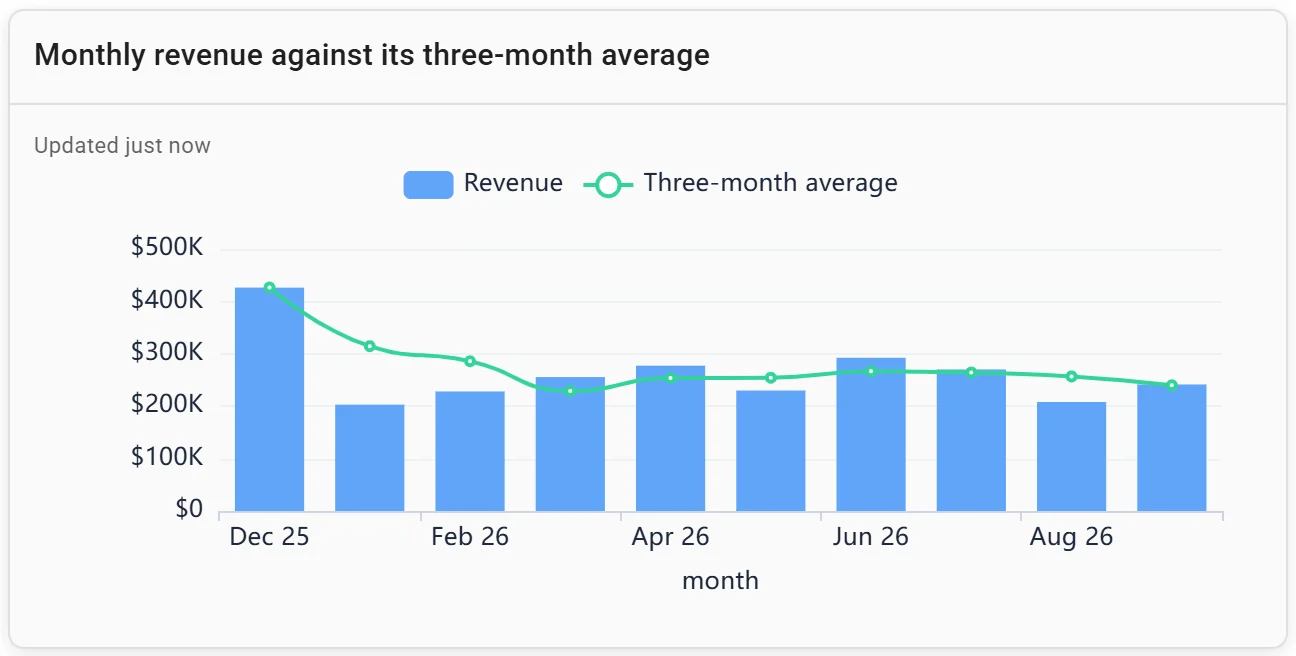
A combo chart: monthly revenue against its three-month average. Invented data.
For what the weekly email itself should say, see the weekly report template; for whole dashboards by team, KPI dashboard examples.
FAQ
What is a North Star metric?
The single metric that best captures the value customers get from your product, in Sean Ellis's definition. It should rise before revenue does, so that growing it grows the business.
What is an example of a North Star metric?
Airbnb's nights booked, which captures value for guests and hosts alike. Others are LogMeIn's remote control sessions and Amplitude's weekly learning users.
What is the difference between a North Star metric and a KPI?
A company has one North Star metric, which measures customer value and lasts for years. It has many KPIs, set by each team for each period, and some have nothing to do with the North Star.
What is the North Star framework?
Amplitude's model: one North Star metric, the three to five inputs that produce it, and the work teams do to move those inputs. Its North Star Playbook is free to read on Amplitude's site.
How often should you change your North Star metric?
Amplitude says early-stage startups might change it every six to 12 months and established companies every one to three years. Change it when the company's strategy changes, or when it stops moving with revenue.
Sources
Read on 18 November 2026:
- Amplitude: North Star Playbook, We're evolving our product's North Star metric (13 February 2019)
- Sean Ellis: Growth needs a North Star metric (21 June 2017), Sean Ellis on charting a path toward sustainable growth (Intercom)
- Morgan Brown: The key to growth? Illuminating your best bets (4 May 2017), an excerpt from Hacking Growth
- Queries: DuckDB 2.0.0 on an invented file of 4,734 orders, run 18 November 2026
Try Fastero free: put your North Star and its inputs on one dashboard and email it to the team every Monday. No credit card required.