 Fastero Dev Team
Ask ChatGPT for a dashboard of last quarter's sales and you'll get one. Which kind depends on where your data lives and who needs to open it next Monday, and that decides whether it's a one-off picture or something your team can rely on.
The short answer: for a one-off look at a spreadsheet, upload it and ask: ChatGPT charts it in the chat, with interactive charts on Plus and above, but OpenAI calls the result "a snapshot". For a page others can open, ask for a Site (beta, on Plus, Pro, Business, Enterprise and Edu), which you can share with chosen people, your workspace or the public. A Site's numbers stay current in only two ways: a scheduled task that rebuilds it, or, in a Business or Enterprise workspace, each visitor's own connected apps read when the page opens. For an app on your own database, Codex writes it and you host it. For a team dashboard on your database that everyone opens with the same live numbers, whether or not they use ChatGPT, build it in a dashboard tool such as Fastero.
Fastero
Connect your database. Ask questions. Get dashboards.
Postgres, BigQuery, Snowflake, and 10+ sources — live-connected, AI-powered, no dashboard builder learning curve.
Try free →The six ways at a glance
From OpenAI's own pages, checked 12 November 2026. We had no ChatGPT account for this, so nothing here is hands-on.
| Way | Where the data comes from | Do the numbers stay live? | Who can open it |
|---|---|---|---|
| A chart in the chat | Files you upload | No, a snapshot | You, in your chat |
| A Site | Uploaded files, or connected apps | Snapshot, unless a scheduled task rebuilds it or visitors' own connections fill it | You and admins at first; then chosen people, the workspace or the public |
| Plugins to live data | BigQuery, Snowflake, Databricks, Metabase and more, or your own MCP server | Yes in the chat, when you ask | The person asking, with their own connection |
| Codex writes a dashboard app | Your database | Only if you host it with a backend | Whoever can reach where you put it |
| ChatGPT plus a BI tool | The BI tool's sources | Yes, as the BI tool refreshes | The BI tool's users |
| Build it in Fastero | Your database, through a stored connection | Yes: queries run against the database, on a timer, or when data changes on Postgres and BigQuery | Your team with a free viewer login, or anyone with a public link |
1. Ask in the chat: a chart from an uploaded file
Upload a CSV or Excel file and ask for a dashboard, and ChatGPT analyses it and draws the charts in the reply. Data analysis is "Limited" on Free, and interactive tables and charts start at Plus. A newer option, Visualize ("Create visualizations and interactive tools"), is rolling out: type @ and choose it under Plugins.
Build a dashboard from this file: revenue by month, revenue by region and the top 10 products, with a region filter.
What you get is a picture of that file: "A visualization is generally a snapshot of the information available when ChatGPT created it, not a live dashboard that stays synchronized with a connected source." Next month's numbers need next month's file. OpenAI's current ChatGPT documentation doesn't cover canvas for this; it documents Visualize and Sites instead.
Best for: a fast first look at a spreadsheet.
2. Publish it as a Site
Sites is ChatGPT's way to build and host a web page: "Create dashboards, team trackers, client portals, landing pages, calculators, games, and more." It's in beta on Plus, Pro, Business, Enterprise and Edu, and "Hosting is free through December 31, 2026." Each plan has a monthly hosting allowance: 125 credits on Plus, 375 on Pro, 125 per seat on Business.
Turn this analysis into a Site: a weekly sales dashboard with number cards for revenue and orders, revenue by month, and a region filter.
"A new site is limited to its owner and workspace admins until you change its access." Then share it with selected people, who sign in with the account that received access, with your workspace, or with the public: "A public site is available without ChatGPT workspace access." Enterprise workspaces have public publishing off by default.
The catch is whether the numbers stay live. "A source link or uploaded export doesn't create a live connection." Two things keep a site current:
- Visitors' own connections. In a Business or Enterprise workspace, "On page load, sites reads connected data using the visitor's connection and permissions." But "Plugin use must be enabled in the workspace, and the site must be private to that workspace", and the site "does not use the creator’s connections", so two colleagues can see different numbers and a public site can't use it.
- A scheduled task. OpenAI's recipe for "a dashboard that stays up to date" runs a ChatGPT Work task that "checks the approved source each weekday and updates the dashboard when the data changes." "The site does not run the schedule itself", and the task should start in the browser if it must run while your laptop is off.
Sites doesn't host everything: "Some frameworks, private networks, databases, background services, and hosting patterns aren't supported." OpenAI's business page says ChatGPT Work "creates live dashboards with Sites"; the documentation above is what decides how live.
Best for: sharing a polished page of results, refreshed by a task, with people inside or outside your workspace.
3. Plugins that read live data
Connectors are now called plugins in ChatGPT, and "Plugins pull in live details across your CRM, codebase, documents, and analytics tools". OpenAI's own Data Analytics plugin lists warehouses and query tools ("Databricks, Databricks Genie, BigQuery, Snowflake") and analytics and BI tools ("Amplitude, Mixpanel, PostHog, Omni Analytics, Metabase, ThoughtSpot, Statsig"). For anything else, such as a Postgres database, you can add a custom MCP server as a plugin; see ChatGPT MCP for how.
Using the Snowflake plugin, chart weekly signups for the last six months split by plan, and tell me what changed.
The answer is current when you ask, through your own connection. Shared, it stops being live: the plugin publishes to Sites "as a Sites-hosted snapshot; it does not add live source connections to the Site." Scheduled tasks (Go and above) can re-run the question on a timetable and notify you.
Best for: asking current questions of a warehouse you already connect to.
4. Codex writes a dashboard app
Codex is included in every ChatGPT plan, Free and Go with limits. In the CLI it works on your machine: "Let Codex inspect files, make edits, and run the tools already installed on your machine." In the cloud, "Each task has its own workspace and can keep working while your computer is asleep", and it reaches a private database over a VPN; "Tailscale is currently the supported VPN provider."
Write a small web app that queries our orders table for revenue by month and by channel, with charts and a date filter, and a README for running it.
Codex can write a React app, a Streamlit dashboard or a static page. Making it live for a team is your job from there: a backend that queries the database safely, a login, and somewhere to run it. A Site can start from a Codex project, but Sites doesn't host databases or background services.
Best for: developers who want full control over the code.
5. ChatGPT plus a BI tool
If the team already has a BI tool, ChatGPT can sit beside it. The Metabase, ThoughtSpot and Omni Analytics entries in OpenAI's Data Analytics plugin read from those tools, and ChatGPT's plugins page mentions "creating charts in Figma". The dashboard itself stays in the BI tool, which refreshes it and decides who can open it, usually with a licence per viewer.
Best for: teams that already pay for a BI tool and want ChatGPT to answer questions about what's in it.
Connect any database. Ask in plain English.
Start free →6. Build it in Fastero
This is the option for a dashboard your team opens every week on live company data. Fastero is an AI and data platform where people and AI agents work together on a team's data: connect your database once, ask Fastero's AI agent for the dashboard, and it writes the queries and builds it.
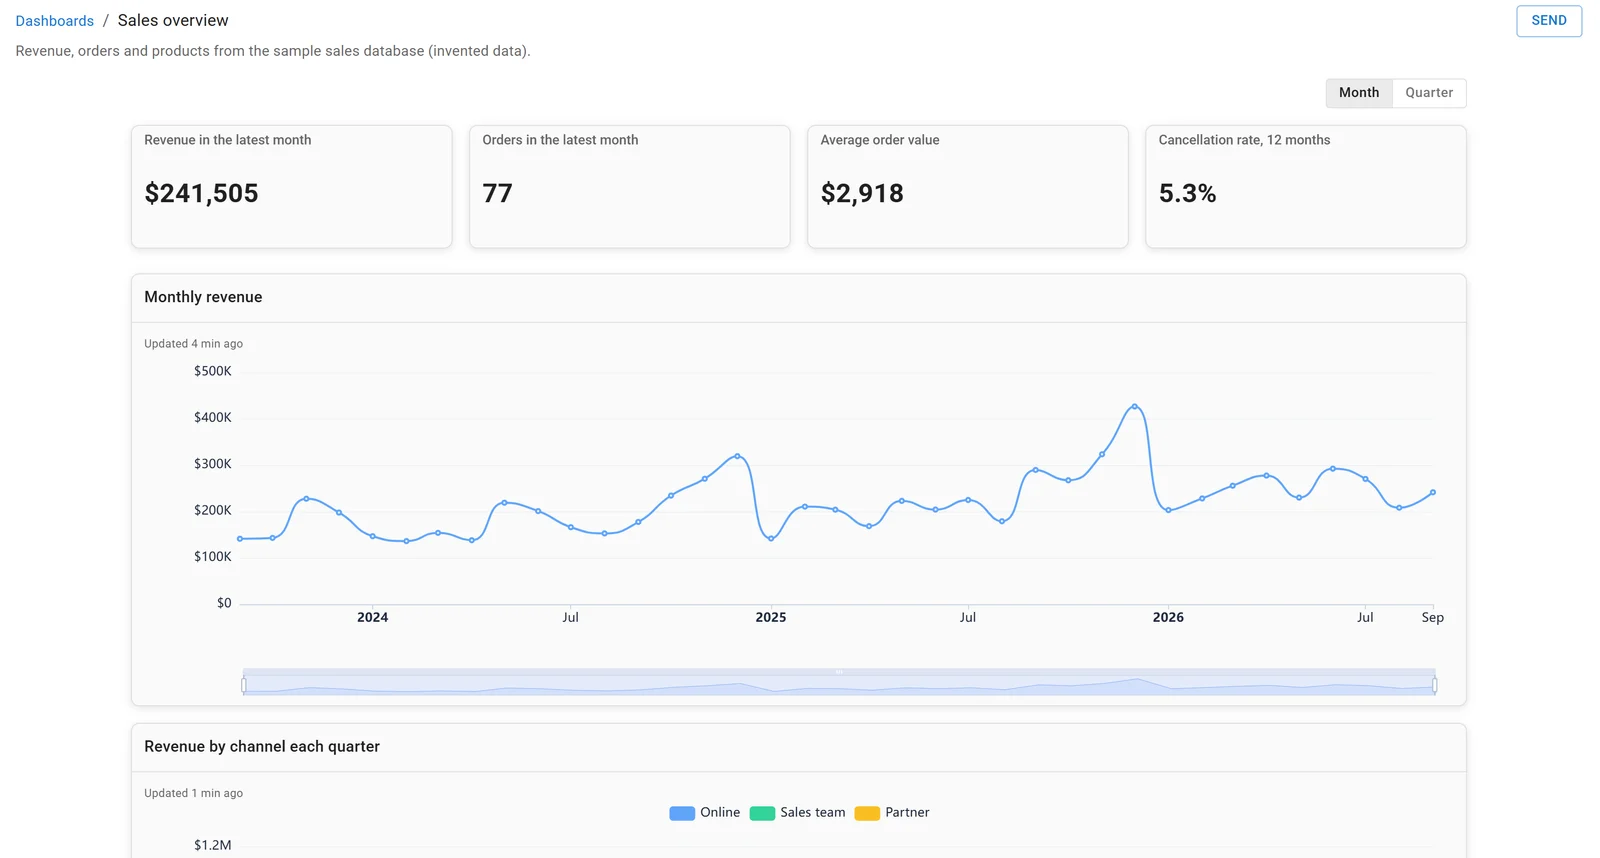
A dashboard in Fastero, built on the sample sales database. Invented data.
What changes for your team:
- It refreshes from the database. Each chart is a saved query against your database, and the dashboard can refresh on a timer or whenever the data behind it changes.
- Viewers are free. Teammates and clients sign in with their own Fastero login and land on the dashboard; viewers cost nothing on every plan, including Free.
- A public link for everyone else. Publish a link that opens without an account, and revoke it at any time.
- It arrives by email. Schedule the dashboard daily, weekly or monthly, with a PDF of the whole dashboard attached, to people with or without an account.
- Claude can build it too. Fastero's remote MCP server signs in with OAuth. We've tested it with Claude and Claude Code; we haven't tested it in ChatGPT.
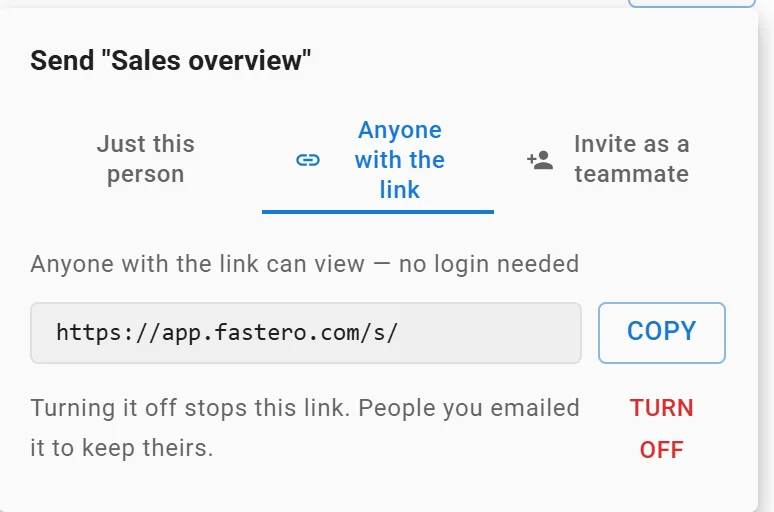
A dashboard's public link: anyone with it can view without a login, and turning it off stops it. Link shortened.
How to build a dashboard in Fastero
- Connect your data. Postgres, MySQL, SQL Server, Redshift, Snowflake, Oracle or BigQuery, or a CSV, Excel file or Google Sheet.
- Ask for the dashboard. "Build a weekly sales dashboard from our orders table: revenue, orders and average order value as number cards with the change since last week, revenue by month, and orders by region."
- Check and share it. Open any chart's query to check it, then invite viewers, publish a public link or schedule the email.
The Claude version of this guide is Claude dashboard: 5 ways to build one, and for how ChatGPT compares on database work, see Fastero vs ChatGPT for database analysis.
Best for: a team dashboard on your own database, for people who don't all use ChatGPT.
Which should you use?
- A quick look at a spreadsheet: ask in the chat.
- A page to share, refreshed by a task: a Site.
- Current answers from a warehouse: a plugin, in the chat.
- Full control of the code: Codex, hosted by you.
- A dashboard your BI tool already owns: ChatGPT beside the BI tool.
- Your own database, live numbers, opened by the whole team: Fastero.
The same in Gemini
Gemini has its own versions of the first two ways:
- Charts in the chat. "You can ask the Gemini web app to create a chart based on your uploaded spreadsheet(s)", with files up to 100 MB.
- Canvas apps. "Canvas is available for all Gemini users", and Google suggests it for "custom-built dashboards ranging from team trackers to customer management systems and sales pipelines". Sharing is public only: "Canvas apps are shared through public links", and "Anyone with that public link can view and edit data associated with the app."
- Gemini in Sheets. "The generated chart doesn't link or respond to changes in the original data set that was used to generate it", except on a BigQuery Connected Sheet, where the chart updates when you refresh it, by hand or on a schedule.
- Data Studio. Conversational analytics in Data Studio (the renamed Looker Studio) is "Available to all Data Studio users", on BigQuery data agents.
FAQ
Can ChatGPT make a dashboard?
Yes: as charts in the chat from a file you upload, as a Site you publish (beta, Plus and above), from live data through plugins, as an app Codex writes, or alongside a BI tool. Only some of these keep the numbers current.
Can ChatGPT connect to my database to build a dashboard?
Through plugins: OpenAI's Data Analytics plugin covers BigQuery, Snowflake and Databricks, and you can add any database's MCP server as a custom plugin. Codex can reach a private database over a Tailscale VPN. A Site can't host a database connection itself.
Does a ChatGPT dashboard update automatically?
A chart from an uploaded file doesn't: OpenAI calls it a snapshot. A Site updates when a scheduled task rebuilds it, or, in a workspace-private site, from each visitor's own connected apps when the page opens.
Can someone without ChatGPT open my dashboard?
A public Site, yes; one shared with selected people needs them to sign in. A dashboard in Fastero opens for anyone you invite, with a free viewer login, or for anyone with its public link.
Is ChatGPT Sites free?
It's in beta on Plus, Pro, Business, Enterprise and Edu, and hosting is free through 31 December 2026. Each plan also has a monthly hosting allowance in credits.
Can Gemini make a dashboard?
Yes. Gemini charts an uploaded spreadsheet, and Canvas builds dashboard apps you share through a public link that anyone holding it can view and edit. Charts Gemini makes in Google Sheets don't update with the data, unless they're on a BigQuery Connected Sheet.
Sources
Checked 12 November 2026. OpenAI's help centre (help.openai.com) refused our requests, so the details come from OpenAI's other official sites:
- OpenAI: ChatGPT pricing, ChatGPT Business, Plugins, Sites, Space, Codex pricing
- ChatGPT + Codex docs: Visualizations, Sites, Sites data and connections, Publishing and sharing sites, Automations, Teams, Analyze a data export, Codex cloud, Cloud environments, Codex CLI
- OpenAI on GitHub: Data Analytics plugin
- Google: Gemini Canvas, Canvas help, Upload files, Gemini in Sheets, Conversational analytics in Data Studio
- Fastero: MCP server · Pricing