
The phrase "open source dashboard tool" returns seven credible options in 2026, but they're solving fundamentally different problems. Grafana watches infrastructure. Metabase lets business users query SQL databases. Superset scales to enterprise analytics. Streamlit builds custom Python apps. Picking the wrong one means you'll spend a month configuring a tool that was never designed for your use case.
I've deployed or maintained five of these seven in production over the past three years. This guide ranks all seven by what they're actually good at, not by GitHub stars or hype cycles. If you are specifically looking to replace Tableau, our best open-source alternatives to Tableau guide takes a more targeted approach.
The comparison table
| Tool | Best for | Language | Self-host effort | SQL required | Real-time | License |
|---|---|---|---|---|---|---|
| Grafana | Infra monitoring + mixed-source dashboards | Go | Medium | No (PromQL/LogQL) | Yes | AGPL 3.0 |
| Metabase | Business users who write SQL | Clojure/Java | Low | Yes | Limited | AGPL 3.0 |
| Apache Superset | Large-scale SQL analytics | Python | High | Yes | Limited | Apache 2.0 |
| Redash | Quick SQL dashboards (legacy) | Python | Low | Yes | No | BSD |
| Lightdash | dbt-native metrics | TypeScript | Medium | Yes (via dbt) | No | MIT |
| Evidence | Code-first reporting | JavaScript | Low | Yes | No | MIT |
| Streamlit | Custom Python data apps | Python | Medium | Optional | Yes | Apache 2.0 |
Which tool fits which job?
         What are you building?
         |
         +-- Infrastructure / uptime dashboards
         |   +-- Multi-source (Prometheus + Postgres + Loki)?
         |   |   └── Grafana ✓
         |   └── Single time-series DB?
         |       └── Grafana ✓ (it's the default for a reason)
         |
         +-- Business KPI dashboards
         |   +-- Team knows SQL?
         |   |   +-- Under 50 users → Metabase ✓
         |   |   +-- 50-500 users, enterprise scale → Superset ✓
         |   |   └── Already on dbt → Lightdash ✓
         |   └── Team doesn't know SQL?
         |       └── Metabase ✓ (visual query builder)
         |
         +-- Recurring reports / narratives
         |   └── Evidence ✓ (Markdown + SQL)
         |
         └── Custom interactive apps
             └── Streamlit ✓ (Python + widgets)
Fastero
Connect your database. Ask questions. Get dashboards.
Postgres, BigQuery, Snowflake, and 10+ sources — live-connected, AI-powered, no dashboard builder learning curve.
Try free →1. Grafana — best for infrastructure monitoring and mixed-source dashboards
Grafana started as a Kibana fork for time-series visualization and evolved into the default monitoring dashboard. If your data lives in Prometheus, InfluxDB, Loki, or any combination of those plus a SQL database, Grafana is the obvious starting point. The Grafana vs Superset comparison covers the architectural differences in depth.
What makes Grafana different from every other tool on this list is its plugin ecosystem. Over 150 data source plugins mean you can put Prometheus metrics, Postgres query results, Elasticsearch logs, and CloudWatch alarms on the same dashboard. No ETL. No warehouse. Just connect and query. The alerting system is production-grade: Alertmanager integration, silencing, routing rules, the whole ops toolkit.
Grafana Cloud deserves mention here. The free tier (10k metrics, 50GB logs, 50GB traces) is generous enough for small teams, and it eliminates the self-hosting overhead entirely. If you'd otherwise spend 4 hours/month on Grafana updates and Prometheus storage management, the managed tier pays for itself.
The gotcha: Grafana thinks in time series. It'll do bar charts and tables from SQL, but the experience feels bolted on. If your primary use case is "show me revenue by region for last quarter," you'll fight the UI. Grafana wants to show you the last 6 hours, auto-refreshing every 30 seconds. Business analytics is a second-class citizen. See Grafana vs Metabase for a direct comparison of those two worlds.
2. Metabase — best for business users who write SQL
Metabase is the easiest open source BI tool to deploy and the fastest to get a non-technical user from "I have a question" to "here's a chart." Install it, point it at your Postgres or MySQL, and within an hour someone from marketing is building their own funnel visualization using the visual query builder. No SQL required for simple queries, though power users can drop into raw SQL mode.
The visual query builder is genuinely good. It handles joins, filters, aggregations, and custom columns without writing a line of SQL. For teams where the analyst-to-stakeholder ratio is 1:20, that self-service capability matters more than any feature on a comparison matrix. Metabase also ships with "questions" — saved queries that non-technical users can parameterize and re-run without touching the SQL underneath. That's a small feature that makes a big difference in adoption.
The gotcha: Metabase struggles at scale. Past 50-100 concurrent users, query performance degrades unless you put serious work into caching configuration and database optimization. The embedded analytics feature exists but requires a paid plan. And if your data model is complex (20+ table joins, window functions, CTEs), you'll outgrow the visual builder fast and end up writing raw SQL anyway. For that comparison, see Metabase vs Superset.
3. Apache Superset — best for large-scale SQL analytics
Superset is the enterprise open source BI tool. Born at Airbnb, now an Apache top-level project, it handles hundreds of concurrent users across dozens of database connections. The chart library is the deepest on this list — 40+ visualization types, including geospatial maps, pivot tables, and time-series decomposition. If you have a data team that writes SQL and serves a large internal audience, Superset is the tool built for that scale.
Where Superset earns its reputation is the SQL Lab. It's a genuinely capable SQL IDE inside your BI tool — query history, saved queries, schema browsing, result preview. Analysts live in it. Superset also has a semantic layer (metrics and calculated columns defined at the dataset level), which means your bar chart and my bar chart compute "revenue" the same way.
The gotcha: deployment is painful. Superset runs on Python, Redis, Postgres (for metadata), and Celery workers. The Docker Compose setup works for dev but production requires Kubernetes or a dedicated VM with real ops work. Configuration happens through superset_config.py, not a UI. If you don't have someone comfortable with Python deployment and Nginx reverse proxies, budget a week just for setup. There's a reason Preset (the managed Superset cloud) exists.
The permissions model is another sharp edge. Superset's role-based access control is powerful but complex — row-level security, dataset permissions, dashboard-level sharing all configured in different places. Getting it right takes time. Getting it wrong means someone in accounting sees the sales pipeline.
4. Redash — honorable mention (maintenance concerns)
Redash deserves credit for pioneering the "connect to any database, write SQL, get a dashboard" pattern. It was simple, focused, and worked. A lot of data teams' first dashboarding experience was Redash.
But I can't rank it higher than an honorable mention in 2026. After Databricks acquired Redash in 2020, community development slowed significantly. The project isn't abandoned — commits still land — but the pace doesn't match Grafana, Superset, or Metabase. Critical features like a visual query builder never materialized. The alert system is basic. The visualization options are limited compared to everything else on this list.
What Redash still does well: multi-database queries in a single dashboard. You can run a query against Postgres and another against BigQuery, put them side by side, and share the URL. That workflow is simple and works. It's just not enough to justify choosing Redash over tools with active development.
The gotcha: if you're starting fresh, pick Metabase instead. Comparable simplicity, active development, larger community. If you're already running Redash and it works, there's no urgent reason to migrate. But don't start a new project on it. See Metabase vs Redash for a detailed comparison.
5. Lightdash — best for dbt-native metrics
Lightdash is built for one specific workflow: you define your metrics in dbt, and Lightdash makes them explorable in a BI layer. If your team already runs dbt and wants a dashboard tool that speaks .yml metric definitions natively, Lightdash eliminates the translation layer between your transformation pipeline and your charts.
The model is simple. Lightdash reads your dbt project, understands your models and metrics, and lets users explore them through a drag-and-drop interface. No re-defining "revenue" in a separate BI tool. No drift between what dbt computes and what the dashboard shows. For dbt-centric teams, that consistency is the entire value proposition.
The Lightdash Cloud offering removes the self-hosting question entirely. It syncs with your dbt project via GitHub and deploys automatically on every merge. If you're already running dbt Cloud, the two services pair naturally.
The gotcha: Lightdash is only as good as your dbt project. If your dbt models are messy or your metrics aren't well-defined, Lightdash just surfaces that mess in a prettier UI. It also has a smaller community and plugin ecosystem than Metabase or Superset. You're betting on a younger project with a narrower scope.
6. Evidence — best for code-first reporting
Evidence takes a completely different approach: dashboards are Markdown files with SQL code blocks. You write your analysis in .md files, embed SQL queries inline, and Evidence renders them as a polished report with charts, tables, and narrative text. Think of it as "what if your data reports were a static site?"
For recurring reports (monthly board decks, weekly ops reviews, quarterly business reviews), this model is brilliant. The reports live in Git, version-controlled alongside your dbt project. Changes are reviewed in PRs. There's no "who edited this chart last Tuesday?" mystery. The output is clean, readable, and shareable as a URL.
Here's a rough example of what an Evidence page looks like:
# Monthly Revenue Report

SELECT date_trunc('month', created_at) as month,
       sum(amount) as revenue
FROM orders
WHERE status = 'paid'
GROUP BY 1

<LineChart data={orders} x=month y=revenue />
That's the entire file. SQL inline, chart component below it, narrative around it.
The gotcha: Evidence is a reporting tool, not a BI tool. There's no ad-hoc exploration, no drag-and-drop chart builder, no "click on this bar to drill down." If your users need to ask follow-up questions the report didn't anticipate, they're stuck. It's perfect for known questions with known cadences. It's the wrong choice for exploratory analytics.
7. Streamlit — best for custom Python data apps
Streamlit isn't a dashboard tool in the traditional sense. It's a Python framework for building interactive data applications. But enough teams use it for dashboards that it deserves a spot on this list. If your use case requires custom logic (ML model predictions, simulation parameters, file upload + analysis, anything beyond "SELECT and chart"), Streamlit vs Grafana is the relevant comparison.
The power is in the flexibility. Any Python library works. Pandas, scikit-learn, Plotly, custom business logic. If you can write it in Python, you can put it behind a Streamlit widget. The prototyping speed is unmatched: a working data app in 50 lines of code.
I've seen teams use Streamlit for things none of the other tools on this list can touch: a demand forecasting app where users adjust parameters with sliders, a file-upload tool that runs data quality checks and returns a report, a customer segmentation explorer backed by a clustering model. These aren't dashboards. They're applications. Streamlit is the only open source tool on this list that can build them.
The gotcha: Streamlit apps are single-threaded by default. Each user session runs its own Python process. At 20+ concurrent users, you need to think about resource management, caching, and deployment infrastructure. Streamlit Community Cloud gives you free hosting but with sleep-on-idle behavior and limited resources. For production use, you'll either self-host on Kubernetes or use a managed platform.
How much ops work does each tool actually require?
This is the question people forget to ask before committing. Here's an honest breakdown:
                Setup time    Ongoing ops    Dependencies
Grafana:        ██░░░         ██░░░          Prometheus/Loki (if monitoring)
Metabase:       █░░░░         █░░░░          Java runtime or Docker
Superset:       ████░         ████░          Python, Redis, Celery, Postgres
Redash:         ██░░░         █░░░░          Docker, Redis, Postgres
Lightdash:      ██░░░         ██░░░          dbt project, Docker
Evidence:       █░░░░         █░░░░          Node.js, static deploy
Streamlit:      ██░░░         ███░░          Python runtime, process manager
Metabase and Evidence are the lightest. Superset is the heaviest by a wide margin. Grafana sits in the middle. Easy to install, but the Prometheus/Loki/Mimir ecosystem around it adds operational surface area fast. For a deeper breakdown of what self-hosting each tool actually entails, see our best self-hosted BI tools guide. If you want to go beyond a single tool and assemble a full pipeline, our guide to building a free analytics stack with open-source tools walks through the architecture.
What about managed alternatives?
Every tool on this list requires self-hosting (or paying for a managed cloud version). Self-hosting means ops work: updates, security patches, scaling, backups, SSL certificates, reverse proxy configuration. That's fine if you have a platform team. It's a hidden cost if you don't.
The real expense isn't the software license (they're all free). It's the 5-10 hours per month your team spends on maintenance, upgrades, and "why is the dashboard slow today?" troubleshooting. Over a year, that's a full engineer-month.
Fastero connects to the same databases these tools do (Postgres, MySQL, BigQuery, Snowflake, and 40+ more) but skips the self-hosting entirely. Describe the dashboard you want in plain English, and the AI agent writes the SQL and builds the charts. You get scheduled reports to Slack and email, threshold-based alerts, and embedded analytics out of the box.
If you want to build a KPI dashboard from Postgres without managing Docker containers or Kubernetes clusters, it's worth trying.
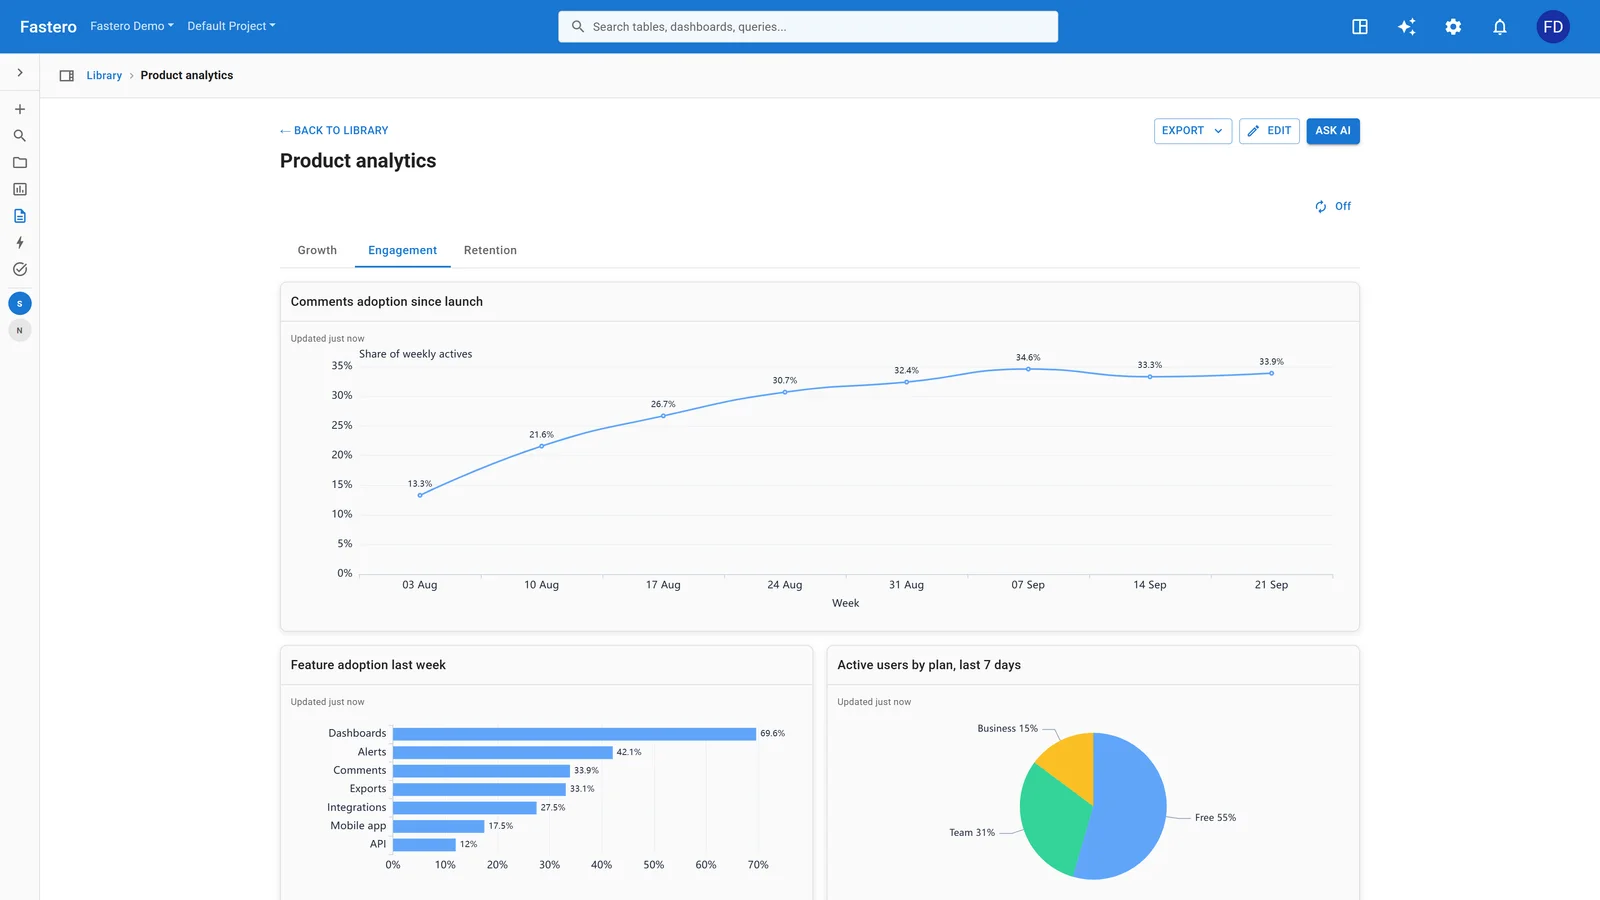
A dashboard in Fastero. Sample data.
How to actually pick one
Three questions cut through the noise:
- What's the data? Infrastructure metrics = Grafana. Business data in SQL databases = Metabase or Superset. Data that needs Python processing = Streamlit.
- Who's the audience? Engineers and SREs = Grafana. Business users who want self-service = Metabase. Data analysts at scale = Superset. Executives who want polished reports = Evidence.
- Do you have ops capacity? If yes, Superset gives you the most features. If no, Metabase is the least operational burden. If you'd rather not self-host at all, consider a managed tool.
Most teams don't need just one. I've seen plenty of companies run Grafana for infrastructure and Metabase for business dashboards side by side. That's not redundancy — it's using each tool where it's strongest. For tools beyond dashboarding -- orchestration, ETL, and pipeline management -- see our best tools for data engineering teams guide.
FAQ
Which open source dashboard tool is easiest to set up? Metabase. You can run it as a single JAR file or Docker container, point it at your database, and have a working dashboard in under an hour. Redash is similarly simple but less actively maintained.
Can Grafana replace a BI tool like Metabase or Superset? Not comfortably. Grafana excels at time-series monitoring but its SQL analytics and business reporting capabilities are secondary features. If your primary use case is business KPIs from a SQL database, Metabase or Superset will serve you better.
Is Apache Superset production-ready? Yes, but it requires real deployment effort. Companies like Airbnb, Dropbox, and Lyft run it at scale. The challenge isn't the software — it's the infrastructure: Redis, Celery, Postgres metadata store, and a reverse proxy. Plan for a week of setup, not an afternoon. For the full three-way open-source comparison, see Superset vs Metabase vs Redash.
Should I use Streamlit for dashboards? Only if your dashboard needs custom Python logic that SQL-based tools can't handle. For standard KPI dashboards, Metabase or Superset are simpler and scale better. Streamlit shines when the dashboard is really an interactive application.
What happened to Redash? Databricks acquired it in 2020 and open-sourced it, but active development has slowed. The core product still works, but it's falling behind Metabase and Superset in features, visualizations, and community momentum.
Do I need a data warehouse to use these tools? No. Grafana, Metabase, and Superset all connect directly to transactional databases like Postgres and MySQL. A warehouse helps at scale (offloading analytics queries from your production DB), but you can start without one. For cross-database queries without a warehouse, see how to connect multiple databases to one dashboard.
Try Fastero free — AI-powered dashboards from your database, with scheduling, alerts, and embedded analytics. No self-hosting required. No credit card required.