
Self-hosting your BI stack makes sense when your data can't leave your network, your compliance team says no to SaaS, or you've done the math and $800/month for Looker seats doesn't pencil out for a six-person data team. The trade-off is real, though: you own the uptime, the upgrades, and the 3 AM "why is the dashboard blank" Slack messages. Here are the eight tools worth evaluating in 2026.
Why self-host a BI tool at all?
Four reasons keep coming up in every conversation I've had with data teams who run their own BI infrastructure:
Data sovereignty. Your data never leaves your VPC. For healthcare, fintech, and government teams, this isn't a preference — it's a legal requirement. No vendor gets a copy of your patient records or transaction logs.
Compliance. SOC 2, HIPAA, GDPR Article 28 — each adds restrictions on where data can be processed. Self-hosting means you control the entire chain. No subprocessor agreements, no vendor DPAs to negotiate.
Cost control. SaaS BI pricing scales with users. Self-hosted pricing scales with compute. At 50+ users, the economics flip hard. One team I talked to cut their annual BI spend from $96k (Looker) to $14k (Superset on ECS) — though they hired a half-time DevOps person to keep it running, so the real savings were closer to $40k.
Customization. You can fork the code, add custom auth, build proprietary chart types, embed dashboards with your own branding. Try doing that with a SaaS vendor's iframe.
What does a self-hosted BI deployment actually look like?
Most production setups follow the same pattern regardless of which tool you pick:
                        ┌──────────────┐
        HTTPS           │              │
Users ─────────────────>│ Reverse Proxy│
                        │ (nginx/ALB)  │
                        └──────┬───────┘
                               │
                    ┌──────────┴──────────┐
                    │                     │
              ┌─────▼─────┐        ┌─────▼─────┐
              │  BI Tool   │        │  BI Tool   │
              │ (instance 1)│       │ (instance 2)│
              └─────┬──────┘       └──────┬─────┘
                    │                     │
              ┌─────▼─────────────────────▼─────┐
              │       Metadata DB               │
              │    (Postgres / MySQL)            │
              └─────────────┬───────────────────┘
                            │
              ┌─────────────▼───────────────────┐
              │       Your Data Sources          │
              │  (Postgres, BigQuery, Redshift,  │
              │   ClickHouse, Snowflake, etc.)   │
              └─────────────────────────────────┘
Every self-hosted BI tool needs a metadata database (usually Postgres) to store dashboards, users, and query history — separate from the databases you're actually analyzing. This is the thing people forget when they hear "just run a Docker container." You're running at least two services, plus a reverse proxy if you want HTTPS. On Kubernetes, add Redis or Celery workers for async queries and you're looking at 4-6 pods minimum.
Fastero
Connect your database. Ask questions. Get dashboards.
Postgres, BigQuery, Snowflake, and 10+ sources — live-connected, AI-powered, no dashboard builder learning curve.
Try free →The comparison table
| Tool | Deploy difficulty | Docker support | SQL editor | Embedding | Alerting | Community size | License |
|---|---|---|---|---|---|---|---|
| Metabase | Low | Official image | Yes (+ no-code) | Yes (paid) | Yes | Very large | AGPL 3.0 |
| Apache Superset | High | Official Helm chart | Yes (SQL Lab) | Limited | Yes | Very large | Apache 2.0 |
| Grafana | Low | Official image | Limited | Yes | Yes (strong) | Massive | AGPL 3.0 |
| Redash | Low | Docker Compose | Yes | Yes | Yes | Medium (stale) | BSD |
| Lightdash | Medium | Docker Compose | Via dbt | Yes | Scheduled | Growing | MIT |
| Cube | Medium | Docker image | API-only | Yes (headless) | Via integrations | Growing | MIT (core) |
| Evidence | Low | Static build | Markdown + SQL | Static pages | No | Small | MIT |
| Directus | Low | Official image | Admin UI | REST/GraphQL | Flows | Large | GPL 3.0 |
The 8 tools, with opinions
1. Metabase — easiest to deploy, hardest to outgrow
Metabase is what most teams should try first. Download a JAR, point it at Postgres, and you've got a working BI tool in under 10 minutes. The "question" builder lets non-SQL users drag and drop their way to charts. The SQL editor covers everyone else.
The self-hosted experience is genuinely good. A single Docker container works for teams up to about 30 users. Past that, you'll want to separate the app server from the metadata database and add a load balancer. Metabase handles this well — the architecture was designed for it.
Where it falls short: The open-source version restricts embedding, row-level permissions, and audit logging behind the paid "Pro" tier ($500/month). If you specifically need embedded analytics, the free tier will frustrate you. And the upgrade path from OSS to Pro requires re-licensing, not just toggling a feature flag.
For a deeper comparison with the next tool on this list, see Metabase vs Superset: Open-Source BI Compared.
2. Apache Superset — scales the furthest, hurts the most to set up
Apache Superset is the self-hosted BI tool you graduate to when Metabase's limits start pinching. SQL Lab is a proper SQL IDE in the browser — saved queries, Jinja templating, result previews before you chart. The visualization library (40+ chart types via ECharts) is the deepest of any open-source option. And because it's Apache-licensed, you can embed it without worrying about AGPL copyleft.
But the deployment story is where it earns its reputation. The official Docker Compose setup pulls in Postgres, Redis, Celery workers, a Celery beat scheduler, and the web server. That's five containers minimum. Getting it production-ready on Kubernetes means writing your own Helm values, tuning Celery concurrency, and figuring out why the metadata migrations broke after a minor version bump. I've seen teams spend two full sprints just getting SSO working.
The upgrade path is the worst in this list. Superset's metadata schema changes between versions, and the migration scripts occasionally fail on non-trivial datasets. Budget a full day per major upgrade, with a rollback plan.
We covered the Grafana vs Superset question in detail here: Grafana vs Apache Superset: Which Open-Source Dashboard.
3. Grafana — wrong tool for BI, right tool for everything else
I'll say it directly: Grafana is not a BI tool. It's an observability platform that people keep trying to use for business analytics because it's free and they already have it running. If your "dashboard" means CPU utilization over time or request latency by service, Grafana is the best tool on this list. If it means "quarterly revenue by region with drill-down," you'll fight it every step of the way.
That said, Grafana's self-hosted deployment is the smoothest here. One binary, one config file. It starts in seconds. The plugin ecosystem is enormous. And the alerting engine (Grafana Alerting, which replaced the legacy alerting in v9) is genuinely best-in-class for operational alerts.
Where it works for BI: Mixed-source dashboards. If you need Prometheus metrics and Postgres business data on the same screen, Grafana handles that better than anything else. The data-source plugin model means you can query 80+ backends from one dashboard. For an in-depth look at where Grafana's strengths end and BI tools begin, see Grafana vs Metabase and Grafana vs Kibana.
Where it doesn't: No SQL IDE. No saved query library. No chart type diversity beyond time series and tables. If your analysts think in SQL, they'll hate it.
4. Redash — simple and stalled
Redash was the scrappy alternative to Metabase for years: a clean SQL editor, scheduled query refreshes, and a dashboard builder that stayed out of your way. Deploy was a single Docker Compose file. It worked, it was fast, and it didn't try to be clever.
The problem is that development has effectively stopped. The last meaningful open-source release was years ago. The managed service shut down. The GitHub repo gets occasional community patches but no roadmap. Security patches are community-driven.
Should you still pick it? Only if you need the simplest possible "run SQL, see chart, share dashboard" workflow and you're comfortable maintaining a tool that nobody is actively developing. For new deployments in 2026, Metabase or Evidence cover the same ground with active maintainers. Our Metabase vs Redash comparison covers the migration path in detail.
5. Lightdash — the BI layer for dbt teams
Lightdash only makes sense if you already run dbt. It reads your dbt project directly — models, metrics, descriptions — and builds a BI layer on top. Your analysts explore data using the metrics and dimensions you've already defined in YAML, so there's no "which revenue number is right" problem. The semantic layer is your dbt project.
Self-hosting is Docker Compose with Postgres for metadata. Deployment isn't hard, but configuration is opinionated: you need a dbt project connected to a warehouse, dbt Cloud or a CLI runner, and a Git repo for the project. If you don't have that stack, Lightdash has nothing to show you.
The good: Metric consistency across the org. If your dbt model says revenue = sum(amount) where status = 'paid', every Lightdash chart uses that exact definition.
The catch: It's tightly coupled to dbt's release cycle. When dbt changes how metrics work (and they have, repeatedly), Lightdash has to chase. And the chart builder, while improving, still has fewer visualization options than Superset or Metabase.
6. Cube — not a dashboard, but the brains behind one
Cube is a headless semantic layer — it sits between your database and your front end, pre-aggregates data, and serves it via SQL, REST, or GraphQL APIs. It doesn't render charts. It provides the governed, cached data that your charts consume.
              ┌────────────────────────────┐
              │     Your front end         │
              │ (React, Streamlit, Retool) │
              └────────────┬───────────────┘
                           │ SQL / REST / GraphQL
              ┌────────────▼───────────────┐
              │         Cube API           │
              │  (pre-aggregation layer)   │
              └────────────┬───────────────┘
                           │
              ┌────────────▼───────────────┐
              │   Your data warehouse      │
              │ (Postgres, BigQuery, etc.) │
              └────────────────────────────┘
Self-hosting Cube means running the API server (Node.js) plus Redis for query orchestration. It's medium difficulty — not a single container, but not Superset's five-container parade either.
Best for: Teams building embedded analytics into their own product — SaaS companies shipping customer-facing dashboards. If you're just building internal dashboards, Cube adds a layer of indirection you probably don't need. Pick Metabase or Superset instead and skip the headless complexity.
7. Evidence — dashboards as code, literally
Evidence takes a radically different approach: your dashboards are Markdown files with SQL code blocks. Write SQL, pipe the results into chart components, commit it all to Git. The output is a static site — no running server, no metadata database, no state to manage.
This makes it the easiest tool on this list to "self-host," if you can even call it that. Run npm run build, deploy the static output to any web server. Nginx, S3 + CloudFront, Vercel, a Raspberry Pi — doesn't matter. No containers, no Postgres, no Redis.
The trade-off is interactivity. Your users can't write their own queries. They can't drill down into a chart unless you built that drill-down path in Markdown. Evidence is a reporting tool, not an exploration tool. For teams that want pixel-perfect, version-controlled reports that go out weekly, it's perfect. For ad-hoc analysis, look elsewhere.
8. Directus — the wild card
Directus isn't a BI tool in the traditional sense — it's an open-source data platform that wraps any SQL database in a REST/GraphQL API plus an admin dashboard. But teams keep showing up in BI-tool comparison threads because it solves a specific problem well: giving non-technical users a clean interface to view and manage data in Postgres or MySQL, with role-based access, without building a custom admin panel.
Self-hosting is a single Docker container plus your existing database. No separate metadata store needed — Directus uses your database directly (it creates its own tables alongside yours). Deployment is the easiest on this list after Evidence.
Where it fits: Internal tools, data entry workflows, and lightweight reporting for ops teams. If your "BI need" is really "let the account managers see and filter their own data in a nice table," Directus does that with less overhead than spinning up Metabase.
Where it doesn't fit: Anything requiring complex visualizations, cross-database joins, or analytical queries. Directus renders tables and basic charts. It's not building you a revenue waterfall.
Which one deploys the easiest?
Ranking from "download and run" to "clear your sprint":
Easiest                                              Hardest
  |                                                     |
  v                                                     v
Evidence ── Directus ── Grafana ── Metabase ── Redash ── Lightdash ── Cube ── Superset
 (static     (1 container) (1 binary)  (1 JAR     (Docker    (Docker     (Node +  (5+ containers,
  site)                                 or Docker)  Compose)   Compose    Redis)   Celery, Redis,
                                                              + dbt)              migrations)
Evidence wins because there's nothing to run. Superset loses because there's everything to run.
Which one scales the best?
Superset. It's not close. The Celery worker architecture means you can horizontally scale query execution independently from the web tier. Airbnb built it to handle thousands of concurrent users hitting a data warehouse. If you're willing to invest in the ops, Superset will outlast every other tool on this list.
Metabase scales well to about 100-200 concurrent users with proper tuning. Past that, you start hitting JVM memory limits and query queue contention. Grafana scales excellently for its use case (time-series dashboards) but wasn't designed for heavy analytical query loads.
Which one has the worst upgrade path?
Superset again. The metadata database migrations between major versions are fragile. I've personally watched a superset db upgrade command hang for 40 minutes on a moderately-sized installation, then fail on a foreign key constraint. The rollback was "restore from the Postgres backup you hopefully took."
Metabase's upgrades are smoother — usually just swap the JAR or Docker tag. Grafana is the gold standard: upgrade the binary, restart, done. Its backward compatibility commitment is serious.
What about a managed alternative?
If the deployment and upgrade burden is the part that's giving you pause — but you still want your data to stay in your own databases — that's the gap Fastero fills. Fastero is cloud-hosted, but it connects directly to your databases (including on-prem via SSH tunnels). Your data stays where it is. No ETL, no replication, no Docker containers to babysit. You get SQL and AI-powered dashboards without the infrastructure tax. It's a different trade-off than full self-hosting, but for many teams it's the right one.
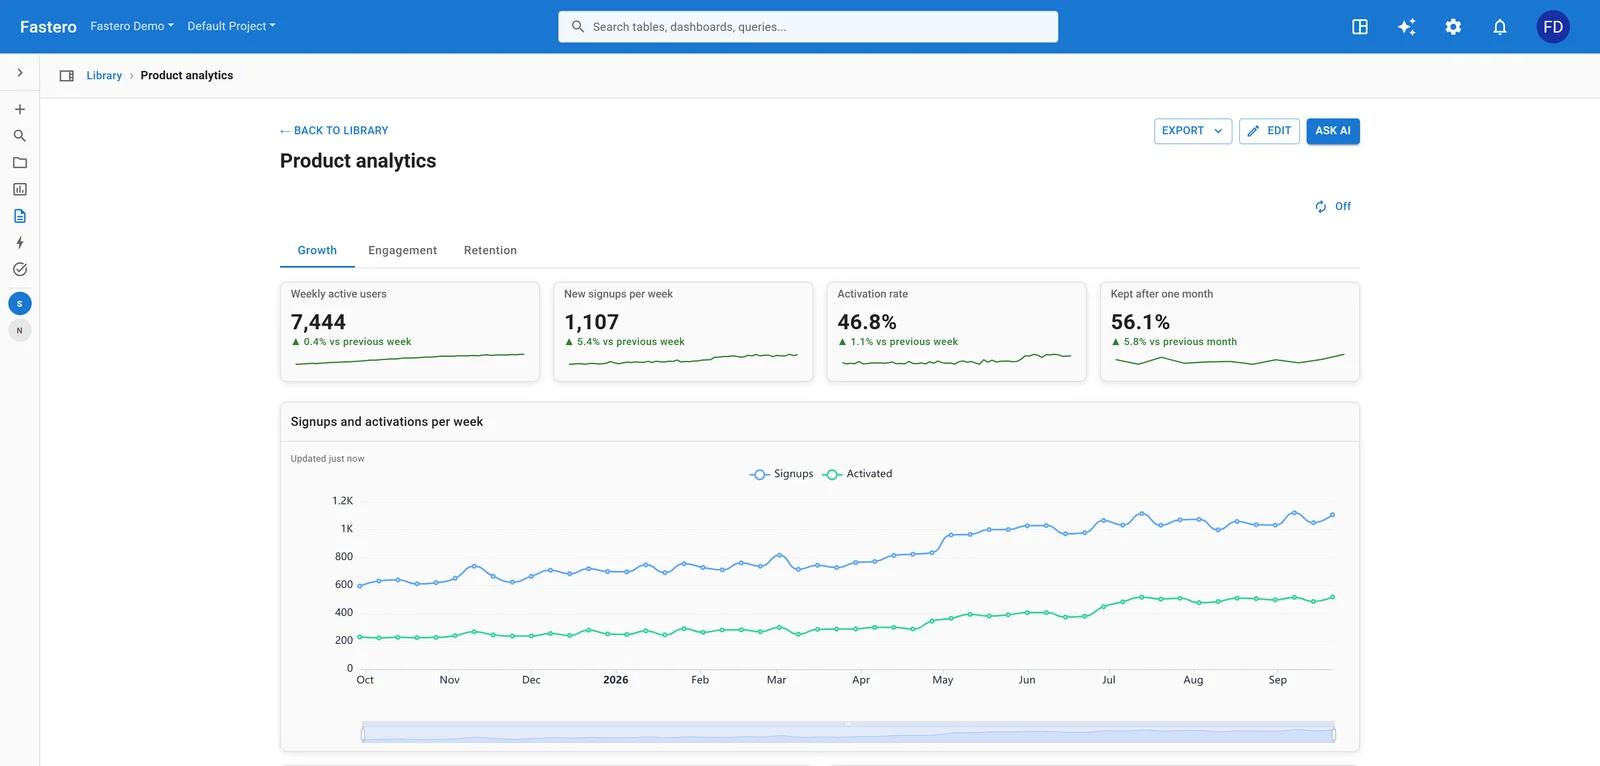
A dashboard in Fastero. Sample data.
For more on the broader open-source landscape, see our best open-source dashboard tools roundup.
FAQ
Do I need Kubernetes to self-host a BI tool?
No. Metabase, Grafana, Redash, and Directus all run fine on a single VM with Docker Compose. Kubernetes only becomes necessary when you need horizontal scaling (Superset) or you're already running everything else on K8s and want consistency. Don't add Kubernetes complexity just for a BI tool.
How do I handle authentication for self-hosted BI?
Most tools support LDAP and SAML/OIDC out of the box. Metabase and Superset both support Google OAuth and generic OIDC. Grafana has the broadest auth plugin ecosystem. For simpler setups, a reverse proxy with HTTP basic auth or Cloudflare Access works and takes 20 minutes to configure.
What's the real cost of self-hosting vs. SaaS BI?
The software is free. The cost is labor. Budget 4-8 hours/month for a simple Metabase or Grafana deployment (updates, backups, user management). Budget 16-30 hours/month for a production Superset cluster (migrations, worker tuning, debugging query timeouts). Multiply by your engineering hourly rate and compare against SaaS pricing at your user count. The crossover point is usually around 20-30 seats.
Can I embed self-hosted dashboards in my product?
Yes, with caveats. Metabase Pro ($500/month) and Superset both support iframe embedding. Grafana supports embedding individual panels. Cube was built for exactly this — headless API, you build the front end. Evidence generates static pages you can serve anywhere. Check the AGPL license terms for Metabase and Grafana if you're embedding in a commercial product — AGPL has copyleft implications that Apache 2.0 and MIT don't.
How do I back up a self-hosted BI tool?
Back up the metadata database. That's it. Dashboards, queries, user accounts, alert configurations — it's all in Postgres (or MySQL, depending on the tool). Use pg_dump on a cron job. Test the restore. The BI application itself is stateless — you can always re-pull the Docker image. The thing you can't recreate is the metadata.
Which self-hosted BI tool is best for a team of 5?
Metabase. It's not even a contest at that team size. Download the JAR, run it, connect your database. You'll have dashboards before lunch. Move to Superset only when Metabase's limits (embedding, row-level security, query volume) actually block you — not before. For the full small-team evaluation, see our best BI tools for small data teams.
Try Fastero free — connect any database, build dashboards with SQL or AI, no infrastructure to manage. No credit card required.