

I've seen this comparison come up in three different Slack channels this month. Someone posts "we need an open-source dashboard tool" and within five minutes, two camps form: the Grafana people and the Superset people. Both sides are right, and both sides are wrong, because they're usually talking past each other about what "dashboard" means.
Here's the thing: Grafana and Apache Superset look similar from 30,000 feet. Open source. Self-hostable. Charts. Dashboards. Connections to databases. But the moment you zoom in, you realize they have completely different DNA, different users, and different ideas about what a dashboard should do.
Let me break down the actual differences, because this decision matters more than most teams realize.
Different origin stories, different worldviews
Grafana was born in the monitoring world. It started as a fork of Kibana's dashboard UI, then quickly became the go-to tool for visualizing time-series metrics from Prometheus, InfluxDB, and Graphite. Its core question is: "Is the system healthy right now?" Every design decision flows from that premise — auto-refreshing panels, alerting rules, time-range selectors that default to "last 6 hours."
Apache Superset was born inside Airbnb's data team. It started as a tool called Caravel, then Panoramix, before settling on Superset. Its core question is: "What does the business data say?" It was designed for analysts who wanted to write SQL against a data warehouse and turn the results into charts — without waiting for the engineering team to build them a dashboard.
These origin stories aren't just trivia. They explain almost every difference between the two tools.
Grafana thinks in time series. Superset thinks in SQL result sets.
Grafana assumes your data is already being emitted by some system (Prometheus exporters, CloudWatch agents, StatsD collectors). Superset assumes your data lives in a database you can query.
Grafana's default user is an SRE or DevOps engineer watching a TV mounted on the office wall. Superset's default user is a data analyst writing queries in a SQL IDE.
SQL Lab — the feature that defines the split
If you want to understand the fundamental difference in one feature, look at SQL Lab.
Superset ships with a full interactive SQL IDE built into the browser. You connect a database, open SQL Lab, write queries, see results in a table, and then — with one click — turn that query into a chart and pin it to a dashboard. You can save queries, share them with teammates, schedule them, and use Jinja templating inside the SQL.
Grafana has nothing like this.
Yes, Grafana can connect to SQL databases (PostgreSQL, MySQL, ClickHouse). But the query experience is panel-level: you pick a data source, write a query in a small text box, and the results render in that specific panel. There's no standalone SQL workspace. No saved-query library. No "let me explore this dataset before I decide what chart to build."
For analysts who think in SQL, this is the dealbreaker. SQL Lab turns Superset into something closer to a lightweight Looker or Mode Analytics. Grafana's query model is designed for PromQL, LogQL, and other monitoring-specific languages that happen to also support SQL.
Fastero
Connect your database. Ask questions. Get dashboards.
Postgres, BigQuery, Snowflake, and 10+ sources — live-connected, AI-powered, no dashboard builder learning curve.
Try free →Visualization depth
Superset ships with 40+ chart types out of the box. Pie charts, sunbursts, treemaps, sankeys, geographic maps, pivot tables, box plots, waterfall charts, funnel charts, word clouds, chord diagrams. The chart gallery is genuinely impressive and keeps growing because the visualization layer is plugin-based (built on Apache ECharts).
Grafana's visualization library is more focused. It does time-series line charts, bar charts, gauges, stat panels, heatmaps, tables, and logs panels exceptionally well. The recent versions added some general-purpose panels (bar chart, pie chart), but the sweet spot is still time-series data. If you need a sunburst chart in Grafana, you're installing a community plugin and hoping it's maintained.
This isn't a knock on Grafana — it's a reflection of priorities. When your primary job is "show me CPU usage over the last 4 hours," you don't need a sankey diagram. When your primary job is "show the board how revenue flows through our product lines," you absolutely do.
The semantic layer question
Superset has a concept called "datasets" — essentially saved table/query definitions with metadata. You can define metrics (measures), group by dimensions, add calculated columns, and set up row-level security filters. This is a lightweight semantic layer. When an analyst builds a chart, they pick a dataset and choose from pre-defined metrics instead of writing raw SQL every time.
This matters because it creates consistency. If "Monthly Recurring Revenue" is defined once in the dataset, every chart that uses it calculates it the same way. No more "wait, which revenue number is this dashboard using?"
Grafana doesn't have an equivalent concept. Each panel has its own query. If you want the same metric in five panels, you write the same query (or variations of it) five times. There's no centralized metric definition layer. For monitoring use cases, this is fine — your Prometheus metrics already have consistent names. For business BI, it's a real gap.
If you care about a single source of truth for metric definitions, we wrote a deeper guide on how to define metrics as a single source of truth that covers the broader landscape.
Self-hosting: the honest comparison
Here's where Grafana pulls way ahead for small teams.
Grafana is a single binary. Download it, run it, done. It ships as a standalone Go binary with an embedded SQLite database for its own metadata. You can have it running in 60 seconds. The Docker image is small, the resource footprint is modest, and upgrades are straightforward.
Superset is a Python application with dependencies. A production Superset deployment needs: the Superset web server (Flask/Gunicorn), a metadata database (PostgreSQL recommended), Redis (for caching and async queries), Celery workers (for scheduled reports and long-running queries), and optionally a reverse proxy. The Docker Compose file in the repo has something like eight services.
I'm not exaggerating when I say self-hosting Superset is closer to deploying a small SaaS product than installing a tool. The official Superset documentation even warns about production deployment complexity.
Does it work? Absolutely — plenty of organizations run Superset at scale. But if you're a team of five and you just want a dashboard tool, the operational overhead of Superset is significant. Grafana wins the "I can get this running in an afternoon" contest by a mile.
For more on the self-hosting tradeoff across the whole BI landscape, our best BI tools page covers both managed and self-hosted options.
Managed options
Both tools have managed cloud offerings, which sidestep the self-hosting headache:
Grafana Cloud — Grafana Labs' own managed service. Includes Grafana, Prometheus (as Mimir), Loki for logs, and Tempo for traces. Generous free tier. Pricing scales with metrics volume and log ingestion. For teams already using Prometheus, it's the obvious choice.
Preset.io — The managed Superset offering, run by the original creator of Superset (Maxime Beauchemin, who also created Apache Airflow). Preset handles all the deployment complexity and adds collaboration features, SSO, and managed upgrades on top. If you want Superset without the ops burden, Preset is the answer.
Both managed options are solid. The decision between them still comes down to the fundamental question: are you building monitoring dashboards or business BI?
RBAC and security
Both tools support role-based access control, but the models are quite different.
Grafana's RBAC is folder-based. You organize dashboards into folders, assign teams to folders with viewer/editor/admin permissions, and that's mostly it. It's simple, which is both its strength and its limitation. Grafana 11 added more granular RBAC for enterprise features, but the core model is still folder-level.
Superset's RBAC goes deeper. You get dataset-level permissions (who can query what), row-level security (different users see different rows from the same dataset, based on filters), and dashboard-level access. This is closer to what you'd expect from an enterprise BI tool.
If you're running a monitoring stack where everyone on the SRE team should see everything, Grafana's model is perfect. If you're running a business analytics platform where the sales team should only see their region's data, Superset's row-level security matters.
For teams evaluating self-service analytics broadly, we compared several tools with different security models in our best self-service analytics tools guide.
When Grafana wins
I recommend Grafana when the use case is operational:
- Infrastructure monitoring. CPU, memory, disk, network — the bread and butter. Grafana + Prometheus is basically the industry standard.
- Application performance monitoring. Request latency, error rates, throughput. If you're watching HTTP percentiles, Grafana's histograms are purpose-built.
- Log exploration. Grafana + Loki gives you a structured log search experience that feels like a lightweight Splunk.
- Alerting on thresholds. "Tell me when error rate exceeds 5% for 10 minutes." Grafana's alerting is native, mature, and integrates with PagerDuty, Slack, OpsGenie, and everything else.
- Simple deployment. If the team doesn't have dedicated DevOps capacity, Grafana's single-binary deployment is a real advantage.
- Real-time refresh. Grafana dashboards auto-refresh every few seconds by default. The polling architecture is lightweight and designed for always-on screens.
- Log and metrics visualization. If you're weighing Grafana against the ELK stack for observability, see our Grafana vs Kibana comparison.
The mental model: "I need to know if something is broken, ideally before the customer notices." That's Grafana's home turf.
For a deeper comparison on the monitoring side, see our Grafana vs Datadog breakdown.
When Superset wins
I recommend Superset when the use case is analytical:
- Ad-hoc SQL exploration. SQL Lab alone justifies choosing Superset for analyst-heavy teams. The ability to write, save, and share queries in the browser — then turn them into charts — is genuinely powerful.
- Business intelligence dashboards. Revenue trends, cohort analyses, funnel breakdowns, geographic distribution, customer segmentation. These are charts that tell a story about the business, not about server health.
- Warehouse analytics. Superset connects natively to BigQuery, Snowflake, Redshift, Databricks, ClickHouse, Trino, and dozens of other analytical databases. It speaks their SQL dialects and handles large result sets well.
- Complex visualizations. When you need a sankey, a sunburst, a geographic choropleth, or a pivot table — Superset's chart gallery has you covered without plugins.
- Governed metric definitions. The dataset/semantic layer means analysts work from agreed-upon definitions, not ad-hoc queries that might calculate metrics differently.
- Row-level security. When different users or teams need to see filtered views of the same data, Superset's RLS handles it natively.
The mental model: "I need to understand what the business data says, and share those insights with people who don't write SQL." That's Superset's home turf. If your SQL team is also evaluating Redash, our Superset vs Redash for SQL teams comparison covers that narrower decision.
The honest comparison? Superset is the closest open-source thing to Looker or Tableau (see our full open-source alternatives to Tableau guide). Grafana is the closest open-source thing to Datadog's dashboards. They're answering different questions. For the enterprise angle on where Superset sits alongside Looker and Metabase, see our Looker vs Metabase vs Superset comparison.
The comparison table
I know how blog posts work. You scrolled here first. Here's an honest side-by-side:
| Dimension | Grafana | Apache Superset |
|---|---|---|
| Origin | Monitoring/observability | Business intelligence (born at Airbnb) |
| Primary data model | Time-series metrics | SQL result sets |
| SQL IDE | No | Yes (SQL Lab) |
| Chart types | ~15 core panels (time-series focused) | 40+ (general-purpose BI) |
| Semantic layer | No | Yes (datasets with metrics/dimensions) |
| Deployment | Single binary, trivial | Multi-service (web + Redis + Celery + DB) |
| Auto-refresh | Native, sub-second capable | Supported but not the default pattern |
| Alerting | Native, mature | Limited (scheduled reports, not threshold alerts) |
| Row-level security | No (folder-level RBAC) | Yes |
| Managed option | Grafana Cloud | Preset.io |
| Query languages | PromQL, LogQL, Flux, SQL | SQL (all major dialects) |
| Plugin ecosystem | Large (data sources + panels) | Growing (chart plugins via ECharts) |
| Primary users | SRE, DevOps, platform engineers | Data analysts, BI teams, business users |
| Closest commercial equivalent | Datadog dashboards | Looker / Tableau |
| Learning curve | Medium (varies by data source) | Medium-high (SQL + Superset concepts) |
The "can I just use one?" question
I hear this constantly. Someone wants to consolidate on a single tool because managing two feels wasteful.
Here's the honest truth: if you try to use Grafana for business BI, you'll end up writing ugly SQL in tiny panel query boxes, fighting the time-series-centric UI, and missing half the chart types you need. If you try to use Superset for infrastructure monitoring, you'll miss real-time refresh, native alerting, and the Prometheus/Loki integration that makes ops teams fast.
They're not competitors. They're complements. If you're evaluating Grafana against Metabase specifically, we wrote a detailed Grafana vs Metabase comparison covering that decision. For the Grafana vs Google's free dashboarding option, see Grafana vs Looker Studio.
Most organizations I've worked with that have both an SRE team and a data/analytics team end up running both. The SRE team gets Grafana (usually via Grafana Cloud). The analytics team gets Superset (often via Preset.io or a self-hosted instance). They coexist, they serve different users, and nobody is happy about having two tools — but they're less happy when they try to force one tool to do both jobs.
Where both tools fall short
Neither Grafana nor Superset handles the scenario where you need custom application logic in your dashboard. Neither lets you run Python code, call an API mid-render, build a form that writes back to a database, or embed an ML model prediction.
For that, you're in Streamlit/Dash/Panel territory. We covered that comparison in depth in our Streamlit vs Grafana and Grafana vs Python dashboards guides.
And neither tool solves the "I have data in six different sources and I need to join them before visualizing" problem particularly well. Grafana's mixed data sources feature is basic. Superset expects you to materialize cross-source joins in your warehouse first. If you're dealing with fragmented data across SaaS tools, CRMs, and databases, you usually need an integration or transformation layer underneath — which is actually the kind of problem Fastero was designed to solve, connecting data sources and letting you query across them before visualizing.
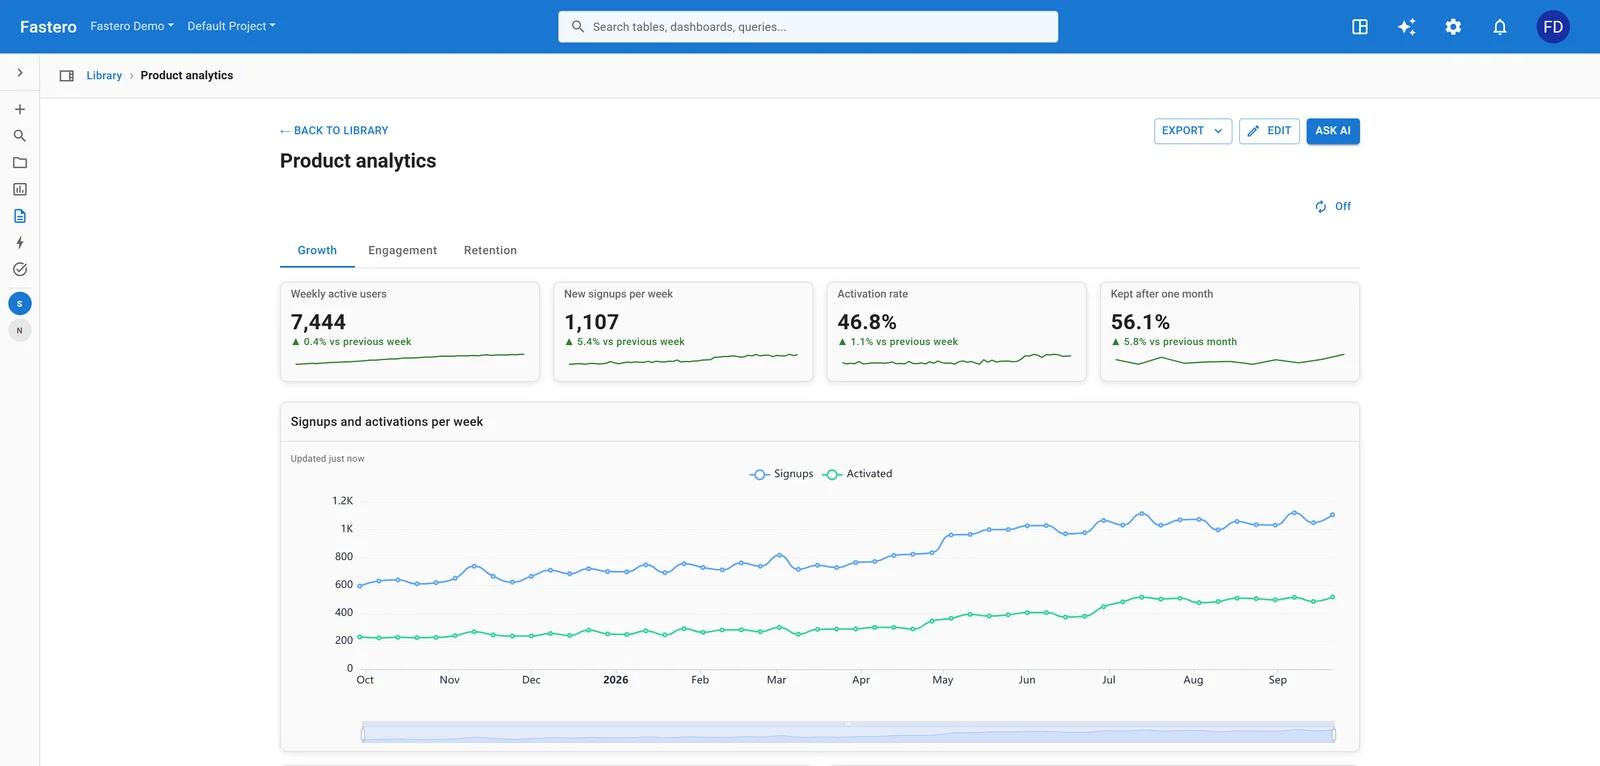
A dashboard in Fastero. Sample data.
What I'd do starting fresh in 2026
If I were setting up a data stack from scratch:
For ops/monitoring: Grafana Cloud. Don't self-host unless you have a specific reason (data residency, air-gapped network). The free tier is generous, the Prometheus integration is seamless, and you skip the maintenance entirely.
For business BI: Evaluate Superset (via Preset.io) against your actual requirements. If your analysts live in SQL and you want open-source flexibility, it's genuinely competitive with Looker and Tableau at a fraction of the cost. If you're a small team and SQL Lab feels like overkill, simpler options exist — check our best open-source dashboard tools roundup.
For custom data apps (the stuff neither covers): Streamlit or Dash, hosted with proper authentication and triggering. This is the third leg of the stool that the Grafana-vs-Superset debate ignores entirely.
The tools aren't interchangeable. Pick the one that matches your actual problem, not the one with the better marketing page.
Try Fastero free — connect your database, ask questions in plain English, and get dashboards that update themselves — no BI tool learning curve. No credit card required.
Last updated: July 2026. Both Grafana and Apache Superset release frequently — check their official docs (Grafana, Superset) for the latest features.