
Apache Superset is the closest open-source replacement for Tableau — 50+ visualization types, a SQL editor, row-level security, and active development under the Apache Foundation. If you need the broadest feature match and can self-host, start there. If you want something simpler, Metabase is easier to set up. If you'd rather skip self-hosting entirely, Fastero gives you AI-powered SQL analytics with a free tier and no infrastructure to manage.
Quick comparison
| Tool | Viz types | SQL editor | Self-host | Embedding | Learning curve | Best for |
|---|---|---|---|---|---|---|
| Apache Superset | 50+ | Yes (SQL Lab) | Yes | Yes | Moderate | Full Tableau replacement |
| Metabase | 15+ | Yes + visual builder | Yes | Yes (paid) | Low | Non-SQL teams who want dashboards fast |
| Redash | 15+ | Yes | Yes | Limited | Low | SQL-first teams who just need charts |
| Grafana | 20+ (via panels) | Yes (data sources) | Yes | Yes | Moderate | Time-series, infrastructure, ops |
| Lightdash | 10+ | Via dbt models | Yes | Yes | Moderate | dbt-native analytics |
| Evidence | Markdown-native | Inline SQL | Yes | Static export | Low (if you code) | Dashboards-as-code |
| Cube.js | None (headless) | Via API | Yes | Your own | High | Building custom analytics products |
| Fastero | 20+ | Yes + natural language | No (hosted) | Yes | Low | AI-powered analytics, no infra |
Where each tool sits
Here's the honest capability vs. complexity picture. The further right, the more it can do. The further up, the more work it takes to get there.
  Complexity
  (setup + maintain)
       ^
       |
  High |  Cube.js
       |              Superset
       |
  Med  |  Lightdash       Grafana
       |
  Low  |  Redash   Evidence   Metabase   Fastero
       |
       +----------------------------------------->
          Narrow                          Full BI
                   Capability
Redash and Evidence sit in the "simple but limited" corner. Superset and Cube.js offer the most power but demand the most ops work. Fastero and Metabase sit in the sweet spot — capable enough for real BI, easy enough that you're not hiring a DevOps engineer to keep them running.
Fastero
Connect your database. Ask questions. Get dashboards.
Postgres, BigQuery, Snowflake, and 10+ sources — live-connected, AI-powered, no dashboard builder learning curve.
Try free →Apache Superset
Superset is the tool people mean when they say "open-source Tableau." It ships with 50+ chart types, SQL Lab for ad-hoc queries, a dashboard builder with filter cross-linking, and row-level security that actually works. The Apache Foundation stewards it, which means it won't disappear when a startup runs out of runway.
I've deployed Superset for teams of 5 and teams of 200. It handles both, but it doesn't hide its complexity. You'll spend a day or two on initial setup (Docker Compose, database connections, caching with Redis), and you'll need someone who understands infrastructure to keep it healthy. The metadata database grows, the cache layer needs tuning, and upgrades occasionally require migration scripts.
Strengths: Feature depth rivals Tableau. Active community — new chart types and connectors land regularly. Role-based access and row-level security make it enterprise-viable.
Weaknesses: Self-hosting is real work. The UI, while improving, still feels more "data engineer" than "business analyst." Onboarding non-technical users takes effort.
Cost: Free (self-hosted). Preset offers managed Superset starting around $20/user/month.
For a deeper comparison with its closest competitor, see Metabase vs Superset.
Metabase
If Superset is the "full Tableau replacement," Metabase is the "get dashboards running before lunch" option. Download the JAR, run java -jar metabase.jar, point it at your database, and you're building charts. That's not marketing — I've done it in under 10 minutes on a fresh machine.
The click-through query builder is the real differentiator. Business users who can't write SQL can filter, group, and visualize data through a UI that feels closer to a spreadsheet than a database client. It won't do everything SQL Lab does, but 80% of stakeholder questions don't need raw SQL anyway.
Strengths: Fastest path from zero to working dashboards. The visual query builder actually works for non-technical users. Active development, strong community.
Weaknesses: Embedding is paywalled in the Pro tier. Advanced analytics (custom SQL functions, complex joins in the UI) are limited compared to Superset. Self-hosted performance can degrade with many concurrent users unless you tune the application database.
Cost: Free (self-hosted). Metabase Cloud starts at $85/month for 5 users.
Redash
Redash is the lightest tool on this list. You write SQL, it draws a chart. That's roughly the whole pitch, and for a long time it was enough.
Here's the reality in 2026: development slowed significantly after Databricks acquired it. The open-source repo still exists, you can still deploy it, and it still works fine for basic SQL-to-chart workflows. But don't expect new connector types, modern visualization options, or active security patches. It's in maintenance mode, not sunset mode.
Strengths: Dead simple mental model. If your team lives in SQL and just wants to share query results as charts, Redash does that without the overhead of a full BI platform.
Weaknesses: Development has stalled. The viz library feels dated. No visual query builder — SQL-only. Security patches are slow.
Cost: Free (self-hosted). No managed offering anymore.
For a direct comparison, see Superset vs Redash.
Grafana
Grafana started as a time-series visualization tool for DevOps — CPU graphs, latency percentiles, alert thresholds. It's still the best at that. But somewhere around 2023, teams started using it for business dashboards too, and it turns out Grafana is surprisingly good at it.
The plugin ecosystem is what makes this work. Grafana connects to Postgres, MySQL, BigQuery, Snowflake, Elasticsearch, Prometheus, InfluxDB, and dozens more through plugins. The alerting system is mature. And if your company already runs Grafana for infrastructure monitoring, adding a few business KPI panels to an existing deployment costs nothing.
Strengths: Best-in-class for time-series and operational data. Plugin ecosystem is enormous. Alerting is production-grade. If you already run it, adding business dashboards is free.
Weaknesses: The dashboard builder assumes you know what you want — it's not exploratory. Business users find the UI intimidating. Dashboards don't feel like Tableau or Metabase; they feel like monitoring panels.
Cost: Free (self-hosted). Grafana Cloud has a generous free tier; paid plans start at $29/month.
We broke down the Grafana vs. Superset decision in detail here: Grafana vs Apache Superset.
Lightdash
If your data team runs dbt, Lightdash is the BI layer that was built to sit directly on top of it. You define metrics and dimensions in your dbt YAML files, and Lightdash reads them. No re-defining "revenue" in yet another tool. One definition, one source of truth.
This is a narrow pitch, and it's supposed to be. Lightdash isn't trying to replace Tableau for everyone. It's trying to replace it for the growing number of teams where dbt is the transformation layer and everything downstream should respect its definitions.
Strengths: Tight dbt integration — metrics defined once, used everywhere. Growing fast in the analytics engineering community. Open-source with an active team.
Weaknesses: Useless without dbt. The visualization layer is functional but not deep — if you need 50 chart types, look at Superset. Smaller community than Metabase or Superset.
Cost: Free (self-hosted). Lightdash Cloud starts at $350/month.
Evidence
Evidence takes a radically different approach: your dashboards are Markdown files. You write SQL queries inline, reference the results in chart components, and deploy the whole thing through your existing CI/CD pipeline. git push and your dashboards update.
This sounds strange until you realize how many data teams already think in Git, PRs, and code review. Evidence gives them dashboards that work the same way. Version-controlled, reviewable, reproducible. No clicking through a GUI to build a chart that nobody can audit later.
Strengths: True dashboards-as-code. Git-native workflow. CI/CD deployment. Lightweight — no server to run in production (generates static sites).
Weaknesses: Non-technical users can't build or edit dashboards without touching code. The chart library is growing but still smaller than Superset or Grafana. Not suitable for ad-hoc exploration.
Cost: Free (open-source). Evidence Cloud offers managed hosting.
Cube.js
Cube.js is not a BI tool. It's the semantic and caching layer you'd build underneath a BI tool if you were starting from scratch. Define your data model, and Cube exposes it via SQL, REST, or GraphQL APIs. Then build whatever front end you want on top — React dashboards, embedded analytics, an AI interface.
Think of it as headless BI. The same way a headless CMS separates content from presentation, Cube separates the data model from the visualization layer. This is powerful if you're building a product with embedded analytics. It's overkill if you just want to see last month's sales.
Strengths: Clean API-first architecture. Pre-aggregation engine handles massive datasets. You own the front end completely. Works with any database.
Weaknesses: You have to build the front end. There's no "open Cube and see a dashboard" experience. Requires engineering resources to set up and maintain.
Cost: Free (self-hosted). Cube Cloud pricing is usage-based.
For more on how Cube fits into the BI ecosystem, see best open-source dashboard tools 2026.
Fastero
Fastero takes a different angle entirely. Instead of replicating Tableau's drag-and-drop paradigm in open source, it replaces the paradigm: ask questions in natural language or write SQL, and an AI agent builds the visualization, runs the analysis, and surfaces what's interesting in your data.
It's not open-source — I'll be upfront about that. But the free tier gives you SQL analytics, AI-powered dashboards, connectors to Postgres, MySQL, BigQuery, Snowflake, Stripe, HubSpot, and more. DuckDB under the hood handles cross-source joins, so you can query your CRM against your billing system in a single query without building a warehouse first.
The pitch is simple: if you're evaluating open-source tools because you don't want to pay $75/user/month for Tableau, and you also don't want to spend a weekend setting up Docker, Redis, and Nginx — Fastero gives you production analytics with zero infrastructure.
Strengths: No self-hosting. AI handles chart selection, SQL generation, and anomaly detection. Cross-source joins without a warehouse. Free tier with no credit card.
Cost: Free tier available. Paid plans for teams.
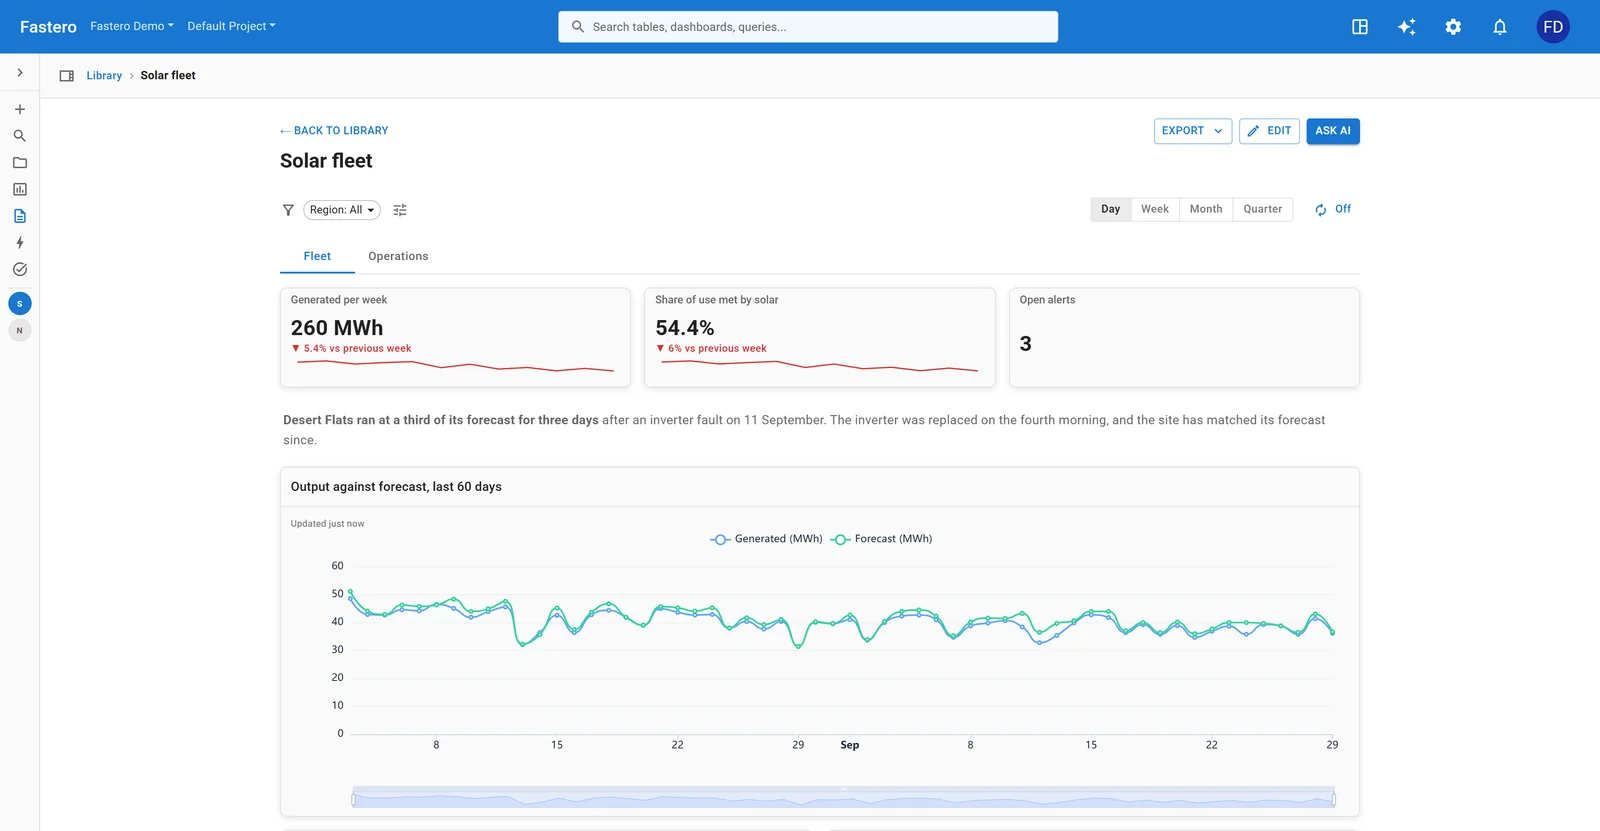
A dashboard in Fastero. Sample data.
Which one should you actually pick?
Decision trees are more useful than paragraphs, so here's mine:
Do you have a DevOps/infra person who can maintain a deployment?
  |
  +-- No --> Do you want AI analytics? --> Yes --> Fastero
  |          |
  |          +-- No --> Metabase Cloud or Grafana Cloud
  |
  +-- Yes --> What's your primary use case?
              |
              +-- Full BI replacement for Tableau --> Superset
              |
              +-- Time-series / ops dashboards --> Grafana
              |
              +-- dbt-native metrics --> Lightdash
              |
              +-- Dashboards-as-code --> Evidence
              |
              +-- Building analytics into a product --> Cube.js
              |
              +-- Lightweight SQL + charts --> Redash (but read the caveats)
Three honest rules I'd follow:
- Don't pick Superset because it has the most features. Pick it because you'll actually use those features and you have someone to keep it running. Unused features are just attack surface.
- Don't self-host to save money if your time costs more than the hosting. A 20-person team spending 10 hours/month maintaining Superset at $100/hour blended rate is spending $12,000/year on "free" software. Sometimes the managed option is cheaper.
- Start with the simplest tool that solves your problem. You can always migrate up. Migrating down from an over-engineered stack is painful.
FAQ
Is Apache Superset really a full replacement for Tableau?
For most use cases, yes. Superset covers 50+ visualization types, SQL exploration, scheduled reports, dashboards with cross-filters, and role-based access control. Where it falls short: Tableau's drag-and-drop UX is still more polished, the mapping/geospatial visualizations are deeper, and Tableau Prep (ETL) has no Superset equivalent. If your team relies heavily on those specific features, the gap matters. For standard BI — dashboards, charts, SQL exploration — Superset matches or exceeds Tableau.
Can non-technical users actually use these tools?
It depends on the tool. Metabase's visual query builder was designed for non-SQL users and genuinely works. Fastero's natural language interface handles questions in plain English. Superset and Grafana assume at least basic SQL knowledge. Evidence, Lightdash, and Cube.js are developer tools — don't hand them to a marketing manager expecting self-serve.
What about Looker Studio (Google Data Studio)?
It's free, but it's not open-source — Google controls it, and it's tightly coupled to the Google ecosystem. It works well for Google Analytics and BigQuery reporting. Outside that orbit, connector quality varies. We didn't include it here because the post focuses on tools you can self-host or that offer transparent infrastructure, not on proprietary freemium products from hyperscalers.
How does Tableau pricing actually work in 2026?
Tableau Creator is $75/user/month (billed annually). Tableau Explorer is $42/user/month. Tableau Viewer is $15/user/month. For a team of 5 Creators and 15 Viewers, you're looking at $4,500 + $2,700 = $7,200/year. Salesforce owns Tableau, so enterprise bundles can shift the math — but the sticker price is real for standalone purchases.
Should I pick open-source or a managed tool like Fastero?
Ask yourself one question: do you have an engineer who wants to run BI infrastructure? If yes, and they have the bandwidth, open-source gives you full control and zero license cost. If no — if "maintaining the dashboard tool" is a chore nobody signed up for — a managed tool saves you from the silent cost of self-hosting: upgrades, security patches, scaling, and the 2 AM pages when the caching layer goes down.
Try Fastero free — AI-powered dashboards and SQL analytics. No Tableau license, no self-hosting. Connect your databases and go. No credit card required.