 Fastero Dev Team
A window function calculates a value for each row from a set of related rows, without collapsing them the way GROUP BY does. That's what lets one query show each month's revenue next to the month before, a running total, and that month's share of the year, all on the same row.
The short answer: a window function is any function followed by OVER (...). Inside the brackets, PARTITION BY splits the rows into groups (like GROUP BY, but nothing is collapsed), ORDER BY sets the order within each group, and a frame such as ROWS BETWEEN 2 PRECEDING AND CURRENT ROW sets which rows count. The ones you'll use most are ROW_NUMBER, RANK and DENSE_RANK for numbering, LAG and LEAD for the row before and after, and SUM, AVG or COUNT with OVER for running totals, moving averages and shares. Every example below ran on the same sample sales database, written for PostgreSQL, with the result it returned.
Fastero
Connect your database. Ask questions. Get dashboards.
Postgres, BigQuery, Snowflake, and 10+ sources — live-connected, AI-powered, no dashboard builder learning curve.
Try free →The data
A PostgreSQL schema demo of invented sales: orders (order_id, customer_id, ordered_at, channel, status), order_items (quantity, unit_price), products (category) and customers (segment), with about 3,000 orders from 60 customers between September 2023 and September 2026. Revenue is quantity * unit_price, and cancelled orders are left out with status <> 'cancelled'. Our SQL query examples use the same tables.
1. ROW_NUMBER, RANK and DENSE_RANK: what happens with ties
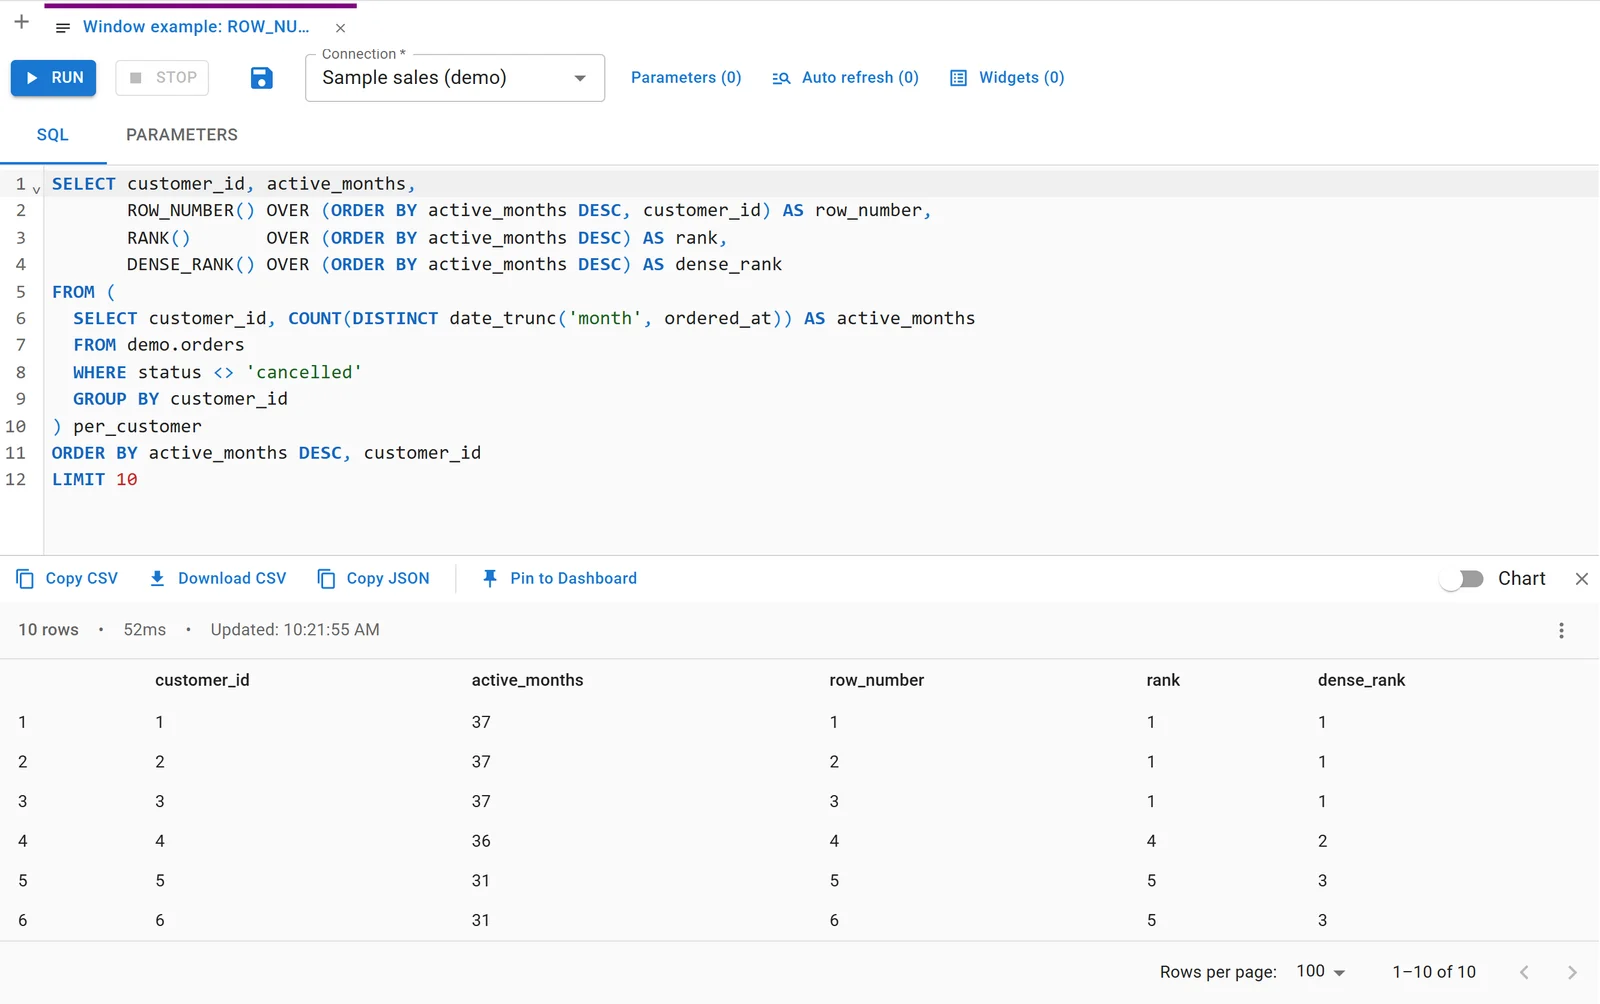
Customers ranked by how many months they ordered in:
SELECT customer_id, active_months,
       ROW_NUMBER() OVER (ORDER BY active_months DESC, customer_id) AS row_number,
       RANK()       OVER (ORDER BY active_months DESC) AS rank,
       DENSE_RANK() OVER (ORDER BY active_months DESC) AS dense_rank
FROM (
  SELECT customer_id, COUNT(DISTINCT date_trunc('month', ordered_at)) AS active_months
  FROM demo.orders
  WHERE status <> 'cancelled'
  GROUP BY customer_id
) per_customer
ORDER BY active_months DESC, customer_id
LIMIT 10| customer_id | active_months | row_number | rank | dense_rank |
|---|---|---|---|---|
| 1 | 37 | 1 | 1 | 1 |
| 2 | 37 | 2 | 1 | 1 |
| 3 | 37 | 3 | 1 | 1 |
| 4 | 36 | 4 | 4 | 2 |
| 5 | 31 | 5 | 5 | 3 |
| 6 | 31 | 6 | 5 | 3 |
| 7 | 30 | 7 | 7 | 4 |
| 8 | 27 | 8 | 8 | 5 |
| 10 | 25 | 9 | 9 | 6 |
| 12 | 25 | 10 | 9 | 6 |
Three customers ordered in all 37 months, and the three functions treat that tie differently:
ROW_NUMBERnumbers every row 1, 2, 3, and breaks ties however theORDER BYlets it. Add a tiebreaker (herecustomer_id) or the numbers can change between runs.RANKgives ties the same number and then skips: 1, 1, 1, then 4.DENSE_RANKgives ties the same number and doesn't skip: 1, 1, 1, then 2.
Use ROW_NUMBER to pick exactly one row per group (the latest order per customer, a de-duplicated row), and RANK or DENSE_RANK when ties should share a place.
2. LAG, LEAD, a running total and a moving average
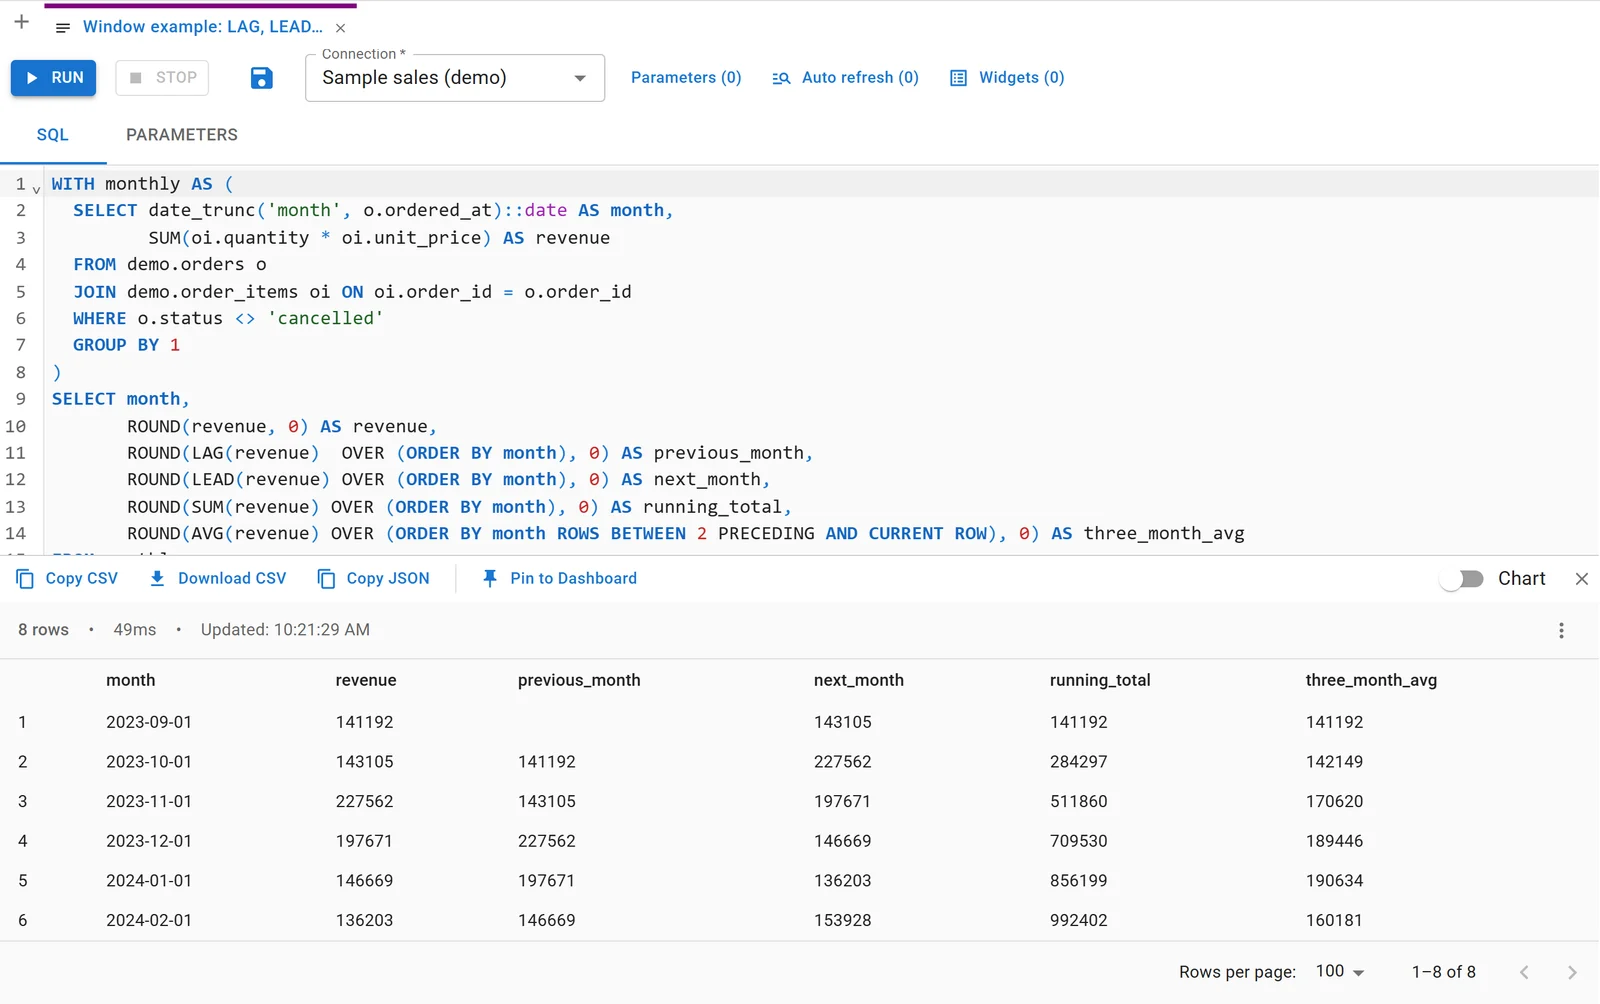
Each month's revenue beside the month before and after, the total so far, and the average of the last three months:
WITH monthly AS (
  SELECT date_trunc('month', o.ordered_at)::date AS month,
         SUM(oi.quantity * oi.unit_price) AS revenue
  FROM demo.orders o
  JOIN demo.order_items oi ON oi.order_id = o.order_id
  WHERE o.status <> 'cancelled'
  GROUP BY 1
)
SELECT month,
       ROUND(revenue, 0) AS revenue,
       ROUND(LAG(revenue)  OVER (ORDER BY month), 0) AS previous_month,
       ROUND(LEAD(revenue) OVER (ORDER BY month), 0) AS next_month,
       ROUND(SUM(revenue) OVER (ORDER BY month), 0) AS running_total,
       ROUND(AVG(revenue) OVER (ORDER BY month ROWS BETWEEN 2 PRECEDING AND CURRENT ROW), 0) AS three_month_avg
FROM monthly
ORDER BY month
LIMIT 8| month | revenue | previous_month | next_month | running_total | three_month_avg |
|---|---|---|---|---|---|
| 2023-09-01 | 141192 | 143105 | 141192 | 141192 | |
| 2023-10-01 | 143105 | 141192 | 227562 | 284297 | 142149 |
| 2023-11-01 | 227562 | 143105 | 197671 | 511860 | 170620 |
| 2023-12-01 | 197671 | 227562 | 146669 | 709530 | 189446 |
| 2024-01-01 | 146669 | 197671 | 136203 | 856199 | 190634 |
| 2024-02-01 | 136203 | 146669 | 153928 | 992402 | 160181 |
| 2024-03-01 | 153928 | 136203 | 138121 | 1146330 | 145600 |
| 2024-04-01 | 138121 | 153928 | 218877 | 1284451 | 142751 |
LAG(revenue)reads the previous row's value,LEAD(revenue)the next. Both take an offset and a default:LAG(revenue, 12, 0)is the same month a year earlier, or 0 if there isn't one.SUM(...) OVER (ORDER BY month)is a running total: the sum of every row up to this one.ROWS BETWEEN 2 PRECEDING AND CURRENT ROWlimits the average to this month and the two before it. Note the first two months: they average over one and two months, because there's nothing earlier. Leave those out, or label them, before you chart a moving average.
Window functions run after WHERE and GROUP BY, so to show only recent months with the right comparison, compute in a CTE and filter in the outer query. Filter first and the earliest month you keep has no previous month. Our post on month-over-month metrics in SQL covers that in depth.
3. Share of a total, per group
Each category's share of its year's revenue:
WITH yearly AS (
  SELECT EXTRACT(YEAR FROM o.ordered_at)::int AS year, p.category,
         SUM(oi.quantity * oi.unit_price) AS revenue
  FROM demo.orders o
  JOIN demo.order_items oi ON oi.order_id = o.order_id
  JOIN demo.products p ON p.product_id = oi.product_id
  WHERE o.status <> 'cancelled'
  GROUP BY 1, 2
)
SELECT year, category,
       ROUND(revenue, 0) AS revenue,
       ROUND(100 * revenue / SUM(revenue) OVER (PARTITION BY year), 1) AS pct_of_year
FROM yearly
WHERE year IN (2024, 2025)
ORDER BY year, revenue DESC| year | category | revenue | pct_of_year |
|---|---|---|---|
| 2024 | Hardware | 820229 | 35.4 |
| 2024 | Software | 672362 | 29.0 |
| 2024 | Services | 590976 | 25.5 |
| 2024 | Accessories | 231441 | 10.0 |
| 2025 | Software | 954165 | 33.3 |
| 2025 | Hardware | 926589 | 32.4 |
| 2025 | Services | 704941 | 24.6 |
| 2025 | Accessories | 275877 | 9.6 |
SUM(revenue) OVER (PARTITION BY year) is each year's total, repeated on every row of that year, with no ORDER BY, so it's the whole partition rather than a running total. Software overtook Hardware in 2025. Here the WHERE year IN (...) is safe to put in the same query: the partition is the year, so dropping whole years doesn't change the shares of the years you keep.
Trying to do this in a single grouped query is a common error. SUM(SUM(x)) OVER (PARTITION BY EXTRACT(YEAR FROM ordered_at)) failed for us with "column "o.ordered_at" must appear in the GROUP BY clause": the partition expression has to match the grouped column exactly. The CTE avoids the problem.
4. NTILE: split rows into equal groups
Customers in four groups by revenue, from the biggest down:
WITH customer_revenue AS (
  SELECT o.customer_id, SUM(oi.quantity * oi.unit_price) AS revenue
  FROM demo.orders o
  JOIN demo.order_items oi ON oi.order_id = o.order_id
  WHERE o.status <> 'cancelled'
  GROUP BY o.customer_id
)
SELECT quartile,
       COUNT(*) AS customers,
       ROUND(MIN(revenue), 0) AS smallest,
       ROUND(MAX(revenue), 0) AS largest,
       ROUND(SUM(revenue), 0) AS revenue
FROM (
  SELECT customer_id, revenue, NTILE(4) OVER (ORDER BY revenue DESC) AS quartile
  FROM customer_revenue
) q
GROUP BY quartile
ORDER BY quartile| quartile | customers | smallest | largest | revenue |
|---|---|---|---|---|
| 1 | 15 | 112785 | 1356883 | 5811341 |
| 2 | 15 | 85042 | 109645 | 1437486 |
| 3 | 15 | 29124 | 83179 | 575437 |
| 4 | 15 | 24687 | 29078 | 405714 |
NTILE(4) deals the sorted rows into four equal-sized groups. The top 15 customers bring in over 70% of the revenue. Note that NTILE splits by count, not by value: two customers with the same revenue can land in different quartiles.
Connect any database. Ask in plain English.
Start free →5. The gap between one row and the last, per group
How often customers in each segment come back, from the days between each order and the one before:
WITH gaps AS (
  SELECT o.customer_id, c.segment,
         o.ordered_at::date - LAG(o.ordered_at::date) OVER (PARTITION BY o.customer_id ORDER BY o.ordered_at) AS days_since_previous
  FROM demo.orders o
  JOIN demo.customers c ON c.customer_id = o.customer_id
  WHERE o.status <> 'cancelled'
)
SELECT segment,
       COUNT(days_since_previous) AS repeat_orders,
       ROUND(AVG(days_since_previous), 1) AS avg_days_between_orders,
       PERCENTILE_CONT(0.5) WITHIN GROUP (ORDER BY days_since_previous) AS median_days
FROM gaps
GROUP BY segment
ORDER BY avg_days_between_orders| segment | repeat_orders | avg_days_between_orders | median_days |
|---|---|---|---|
| Enterprise | 1143 | 11.5 | 9 |
| Mid-market | 815 | 25.2 | 11 |
| Small business | 800 | 35.0 | 11 |
PARTITION BY o.customer_id restarts LAG for each customer, so the first order of each has no previous one, and COUNT(days_since_previous) skips those NULLs. The medians are close while the averages are far apart: most customers in every segment reorder within about 11 days, and a few long gaps pull the small-business average up.
6. FIRST_VALUE, and a named window
A customer's orders with the channel of their first order and the days since it, using one window defined once:
SELECT customer_id, order_id, ordered_at::date AS order_date, channel,
       FIRST_VALUE(channel) OVER w AS first_channel,
       ordered_at::date - FIRST_VALUE(ordered_at::date) OVER w AS days_since_first_order,
       COUNT(*) OVER w AS order_number
FROM demo.orders
WHERE status <> 'cancelled' AND customer_id = 7
WINDOW w AS (PARTITION BY customer_id ORDER BY ordered_at ROWS BETWEEN UNBOUNDED PRECEDING AND CURRENT ROW)
ORDER BY ordered_at
LIMIT 6| customer_id | order_id | order_date | channel | first_channel | days_since_first_order | order_number |
|---|---|---|---|---|---|---|
| 7 | 115 | 2023-11-05 | Sales team | Sales team | 0 | 1 |
| 7 | 142 | 2023-11-16 | Sales team | Sales team | 11 | 2 |
| 7 | 169 | 2023-11-27 | Sales team | Sales team | 22 | 3 |
| 7 | 196 | 2023-12-08 | Partner | Sales team | 33 | 4 |
| 7 | 250 | 2023-12-30 | Partner | Sales team | 55 | 5 |
| 7 | 277 | 2024-01-15 | Sales team | Sales team | 71 | 6 |
The WINDOW w AS (...) clause names a window once, so three functions share it instead of repeating it. FIRST_VALUE is safe with this frame. Its partner LAST_VALUE is the classic trap: with the default frame, which ends at the current row, LAST_VALUE returns the current row's value. Use ROWS BETWEEN UNBOUNDED PRECEDING AND UNBOUNDED FOLLOWING when you mean the last row of the whole partition.
7. ROWS vs RANGE: why running totals jump on ties
The same running count with the default frame and with ROWS, on days with several orders:
SELECT ordered_at::date AS order_date, order_id,
       COUNT(*) OVER (ORDER BY ordered_at::date) AS range_count,
       COUNT(*) OVER (ORDER BY ordered_at::date, order_id ROWS BETWEEN UNBOUNDED PRECEDING AND CURRENT ROW) AS rows_count
FROM demo.orders
WHERE status <> 'cancelled' AND ordered_at >= DATE '2026-09-01'
ORDER BY ordered_at::date, order_id
LIMIT 8| order_date | order_id | range_count | rows_count |
|---|---|---|---|
| 2026-09-01 | 2854 | 4 | 1 |
| 2026-09-01 | 2855 | 4 | 2 |
| 2026-09-01 | 2856 | 4 | 3 |
| 2026-09-01 | 2857 | 4 | 4 |
| 2026-09-02 | 2858 | 8 | 5 |
| 2026-09-02 | 2859 | 8 | 6 |
| 2026-09-02 | 2860 | 8 | 7 |
| 2026-09-02 | 2861 | 8 | 8 |
With only ORDER BY, the frame is RANGE BETWEEN UNBOUNDED PRECEDING AND CURRENT ROW, and every row with the same date counts as the current row: all four orders on 1 September show 4. ROWS counts row by row. Neither is wrong; RANGE gives one running total per date, ROWS one per row.
The tiebreaker matters too. Our first run of this query ordered the ROWS window by date alone, and within 2 September it numbered the orders 7, 8, 5, 6: rows that tie on the ORDER BY come out in no particular order. Adding order_id made it 5, 6, 7, 8.
What differs between databases
The functions above are standard SQL and work in PostgreSQL, MySQL 8.0 and later, SQL Server, BigQuery, Snowflake, DuckDB and SQLite. The differences are around them:
| Feature | PostgreSQL | MySQL 8 | SQL Server | BigQuery | Snowflake |
|---|---|---|---|---|---|
QUALIFY (filter on a window function without a subquery) |
No | No | No | Yes | Yes |
Named WINDOW clause |
Yes | Yes | 2022 and later | Yes | No |
PERCENTILE_CONT |
As an aggregate | No | As a window function | As a window function | Both |
| Month of a date | date_trunc('month', d) |
DATE_FORMAT(d, '%Y-%m-01') |
DATETRUNC(month, d) (2022+) |
DATE_TRUNC(d, MONTH) |
DATE_TRUNC('month', d) |
QUALIFY is the one worth knowing about: in BigQuery, Snowflake, DuckDB and Databricks, SELECT ... QUALIFY ROW_NUMBER() OVER (PARTITION BY customer_id ORDER BY ordered_at DESC) = 1 keeps each customer's latest row with no subquery. Elsewhere, wrap the window function in a subquery or CTE and filter outside it, as in our top-N-per-group example.
FAQ
What is a window function in SQL?
A function that computes a value for each row from a set of related rows, its window, without collapsing the rows. It's written as a function followed by OVER (PARTITION BY ... ORDER BY ...).
What's the difference between RANK and DENSE_RANK?
Both give tied rows the same number. RANK then skips (1, 1, 1, 4); DENSE_RANK doesn't (1, 1, 1, 2). ROW_NUMBER never ties.
What's the difference between GROUP BY and PARTITION BY?
GROUP BY collapses each group to one row. PARTITION BY keeps every row and computes the function within its group, so you can show a row's value next to its group's total.
How do I calculate a running total in SQL?
SUM(value) OVER (ORDER BY date). Add PARTITION BY to restart it per group, and use ROWS BETWEEN UNBOUNDED PRECEDING AND CURRENT ROW with a tiebreaker if several rows share a date and you want one total per row.
Can I use a window function in WHERE?
No. Window functions run after WHERE, GROUP BY and HAVING. Filter on them in an outer query, or with QUALIFY in BigQuery, Snowflake, DuckDB and Databricks.
Does MySQL support window functions?
Yes, since MySQL 8.0. MySQL 5.7 and earlier don't have them.
Related reading:
- SQL query examples, with results
- How to compare month-over-month metrics in SQL
- How to calculate moving averages and rolling metrics in SQL
- How to calculate cohort retention in SQL
- Pandas groupby examples
Sources: every query and result above was run on the sample sales database in Fastero's demo workspace (PostgreSQL, invented data) on 11 November 2026. Function reference: PostgreSQL window functions and window function calls, MySQL window functions, SQL Server OVER clause and WINDOW clause, BigQuery window function calls, Snowflake window functions.
Try Fastero free — a SQL editor on your own database, with sample data to practise on, saved queries your team can reuse, and dashboards from any query. No credit card required.