 Fastero Dev Team
groupby is how pandas answers "per what?" questions: revenue per region, orders per month, the best product in each category. It splits a DataFrame into groups, applies a function to each, and combines the results. Most of what you need is one line; the trouble is remembering which of agg, transform, apply and filter you want, and what shape comes back.
The short answer: df.groupby("region")["revenue"].sum() sums revenue per region and returns a Series indexed by region. Use .agg(name=("column", "function")) for several named results at once, as_index=False or .reset_index() to get an ordinary DataFrame back, .transform() to put a group's value back on every row (for shares of a total), pd.Grouper(key="date", freq="MS") to group by month, and .filter() to keep whole groups that pass a test. All twelve examples below ran on pandas 3.0.3 with the output they printed.
Fastero
Jupyter notebooks for your team, with nothing to install.
Start a notebook or bring your .ipynb files. SQL cells query your databases with no password in the code, and a notebook runs now or on a schedule. Colleagues open it with their own login; viewers are free.
Try free →The data
A CSV of 4,734 invented orders from November 2024 to October 2026, the same sample file every new Fastero workspace starts with: order_id, order_date, region, channel, segment, category, product, quantity, unit_price and revenue.
import pandas as pd

df = pd.read_csv("sample-sales.csv", parse_dates=["order_date"])
1. One sum per group
df.groupby("region")["revenue"].sum()region
East 336183.61
North 417482.48
South 306511.46
West 413523.32
Name: revenue, dtype: float64The group keys become the index, sorted. Select the column before aggregating (["revenue"]), or pandas aggregates every column it can.
2. Several results at once, with your own names
df.groupby("region").agg(
    orders=("order_id", "count"),
    revenue=("revenue", "sum"),
    avg_order=("revenue", "mean"),
).round(0)
orders revenue avg_order
region
East 1082 336184.0 311.0
North 1310 417482.0 319.0
South 971 306511.0 316.0
West 1371 413523.0 302.0Named aggregation, new_name=("column", "function"), is the clearest way to get several columns back with names you chose. The function can be a string ("sum", "mean", "median", "nunique") or any function that takes a Series.
3. Two keys, back as an ordinary table
df.groupby(["region", "channel"], as_index=False)["revenue"].sum().round(0).head(6) region channel revenue
0 East Online 151488.0
1 East Partner 64769.0
2 East Sales team 119927.0
3 North Online 213297.0
4 North Partner 88855.0
5 North Sales team 115330.0With two keys you'd normally get a MultiIndex. as_index=False keeps the keys as columns, which is what you want before saving to CSV, charting or merging. .reset_index() after the fact does the same.
4. Unstack into a cross-table
df.groupby(["region", "channel"])["revenue"].sum().unstack().round(0)channel Online Partner Sales team
region
East 151488.0 64769.0 119927.0
North 213297.0 88855.0 115330.0
South 142073.0 67118.0 97320.0
West 201271.0 83592.0 128660.0unstack() moves the last key into the columns. df.pivot_table(index="region", columns="channel", values="revenue", aggfunc="sum") gives the same table in one call.
5. Group by month with pd.Grouper
df.groupby(pd.Grouper(key="order_date", freq="MS"))["revenue"].sum().round(0).tail(4)order_date
2026-07-01 84137.0
2026-08-01 87202.0
2026-09-01 64819.0
2026-10-01 57518.0
Freq: MS, Name: revenue, dtype: float64pd.Grouper groups a date column by a frequency: "MS" is month start, "W" weeks, "QS" quarter start, "YS" year start. It can sit in a list with other keys: df.groupby([pd.Grouper(key="order_date", freq="MS"), "channel"]).
6. transform: put the group's number back on every row
Each order's share of its region's revenue:
df["share_of_region"] = df["revenue"] / df.groupby("region")["revenue"].transform("sum") * 100
df[["order_id", "region", "revenue", "share_of_region"]].round(3).head(4)
order_id region revenue share_of_region
0 10001 North 680.28 0.163
1 10002 North 903.73 0.216
2 10003 West 190.68 0.046
3 10004 East 95.60 0.028This is the one people miss. agg returns one row per group; transform returns one value per original row, the group's result repeated, so you can divide by it, subtract it or compare with it. It's pandas' equivalent of SQL's SUM(...) OVER (PARTITION BY ...).
7. Count rows and distinct values
df.groupby("segment").agg(
    rows=("order_id", "size"),
    products=("product", "nunique"),
    regions=("region", "nunique"),
)
rows products regions
segment
Enterprise 610 13 4
Mid-market 1532 13 4
Small business 2592 13 4size counts rows, count counts non-missing values in a column, and nunique counts distinct values. This file has no missing values, so size and count would match here; on real data they often don't, and count is the one that quietly leaves gaps out.
8. Top N per group
The two best-selling products in each category:
(df.groupby(["category", "product"])["revenue"].sum().round(0)
   .groupby(level="category", group_keys=False).nlargest(2))
category product
Hardware Standing desk 370201.0
Office chair 213145.0
Services Training day 113989.0
Setup session 50537.0
Software Team plan 202190.0
Reporting add-on 105128.0
Supplies Cable kit 98516.0
Notebook set 57555.0
Name: revenue, dtype: float64Sum per product first, then group the result by its category level and take nlargest(2) within each. group_keys=False stops pandas adding the category a second time to the index.
Jupyter notebooks for your team.
Start free →9. A running total per group
monthly = df.groupby([pd.Grouper(key="order_date", freq="MS"), "channel"])["revenue"].sum().reset_index()
monthly["running_total"] = monthly.groupby("channel")["revenue"].cumsum()
monthly[monthly["order_date"] >= "2026-08-01"].round({"revenue": 0, "running_total": 0})
order_date channel revenue running_total
63 2026-08-01 Online 42460.0 651323.0
64 2026-08-01 Partner 16276.0 278386.0
65 2026-08-01 Sales team 28466.0 421655.0
66 2026-09-01 Online 30567.0 681890.0
67 2026-09-01 Partner 12386.0 290771.0
68 2026-09-01 Sales team 21867.0 443522.0
69 2026-10-01 Online 26239.0 708129.0
70 2026-10-01 Partner 13563.0 304335.0
71 2026-10-01 Sales team 17715.0 461237.0cumsum, cumcount, shift, diff and rank are group-wise when called on a groupby: each channel's running total starts from zero. shift(1) gives each group's previous row, like SQL's LAG. Sort by date first; a running total follows the row order.
10. filter: keep only the groups that pass a test
All orders of products with more than 150,000 in total revenue:
big = df.groupby("product").filter(lambda g: g["revenue"].sum() > 150_000)
big["product"].value_counts()
product
Team plan 455
Standing desk 340
Office chair 328
Name: count, dtype: int64filter returns the original rows, not a summary: here, every order of the three products that pass. It's HAVING in SQL terms. Our first attempt used 1,000,000 as the threshold and got an empty result, a reminder to look at the group totals before choosing a cut-off.
11. Several functions on one column
df.groupby("category")["quantity"].agg(["min", "median", "max"]) min median max
category
Hardware 1 3.0 4
Services 1 1.0 1
Software 1 3.0 4
Supplies 1 6.0 12A list of function names gives one column per function.
12. Sort groups by their result
df.groupby("product")["revenue"].sum().sort_values(ascending=False).round(0).head(5)product
Standing desk 370201.0
Office chair 213145.0
Team plan 202190.0
Training day 113989.0
Reporting add-on 105128.0
Name: revenue, dtype: float64Groups come back sorted by key. Sort by the value afterwards, and pass sort=False to groupby when you want them in the order they first appear and don't need sorting at all; it's faster on large data.
groupby in a notebook, next to the data
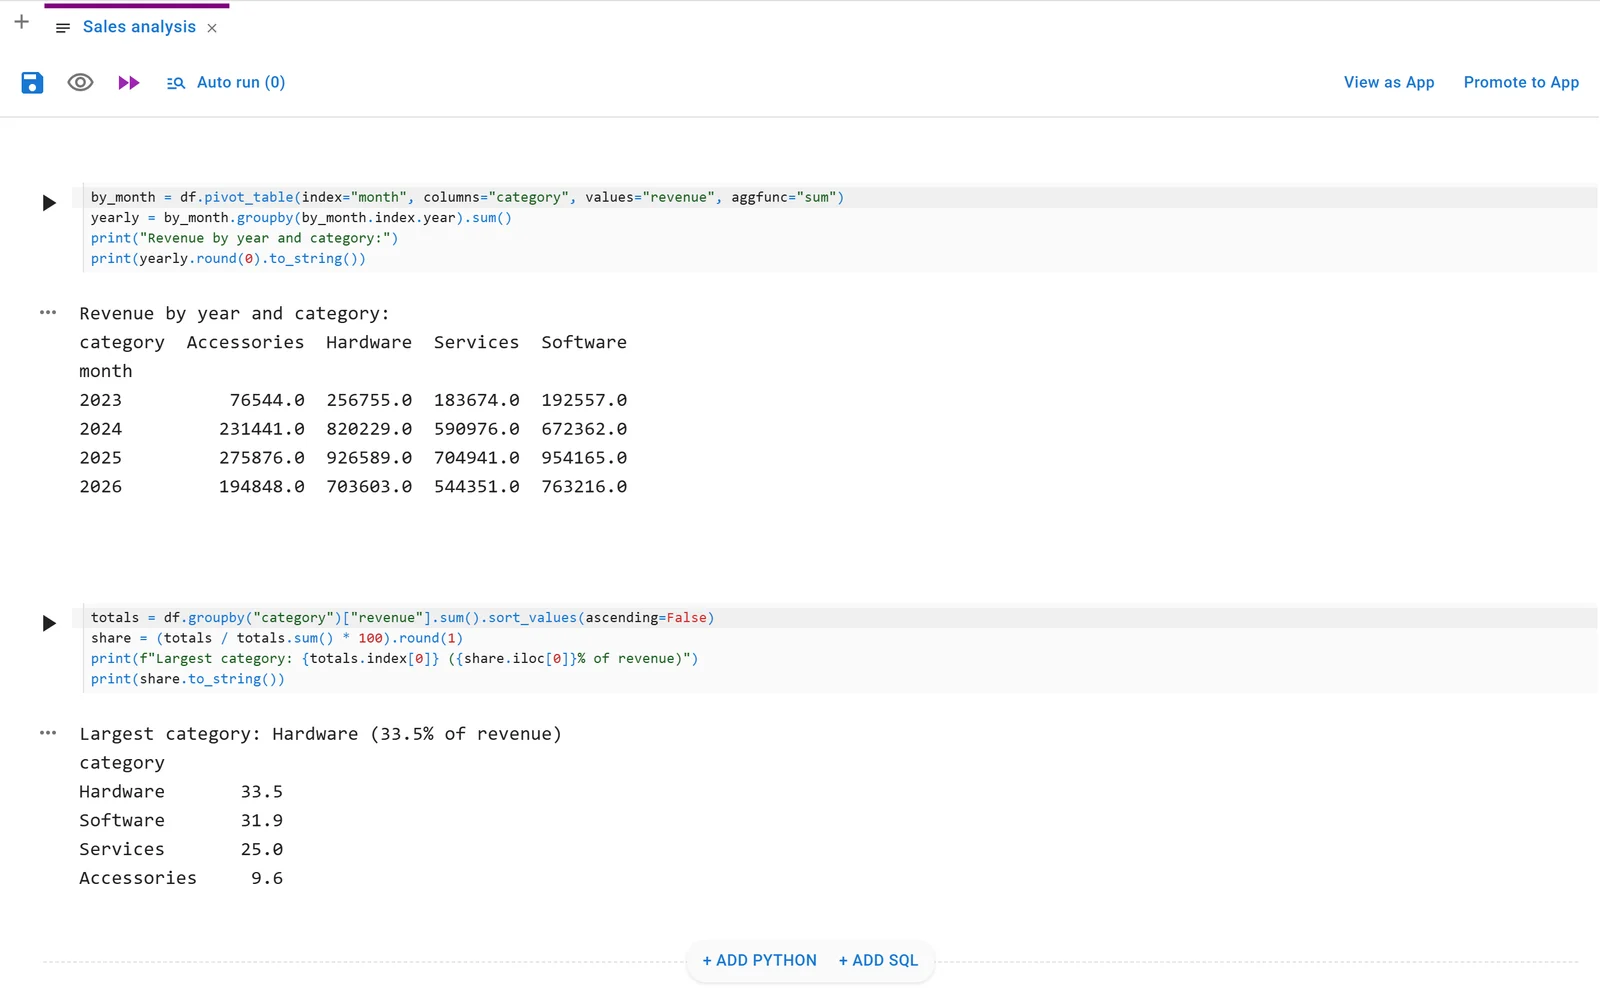
The same patterns work wherever pandas runs. This is a Fastero notebook on our demo workspace's sample sales database, using pivot_table and groupby to total revenue by year and category, and each category's share:
What changed in pandas 3
We checked these on pandas 3.0.3:
- Categories with no rows no longer appear. Grouping by a categorical column now behaves as
observed=True: a category with no rows is left out, where older pandas showed it with zero or NaN. Passobserved=Falseto get them back. applydoesn't see the grouping columns. The function you pass togroupby(...).apply()receives each group without the key columns. If your function needs the key, useg.nameinside it, or select the columns explicitly.- Missing keys are dropped. As before, rows whose group key is missing are left out unless you pass
dropna=False.
Pandas 3 also made copy-on-write the default, so chained assignment such as df[df.x > 0]["y"] = 1 no longer changes df. Use df.loc[df.x > 0, "y"] = 1.
agg, transform, apply or filter?
| You want | Use | Returns |
|---|---|---|
| One number per group | agg (or .sum(), .mean() ...) |
One row per group |
| The group's number on every row | transform |
Same length as the input |
| Whole groups that pass a test | filter |
The original rows of those groups |
| Anything else, group by group | apply |
Whatever your function returns; slowest, use last |
FAQ
How do I group by multiple columns in pandas?
Pass a list: df.groupby(["region", "channel"]). Add as_index=False to keep the keys as ordinary columns.
How do I count rows per group?
df.groupby("col").size() counts rows, including missing values; df.groupby("col")["other"].count() counts non-missing values in a column; .nunique() counts distinct values.
How do I get a DataFrame back instead of a Series?
Use as_index=False in groupby, or .reset_index() on the result. Named aggregation with .agg(...) also returns a DataFrame.
What's the difference between agg and transform?
agg returns one row per group. transform returns one value per original row, the group's result repeated, so it lines up with the original DataFrame.
How do I group by month in pandas?
Group by a monthly pd.Grouper, or by the dates turned into months. Make sure the column is a datetime first, with parse_dates or pd.to_datetime:
df.groupby(pd.Grouper(key="date_col", freq="MS"))
df.groupby(df["date_col"].dt.to_period("M"))
Is groupby slow?
Built-in aggregations (sum, mean, count, nunique) are fast. apply with a Python function is much slower on many groups; prefer an aggregation or transform when one exists.
Related reading:
- SQL window functions, with results
- SQL vs pandas: when to use each
- Polars vs pandas
- DuckDB vs pandas
- Jupyter notebook online
Sources: every example ran on pandas 3.0.3 (Python 3.14) on 11 November 2026 against Fastero's sample sales CSV of invented orders; the notebook screenshot is from Fastero's demo workspace. Reference: pandas groupby user guide, DataFrame.groupby, pandas 3.0 release notes.
Try Fastero free — Jupyter notebooks next to your team's databases, with pandas installed, SQL cells, and scheduled runs on the Free plan. No credit card required.