 Fastero Dev Team
Most lists of SQL examples show a query and stop. You can't tell whether it runs, or what it gives back. Every query below was run on the same small sales database, and each one is followed by the rows it actually returned, so you can check your own version against it.
The short answer: the queries that cover most day-to-day analysis are a GROUP BY with a sum, a join across two or three tables, a date_trunc by month, HAVING to filter groups, a LEFT JOIN to find what's missing, and four window functions: LAG for month-over-month change, RANK for "top N per group", SUM() OVER for running totals, and ROW_NUMBER for the latest row per customer. All 17 are below with their results. They're written for PostgreSQL; a table near the end lists what to change for MySQL, SQL Server and BigQuery.
Fastero
Connect your database. Ask questions. Get dashboards.
Postgres, BigQuery, Snowflake, and 10+ sources — live-connected, AI-powered, no dashboard builder learning curve.
Try free →The sample database
Four tables of invented sales data: 2,967 orders from 60 customers between September 2023 and September 2026, in a PostgreSQL schema called demo.
| Table | Columns used below | Rows |
|---|---|---|
demo.orders |
order_id, customer_id, ordered_at, channel, status |
2,967 |
demo.order_items |
order_id, product_id, quantity, unit_price |
8,653 |
demo.products |
product_id, name, category |
24 |
demo.customers |
customer_id, company, segment, country |
60 |
An order's revenue is the sum of quantity * unit_price over its items. Orders have a status of completed, pending or cancelled, and 149 were cancelled, so nearly every query below leaves them out with WHERE o.status <> 'cancelled'. Forgetting that filter is the most common reason two reports disagree.
Basic queries
1. Filter, sort and limit
The five most recent cancelled online orders:
SELECT order_id, customer_id, ordered_at, channel
FROM demo.orders
WHERE status = 'cancelled'
  AND channel = 'Online'
ORDER BY ordered_at DESC
LIMIT 5| order_id | customer_id | ordered_at | channel |
|---|---|---|---|
| 2958 | 39 | 2026-09-25 16:00 | Online |
| 2935 | 53 | 2026-09-21 13:00 | Online |
| 2841 | 14 | 2026-08-27 09:00 | Online |
| 2817 | 21 | 2026-08-19 15:00 | Online |
| 2800 | 52 | 2026-08-14 08:00 | Online |
WHERE filters rows before anything else happens; ORDER BY ... DESC puts the newest first; LIMIT keeps the first five.
2. Totals per group, across three tables
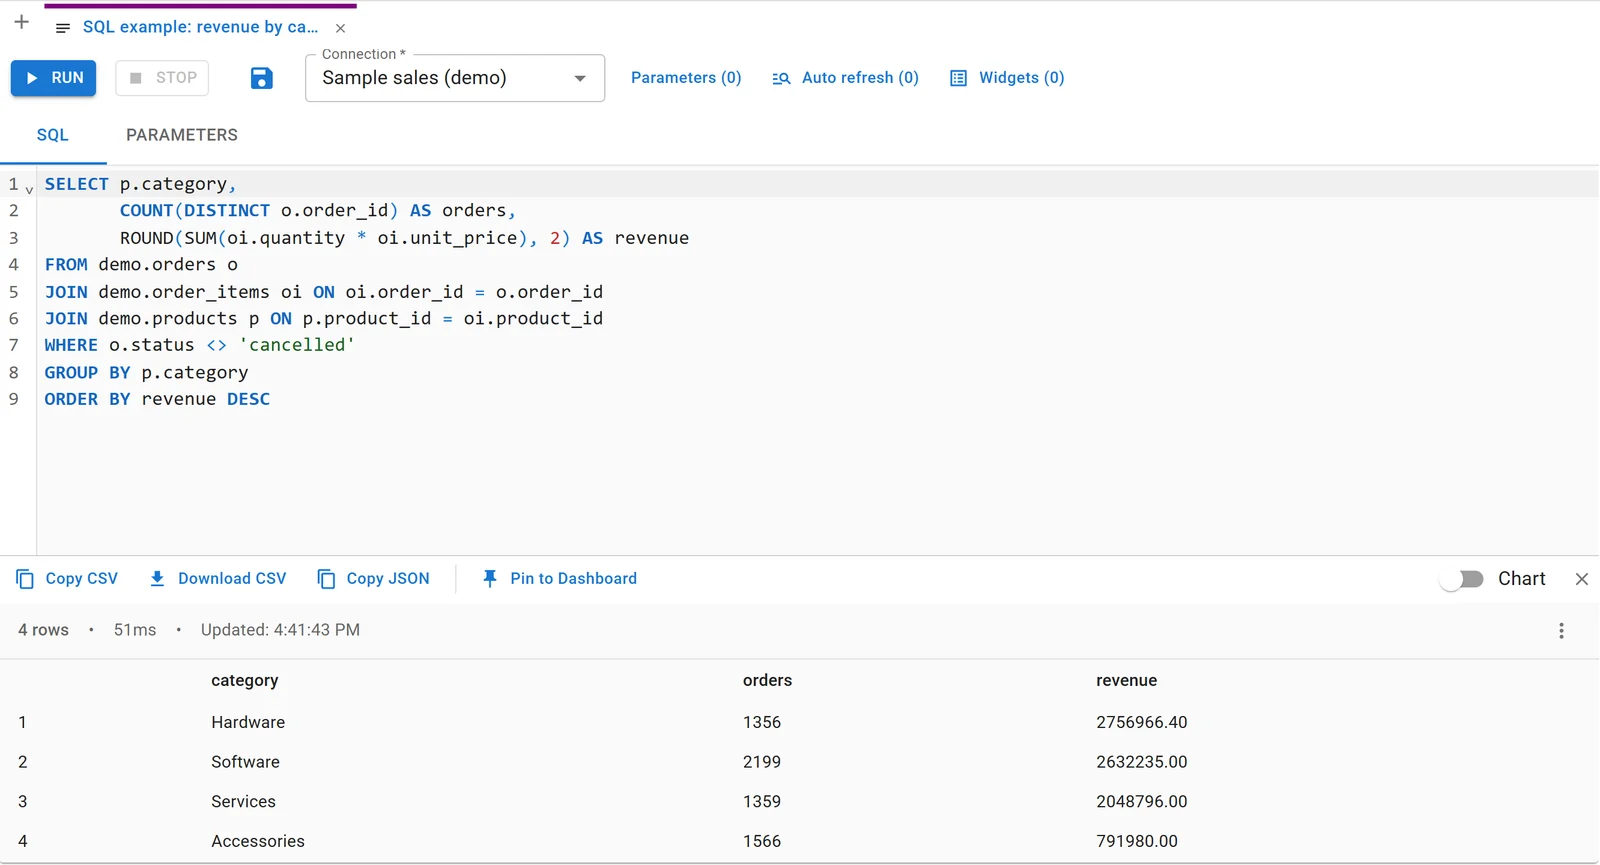
Revenue and orders by product category. The category lives on the product, the price on the order item and the status on the order, so this needs all three:
SELECT p.category,
       COUNT(DISTINCT o.order_id) AS orders,
       ROUND(SUM(oi.quantity * oi.unit_price), 2) AS revenue
FROM demo.orders o
JOIN demo.order_items oi ON oi.order_id = o.order_id
JOIN demo.products p ON p.product_id = oi.product_id
WHERE o.status <> 'cancelled'
GROUP BY p.category
ORDER BY revenue DESC| category | orders | revenue |
|---|---|---|
| Hardware | 1356 | 2756966.40 |
| Software | 2199 | 2632235.00 |
| Services | 1359 | 2048796.00 |
| Accessories | 1566 | 791980.00 |
COUNT(DISTINCT o.order_id) matters here: after the join there is one row per order item, so a plain COUNT(*) would count items, not orders. An order with products from two categories counts once in each, which is why the four order counts add up to more than the 2,818 orders that weren't cancelled.
3. Share of the total
What share of orders each sales channel brought in:
SELECT channel,
       COUNT(*) AS orders,
       ROUND(100.0 * COUNT(*) / SUM(COUNT(*)) OVER (), 1) AS pct_of_orders
FROM demo.orders
WHERE status <> 'cancelled'
GROUP BY channel
ORDER BY orders DESC| channel | orders | pct_of_orders |
|---|---|---|
| Online | 1003 | 35.6 |
| Sales team | 978 | 34.7 |
| Partner | 837 | 29.7 |
SUM(COUNT(*)) OVER () is the total across all groups, computed after the GROUP BY, so you get the percentage without a subquery. Write 100.0, not 100: in PostgreSQL and SQL Server, an integer divided by an integer drops the decimals.
4. Filter groups with HAVING
Customers with 80 or more orders:
SELECT c.company, c.segment, COUNT(o.order_id) AS orders
FROM demo.customers c
JOIN demo.orders o ON o.customer_id = c.customer_id
WHERE o.status <> 'cancelled'
GROUP BY c.company, c.segment
HAVING COUNT(o.order_id) >= 80
ORDER BY orders DESC| company | segment | orders |
|---|---|---|
| Company B1001 | Enterprise | 290 |
| Company C1002 | Enterprise | 137 |
| Company D1003 | Enterprise | 109 |
| Company E1004 | Enterprise | 92 |
| Company F1005 | Enterprise | 82 |
WHERE filters rows before grouping; HAVING filters the groups after. A condition on an aggregate such as COUNT can only go in HAVING.
Joins
5. Find what's missing with a LEFT JOIN
Customers whose last order was more than 90 days before the latest order in the data (28 September 2026), or who never ordered:
SELECT c.company, c.country, MAX(o.ordered_at)::date AS last_order
FROM demo.customers c
LEFT JOIN demo.orders o
  ON o.customer_id = c.customer_id AND o.status <> 'cancelled'
GROUP BY c.company, c.country
HAVING MAX(o.ordered_at) < DATE '2026-09-28' - INTERVAL '90 days'
    OR MAX(o.ordered_at) IS NULL
ORDER BY last_order NULLS FIRST
LIMIT 5| company | country | last_order |
|---|---|---|
| Company O1040 | United States | 2026-06-15 |
| Company V1047 | United Kingdom | 2026-06-15 |
| Company Z1025 | United States | 2026-06-22 |
| Company U1020 | United States | 2026-06-29 |
A LEFT JOIN keeps every customer, with NULLs where there's no matching order. The status filter sits in the ON clause on purpose: put it in WHERE and customers with no orders drop out, because their NULL status fails the test. Here every customer has ordered, so only four lapsed ones come back.
Dates
6. Totals per month
SELECT date_trunc('month', o.ordered_at)::date AS month,
       ROUND(SUM(oi.quantity * oi.unit_price), 0) AS revenue
FROM demo.orders o
JOIN demo.order_items oi ON oi.order_id = o.order_id
WHERE o.status <> 'cancelled'
  AND o.ordered_at >= DATE '2026-01-01'
GROUP BY 1
ORDER BY 1| month | revenue |
|---|---|
| 2026-01-01 | 202959 |
| 2026-02-01 | 228162 |
| 2026-03-01 | 255592 |
| 2026-04-01 | 277362 |
| 2026-05-01 | 229914 |
| 2026-06-01 | 292342 |
| 2026-07-01 | 270162 |
| 2026-08-01 | 262633 |
| 2026-09-01 | 324743 |
date_trunc('month', ...) rounds each timestamp down to the first of its month, so all of a month's orders share one value to group on. GROUP BY 1 means "group by the first column in the SELECT".
7. Orders by day of the week
SELECT TO_CHAR(ordered_at, 'Dy') AS weekday,
       EXTRACT(ISODOW FROM ordered_at) AS day_number,
       COUNT(*) AS orders
FROM demo.orders
WHERE status <> 'cancelled'
GROUP BY 1, 2
ORDER BY 2| weekday | day_number | orders |
|---|---|---|
| Mon | 1 | 497 |
| Tue | 2 | 497 |
| Wed | 3 | 492 |
| Thu | 4 | 493 |
| Fri | 5 | 501 |
| Sat | 6 | 172 |
| Sun | 7 | 166 |
Grouping on the day number as well as the name lets you sort Monday to Sunday instead of alphabetically. ISODOW numbers Monday 1 and Sunday 7; plain DOW starts at Sunday = 0.
Window functions
A window function computes a value for each row from a set of related rows, without collapsing them the way GROUP BY does. These four cover most of what analysts use them for.
8. Month-over-month change and year to date
WITH monthly AS (
  SELECT date_trunc('month', o.ordered_at)::date AS month,
         SUM(oi.quantity * oi.unit_price) AS revenue
  FROM demo.orders o
  JOIN demo.order_items oi ON oi.order_id = o.order_id
  WHERE o.status <> 'cancelled'
  GROUP BY 1
)
SELECT month,
       ROUND(revenue, 0) AS revenue,
       ROUND(LAG(revenue) OVER (ORDER BY month), 0) AS previous_month,
       ROUND(100 * (revenue / LAG(revenue) OVER (ORDER BY month) - 1), 1) AS growth_pct,
       ROUND(SUM(revenue) OVER (PARTITION BY date_trunc('year', month) ORDER BY month), 0) AS year_to_date
FROM monthly
WHERE month >= DATE '2026-05-01'
ORDER BY month| month | revenue | previous_month | growth_pct | year_to_date |
|---|---|---|---|---|
| 2026-05-01 | 229914 | 229914 | ||
| 2026-06-01 | 292342 | 229914 | 27.2 | 522256 |
| 2026-07-01 | 270162 | 292342 | -7.6 | 792418 |
| 2026-08-01 | 262633 | 270162 | -2.8 | 1055051 |
| 2026-09-01 | 324743 | 262633 | 23.6 | 1379794 |
Look at May. LAG reads the previous row, and the WHERE month >= ... filter runs before the window functions, so May has no April to compare with, and its "year to date" restarts at May. To show the last five months with the right comparisons, compute everything first and filter in an outer query. Our editor screenshot below shows the version that starts in January, where the running total is right.
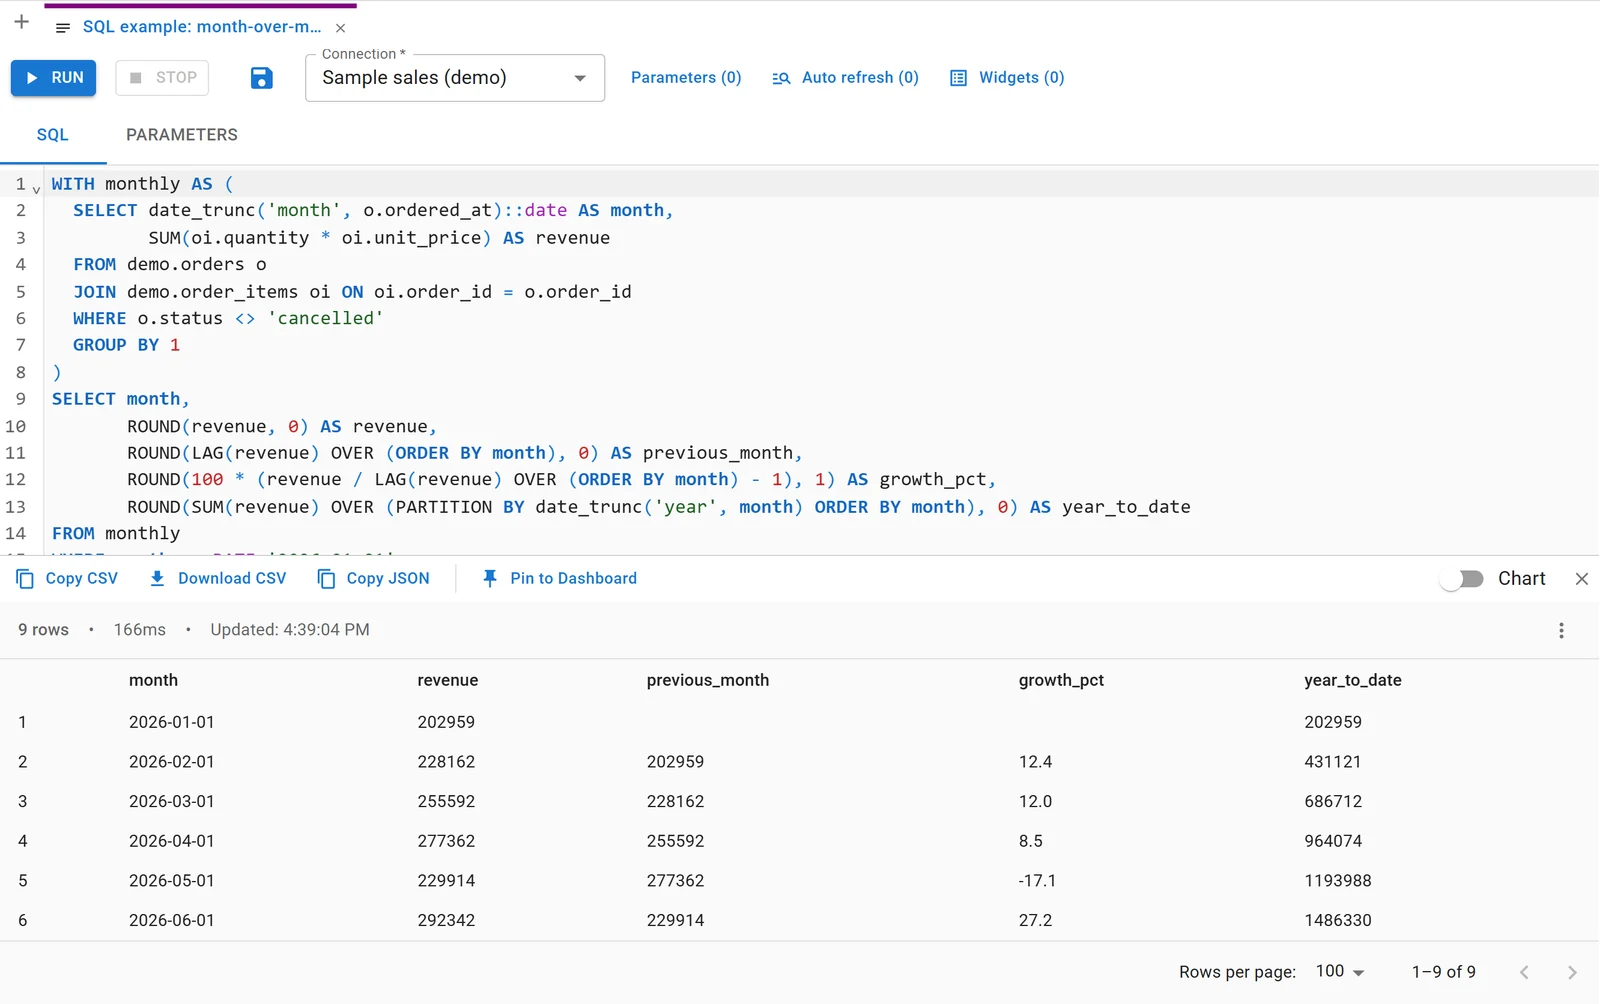
For more on this pattern, see how to compare month-over-month metrics in SQL.
9. Top N per group with RANK
The two best-selling products in each category:
WITH product_revenue AS (
  SELECT p.category, p.name,
         SUM(oi.quantity * oi.unit_price) AS revenue
  FROM demo.order_items oi
  JOIN demo.products p ON p.product_id = oi.product_id
  JOIN demo.orders o ON o.order_id = oi.order_id
  WHERE o.status <> 'cancelled'
  GROUP BY p.category, p.name
)
SELECT category, name, ROUND(revenue, 0) AS revenue, rank
FROM (
  SELECT *, RANK() OVER (PARTITION BY category ORDER BY revenue DESC) AS rank
  FROM product_revenue
) ranked
WHERE rank <= 2
ORDER BY category, rank| category | name | revenue | rank |
|---|---|---|---|
| Accessories | Studio Bundle | 313203 | 1 |
| Accessories | Advanced Bundle | 201587 | 2 |
| Hardware | Studio Widget | 1123762 | 1 |
| Hardware | Advanced Widget | 740917 | 2 |
| Services | Studio Toolkit | 816629 | 1 |
| Services | Advanced Toolkit | 554016 | 2 |
| Software | Studio Gadget | 908661 | 1 |
| Software | Ultra Gadget | 683487 | 2 |
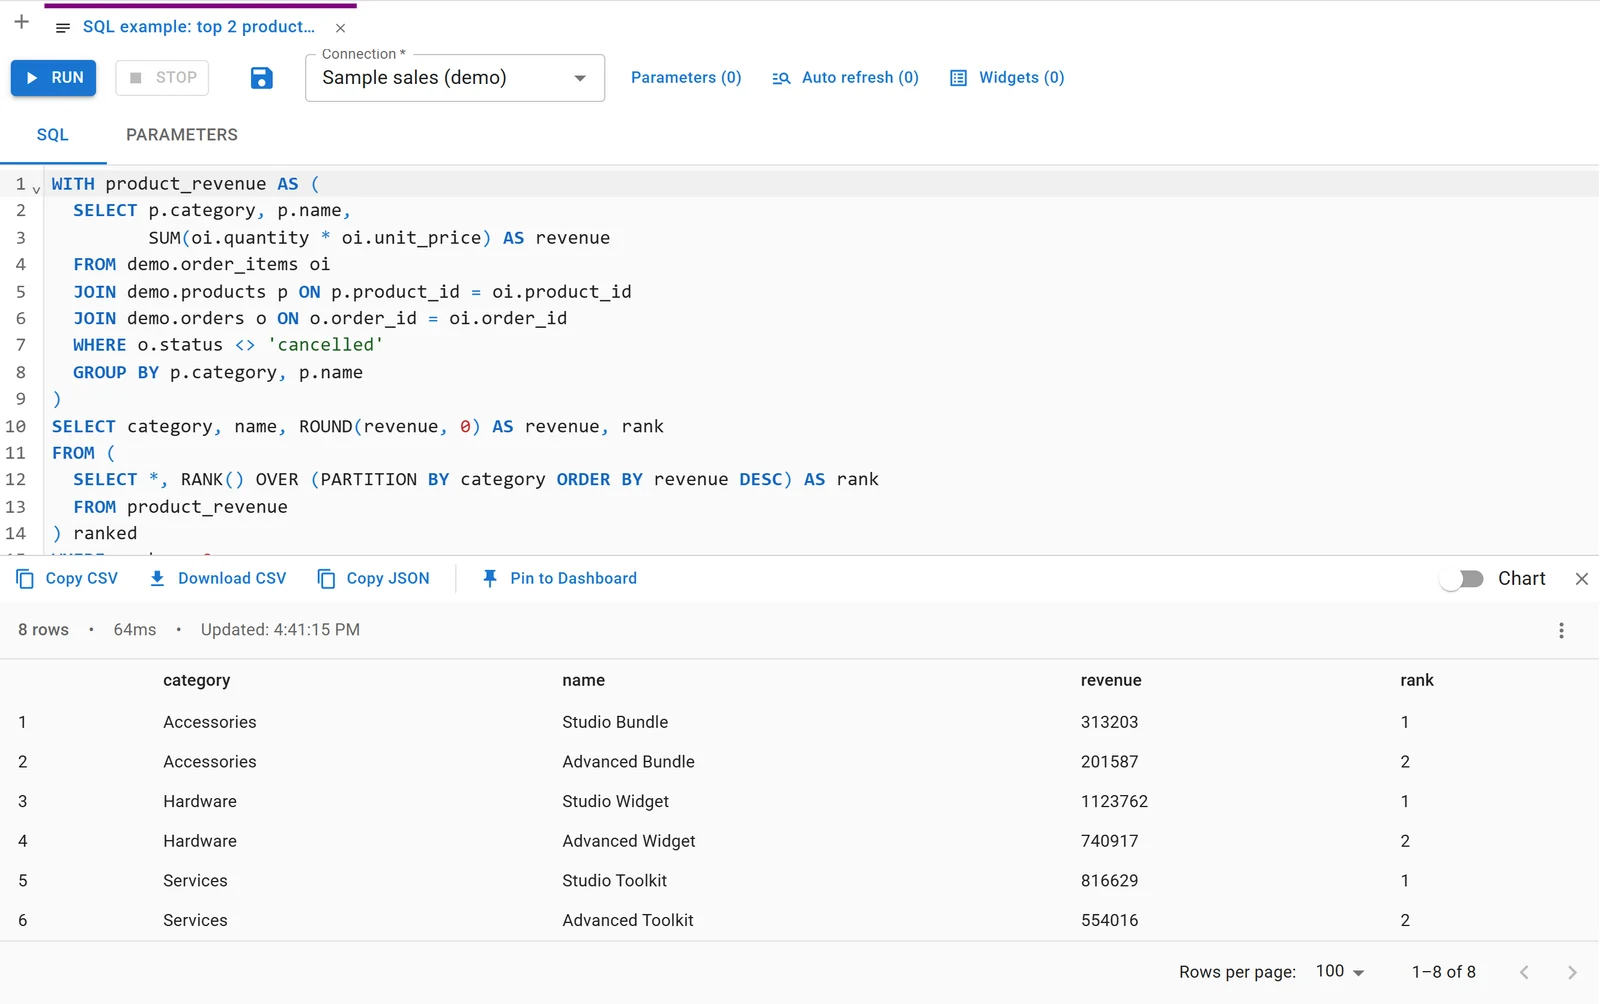
PARTITION BY category restarts the ranking in each category. You can't filter on a window function in the same query's WHERE, which is why the ranking sits in a subquery. RANK gives tied rows the same number; use ROW_NUMBER if you need exactly two rows per category even with ties.
10. The latest row per customer with ROW_NUMBER
Each customer's most recent order, then the five most recent of those:
SELECT customer_id, order_id, ordered_at::date AS latest_order, channel
FROM (
  SELECT o.*,
         ROW_NUMBER() OVER (PARTITION BY customer_id ORDER BY ordered_at DESC) AS rn
  FROM demo.orders o
  WHERE status <> 'cancelled'
) latest
WHERE rn = 1
ORDER BY latest_order DESC
LIMIT 5| customer_id | order_id | latest_order | channel |
|---|---|---|---|
| 58 | 2963 | 2026-09-28 | Online |
| 1 | 2966 | 2026-09-28 | Online |
| 2 | 2967 | 2026-09-28 | Sales team |
| 50 | 2961 | 2026-09-27 | Sales team |
| 54 | 2962 | 2026-09-27 | Online |
This is the standard way to get one whole row per group (the latest status, the last invoice, the current price) when MAX() alone would give you the date but not the rest of the row.
11. Running share of revenue (the Pareto check)
How much of all revenue the biggest customers account for:
WITH customer_revenue AS (
  SELECT o.customer_id, SUM(oi.quantity * oi.unit_price) AS revenue
  FROM demo.orders o
  JOIN demo.order_items oi ON oi.order_id = o.order_id
  WHERE o.status <> 'cancelled'
  GROUP BY o.customer_id
),
ranked AS (
  SELECT customer_id, revenue,
         ROW_NUMBER() OVER (ORDER BY revenue DESC) AS position,
         SUM(revenue) OVER (ORDER BY revenue DESC) / SUM(revenue) OVER () AS cumulative_share
  FROM customer_revenue
)
SELECT position, customer_id, ROUND(revenue, 0) AS revenue, ROUND(100 * cumulative_share, 1) AS cumulative_pct
FROM ranked
WHERE position <= 5
ORDER BY position| position | customer_id | revenue | cumulative_pct |
|---|---|---|---|
| 1 | 1 | 1356883 | 16.5 |
| 2 | 2 | 650275 | 24.4 |
| 3 | 3 | 509934 | 30.6 |
| 4 | 4 | 436795 | 35.9 |
| 5 | 5 | 397208 | 40.7 |
Five of 60 customers bring in 40.7% of revenue. SUM(revenue) OVER (ORDER BY revenue DESC) is a running total down the sorted list; divided by the grand total, it's the cumulative share.
Connect any database. Ask in plain English.
Start free →CASE, CTEs and statistics
12. Buckets with CASE
Orders by size band, with the average order in each:
WITH order_totals AS (
  SELECT o.order_id, SUM(oi.quantity * oi.unit_price) AS total
  FROM demo.orders o
  JOIN demo.order_items oi ON oi.order_id = o.order_id
  WHERE o.status <> 'cancelled'
  GROUP BY o.order_id
)
SELECT CASE
         WHEN total < 1000 THEN 'Under 1,000'
         WHEN total < 5000 THEN '1,000 to 4,999'
         ELSE '5,000 and over'
       END AS order_size,
       COUNT(*) AS orders,
       ROUND(AVG(total), 0) AS avg_total
FROM order_totals
GROUP BY 1
ORDER BY MIN(total)| order_size | orders | avg_total |
|---|---|---|
| Under 1,000 | 575 | 718 |
| 1,000 to 4,999 | 1754 | 2561 |
| 5,000 and over | 489 | 6801 |
The WITH clause (a CTE) first totals each order, then the outer query buckets the totals. CASE checks its conditions in order, so total < 5000 only sees orders that weren't under 1,000. ORDER BY MIN(total) sorts the bands by size rather than alphabetically.
13. Average and median side by side
WITH order_totals AS (
  SELECT o.order_id, c.segment, SUM(oi.quantity * oi.unit_price) AS total
  FROM demo.orders o
  JOIN demo.customers c ON c.customer_id = o.customer_id
  JOIN demo.order_items oi ON oi.order_id = o.order_id
  WHERE o.status <> 'cancelled'
  GROUP BY o.order_id, c.segment
)
SELECT segment,
       COUNT(*) AS orders,
       ROUND(AVG(total), 0) AS avg_order,
       ROUND(PERCENTILE_CONT(0.5) WITHIN GROUP (ORDER BY total)::numeric, 0) AS median_order
FROM order_totals
GROUP BY segment
ORDER BY avg_order DESC| segment | orders | avg_order | median_order |
|---|---|---|---|
| Enterprise | 1155 | 4723 | 4318 |
| Mid-market | 835 | 2346 | 2179 |
| Small business | 828 | 985 | 834 |
When the average sits well above the median, a few large orders are pulling it up. PERCENTILE_CONT(0.5) is the median; change it to 0.9 for the 90th percentile.
Customer metrics
14. Active customers per month
SELECT date_trunc('month', ordered_at)::date AS month,
       COUNT(DISTINCT customer_id) AS active_customers,
       COUNT(*) AS orders
FROM demo.orders
WHERE status <> 'cancelled'
  AND ordered_at >= DATE '2026-06-01'
GROUP BY 1
ORDER BY 1| month | active_customers | orders |
|---|---|---|
| 2026-06-01 | 32 | 92 |
| 2026-07-01 | 34 | 95 |
| 2026-08-01 | 32 | 90 |
| 2026-09-01 | 31 | 109 |
COUNT(DISTINCT customer_id) counts each customer once per month, however many orders they placed.
15. New customers per quarter
A customer is new in the quarter of their first order:
WITH first_orders AS (
  SELECT customer_id, MIN(ordered_at) AS first_order_at
  FROM demo.orders
  WHERE status <> 'cancelled'
  GROUP BY customer_id
)
SELECT date_trunc('quarter', first_order_at)::date AS quarter,
       COUNT(*) AS new_customers
FROM first_orders
GROUP BY 1
ORDER BY 1
LIMIT 6| quarter | new_customers |
|---|---|
| 2023-07-01 | 28 |
| 2023-10-01 | 22 |
| 2024-01-01 | 10 |
Only three rows came back, although we asked for six: all 60 customers had placed their first order by March 2024. The first-order date is also the starting point for cohort retention; see how to calculate cohort retention in SQL.
16. Profile a table before you trust it
Before writing any of the queries above on a new table, it pays to see its range and values:
SELECT MIN(ordered_at) AS first_order, MAX(ordered_at) AS last_order,
       COUNT(*) AS orders, COUNT(DISTINCT customer_id) AS customers,
       COUNT(*) FILTER (WHERE status = 'cancelled') AS cancelled,
       string_agg(DISTINCT status, ', ') AS statuses,
       string_agg(DISTINCT channel, ', ') AS channels
FROM demo.orders| first_order | last_order | orders | customers | cancelled | statuses | channels |
|---|---|---|---|---|---|---|
| 2023-09-01 09:00 | 2026-09-28 15:00 | 2967 | 60 | 149 | cancelled, completed, pending | Online, Partner, Sales team |
This is where you find out that the data ends in September, that a "pending" status exists, or that a channel is spelled two ways. COUNT(*) FILTER (WHERE ...) counts only the rows that match.
17. Check a join won't lose rows
SELECT (SELECT COUNT(*) FROM demo.customers) AS customers,
       (SELECT COUNT(*) FROM demo.products) AS products,
       (SELECT COUNT(*) FROM demo.order_items) AS order_items,
       (SELECT COUNT(*) FROM demo.customers c
WHERE NOT EXISTS (SELECT 1 FROM demo.orders o WHERE o.customer_id = c.customer_id)) AS customers_without_orders| customers | products | order_items | customers_without_orders |
|---|---|---|---|
| 60 | 24 | 8653 | 0 |
NOT EXISTS finds customers with no orders at all. Zero means an inner join from customers to orders drops no one; anything else means a report built on that join silently leaves those customers out.
What changes in MySQL, SQL Server and BigQuery
The queries above are PostgreSQL. Joins, GROUP BY, HAVING, CASE, CTEs and the window functions LAG, RANK, ROW_NUMBER and SUM() OVER are standard and work in MySQL 8.0 and later, SQL Server, BigQuery, Snowflake and DuckDB. These are the parts that differ:
| PostgreSQL | MySQL 8 | SQL Server | BigQuery |
|---|---|---|---|
LIMIT 5 |
LIMIT 5 |
SELECT TOP 5 ... or OFFSET 0 ROWS FETCH NEXT 5 ROWS ONLY |
LIMIT 5 |
date_trunc('month', d) |
DATE_FORMAT(d, '%Y-%m-01') |
DATETRUNC(month, d) (SQL Server 2022 and later) |
DATE_TRUNC(d, MONTH) |
x::date |
CAST(x AS DATE) |
CAST(x AS date) |
CAST(x AS DATE) or DATE(x) |
COUNT(*) FILTER (WHERE ...) |
SUM(CASE WHEN ... THEN 1 ELSE 0 END) |
SUM(CASE WHEN ... THEN 1 ELSE 0 END) |
COUNTIF(...) |
string_agg(x, ', ') |
GROUP_CONCAT(x SEPARATOR ', ') |
STRING_AGG(x, ', ') |
STRING_AGG(x, ', ') |
PERCENTILE_CONT(0.5) WITHIN GROUP (ORDER BY x) |
no built-in median | PERCENTILE_CONT(0.5) WITHIN GROUP (ORDER BY x) OVER (PARTITION BY ...) |
PERCENTILE_CONT(x, 0.5) OVER (PARTITION BY ...) |
INTERVAL '90 days' |
INTERVAL 90 DAY |
DATEADD(day, -90, d) |
INTERVAL 90 DAY |
CASE WHEN ... THEN 1 END inside COUNT or SUM works in every one of them, so it's the safe choice when a query has to run on more than one database.
Getting a query like these written for you
You can also describe the result you want and let an AI model write the SQL. We asked Claude, connected to the same sample database through Fastero, which product category brought in the most revenue and how many orders each had, leaving out cancelled orders. It wrote the same three-table join as query 2, drew the chart, and printed the SQL it ran so the numbers can be checked:
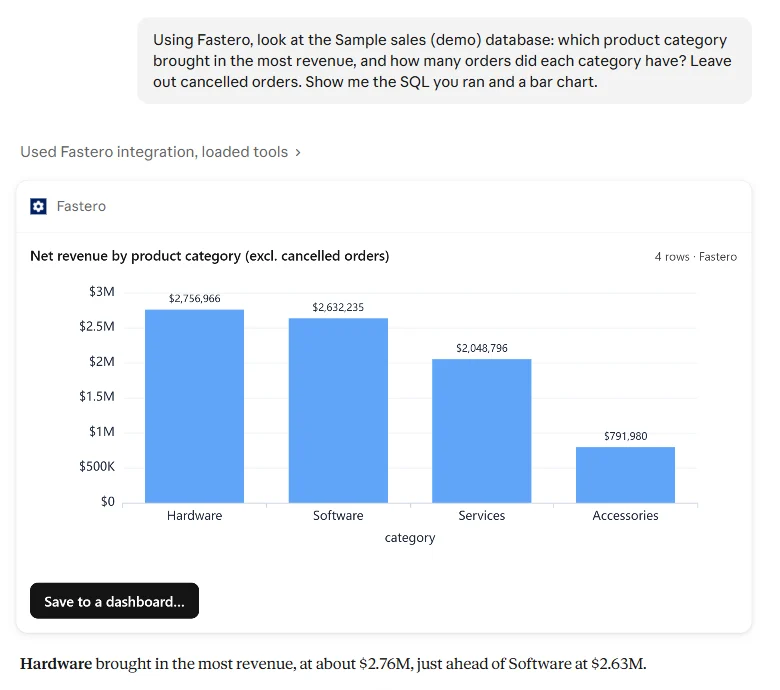
Its totals and order counts match query 2. That's the habit worth keeping with generated SQL: check that it filtered what you meant (here, cancelled orders) and counted the right thing (orders, not order items) before you trust the number.
FAQ
What are the most common SQL queries for data analysis?
A filtered SELECT, a GROUP BY with SUM or COUNT, a join across the tables that hold the pieces, a date_trunc to group by month, HAVING to filter groups, and window functions for month-over-month change (LAG), top N per group (RANK), running totals (SUM() OVER) and the latest row per group (ROW_NUMBER).
What's the difference between WHERE and HAVING?
WHERE filters rows before they're grouped; HAVING filters groups after GROUP BY. A condition on an aggregate, such as COUNT(*) >= 80, has to go in HAVING.
How do I get the top N rows per group in SQL?
Rank the rows inside each group with RANK() or ROW_NUMBER() OVER (PARTITION BY group ORDER BY value DESC) in a subquery or CTE, then keep the rows where the rank is N or less, as in query 9.
How do I calculate month-over-month growth in SQL?
Total by month first, then use LAG(revenue) OVER (ORDER BY month) to read the previous month and compute revenue / previous - 1. Filter to the months you want to show in an outer query, so the first month you show still has its comparison.
Do these queries work in MySQL?
Most do in MySQL 8.0 and later, which has window functions and CTEs. Change date_trunc to DATE_FORMAT, ::date to CAST, FILTER (WHERE ...) to SUM(CASE ...), string_agg to GROUP_CONCAT, and replace the median, which MySQL has no built-in function for.
Where can I practise SQL on a real database?
Any PostgreSQL you can install locally, or a hosted SQL editor with sample data. Every new Fastero workspace comes with a sample table of invented orders, with region, channel, category, quantity and price, to practise grouping, dates and window functions on.
Related reading:
- How to compare month-over-month metrics in SQL
- How to calculate moving averages and rolling metrics in SQL
- How to calculate cohort retention in SQL
- How to find duplicate records in your database
- How to pivot and unpivot data in SQL
- SQL notebooks
Sources: every query and result above was run on the sample sales database in Fastero's demo workspace (PostgreSQL, invented data) on 8 November 2026. Dialect details: PostgreSQL window functions, PostgreSQL aggregate functions, MySQL window functions, SQL Server DATETRUNC, BigQuery date functions.
Try Fastero free — a SQL editor on your own database, with sample data to practise on, saved queries your team can reuse, and dashboards from any query. No credit card required.