 Fastero Dev Team
Grafana is the open-source tool most teams use to chart metrics over time: servers, containers, databases, sensors. The quickest way to see what a good Grafana dashboard looks like is to open a few real ones, and Grafana runs a public site with hundreds you can click without an account.
The short answer: open live examples at play.grafana.org, Grafana's public demo, which listed 266 dashboards when we browsed it without signing in on 5 November 2026. To start from a ready-made dashboard, import one from grafana.com's library of 10,135 community dashboards by pasting its ID into Dashboards › New › Import dashboard. The most downloaded is Node Exporter Full, ID 1860, for Linux server metrics. Most of the library monitors infrastructure through Prometheus; if your dashboard is business numbers from a SQL database, few templates exist, and a SQL-first tool may suit you better.
Fastero
Connect your database. Ask questions. Get dashboards.
Postgres, BigQuery, Snowflake, and 10+ sources — live-connected, AI-powered, no dashboard builder learning curve.
Try free →Five live Grafana dashboard examples
Grafana describes its demo site as "a free, publicly accessible sandbox environment where anyone can explore and learn about Grafana, no setup or sign-in required." On any panel, open the menu and choose Edit to see the query and settings behind it.
1. Sample Website Dashboard
The classic starter: memory and CPU, logins, gauges, support calls, sign-ups and server requests, all driven by test data. Its intro panel explains the point: "This dashboard provides an example of how you can lay out information to monitor a website." A good model for layout: one row of trends, a column of single numbers, then detail.
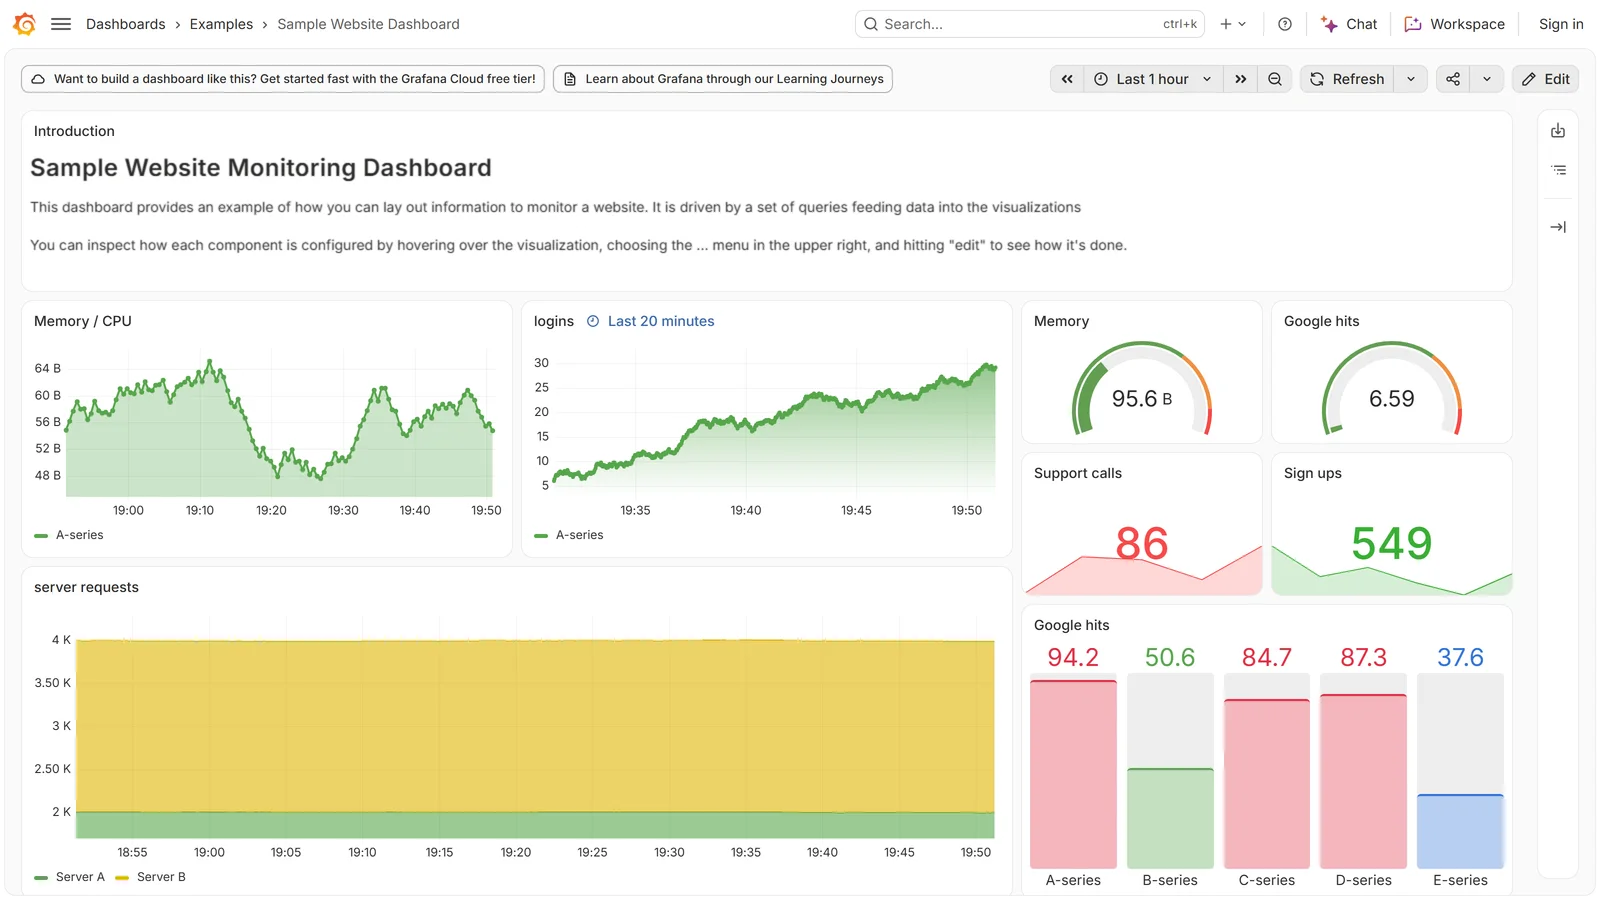
play.grafana.org/d/000000003, captured 5 November 2026.
2. Demo Wind Farm
An industrial example: the farm's average power with a minimum and maximum band, current power, turbine speed and wind direction, from AWS IoT SiteWise. It shows how to pair a trend with a large current-value stat beside it, and how a variable at the top (here, the turbine) filters every panel at once.
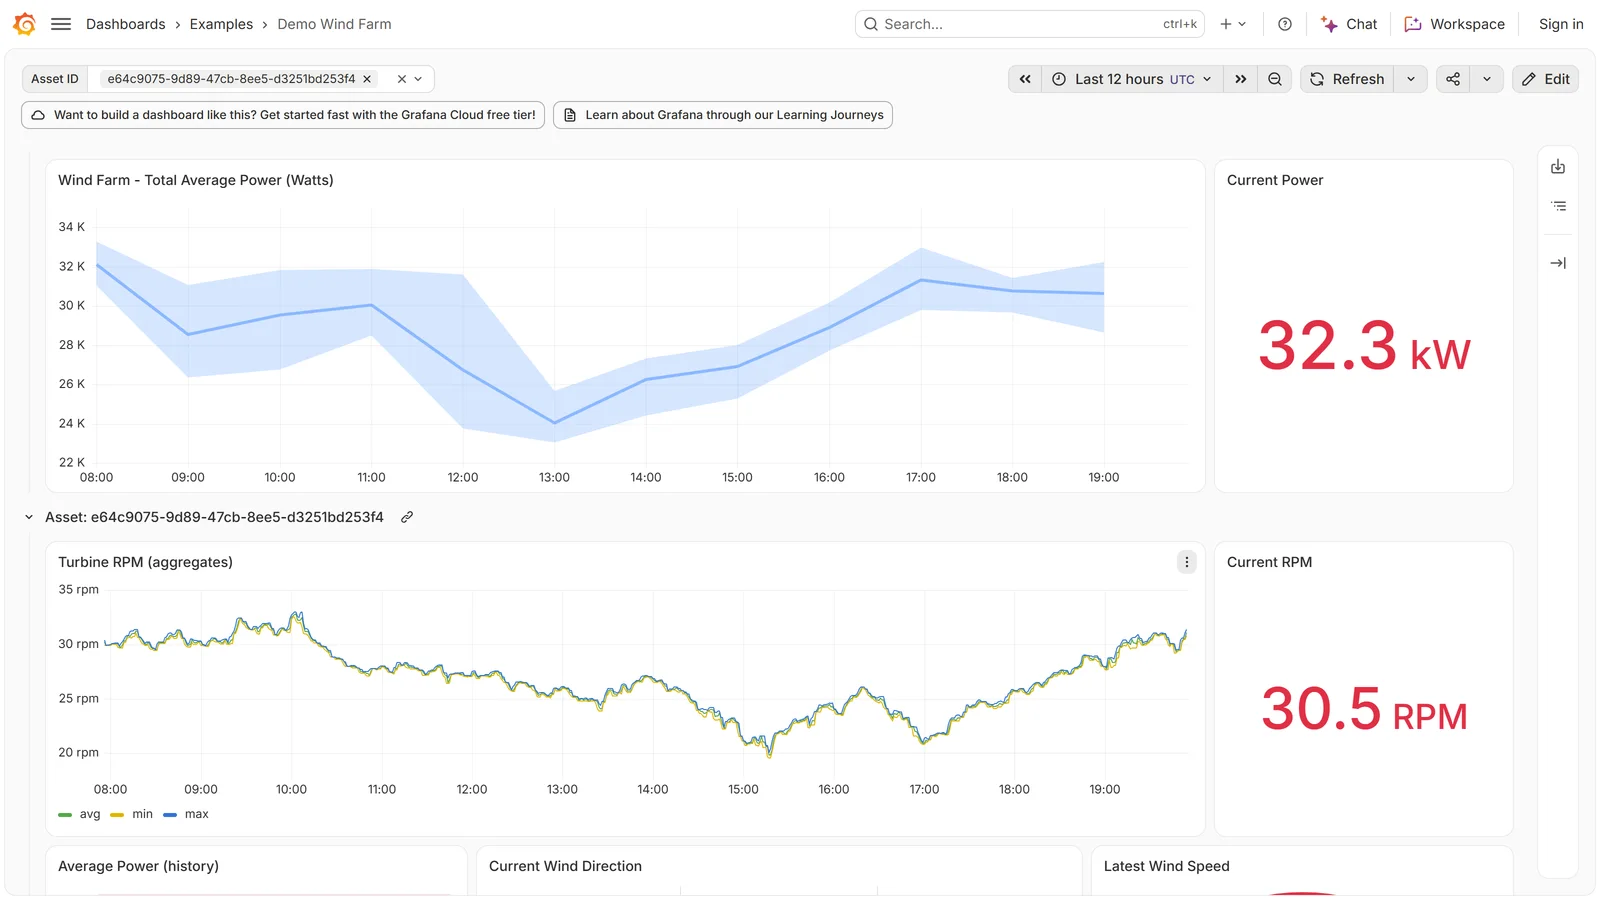
play.grafana.org/d/avzwehmz, captured 5 November 2026.
3. UK Carbon Intensity
Live data from a public API: carbon intensity for Great Britain, England, Scotland and Wales, with colour-coded labels from "very low" to "very high", renewables gauges and a grid by region. A good example of thresholds and colour doing the reading for you.
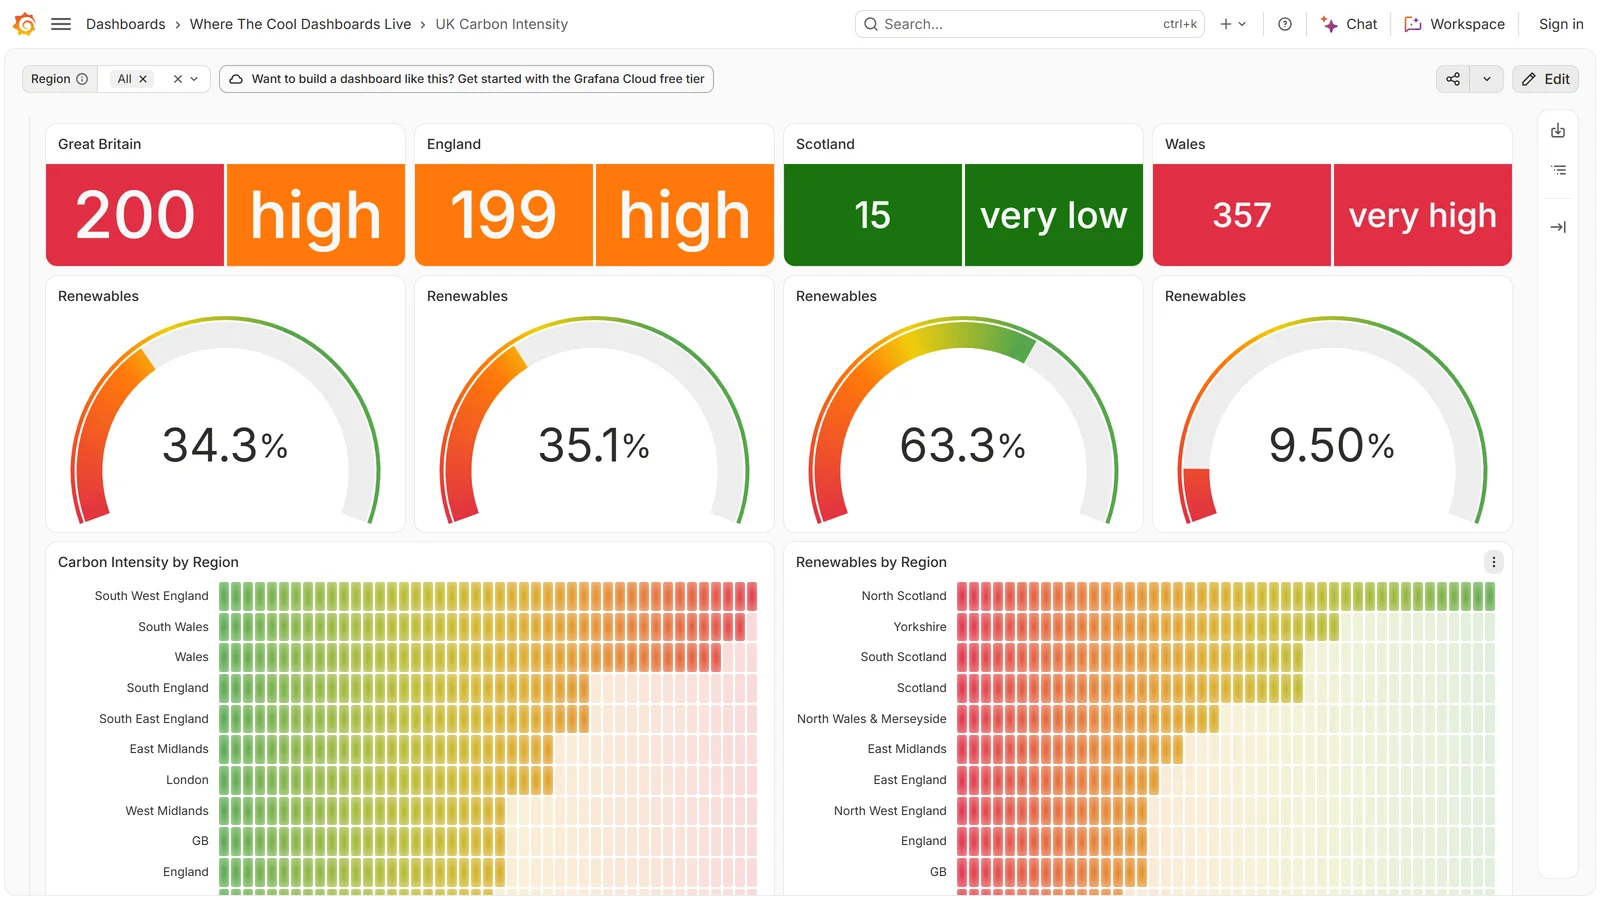
play.grafana.org/d/siw7lpj, captured 5 November 2026.
4. London Transport (TfL)
Bus arrivals at a station as a bar gauge, tube line status as large coloured tiles, and a table of current disruptions, refreshed every five minutes from Transport for London's API. It shows that a Grafana dashboard doesn't have to be all time series.
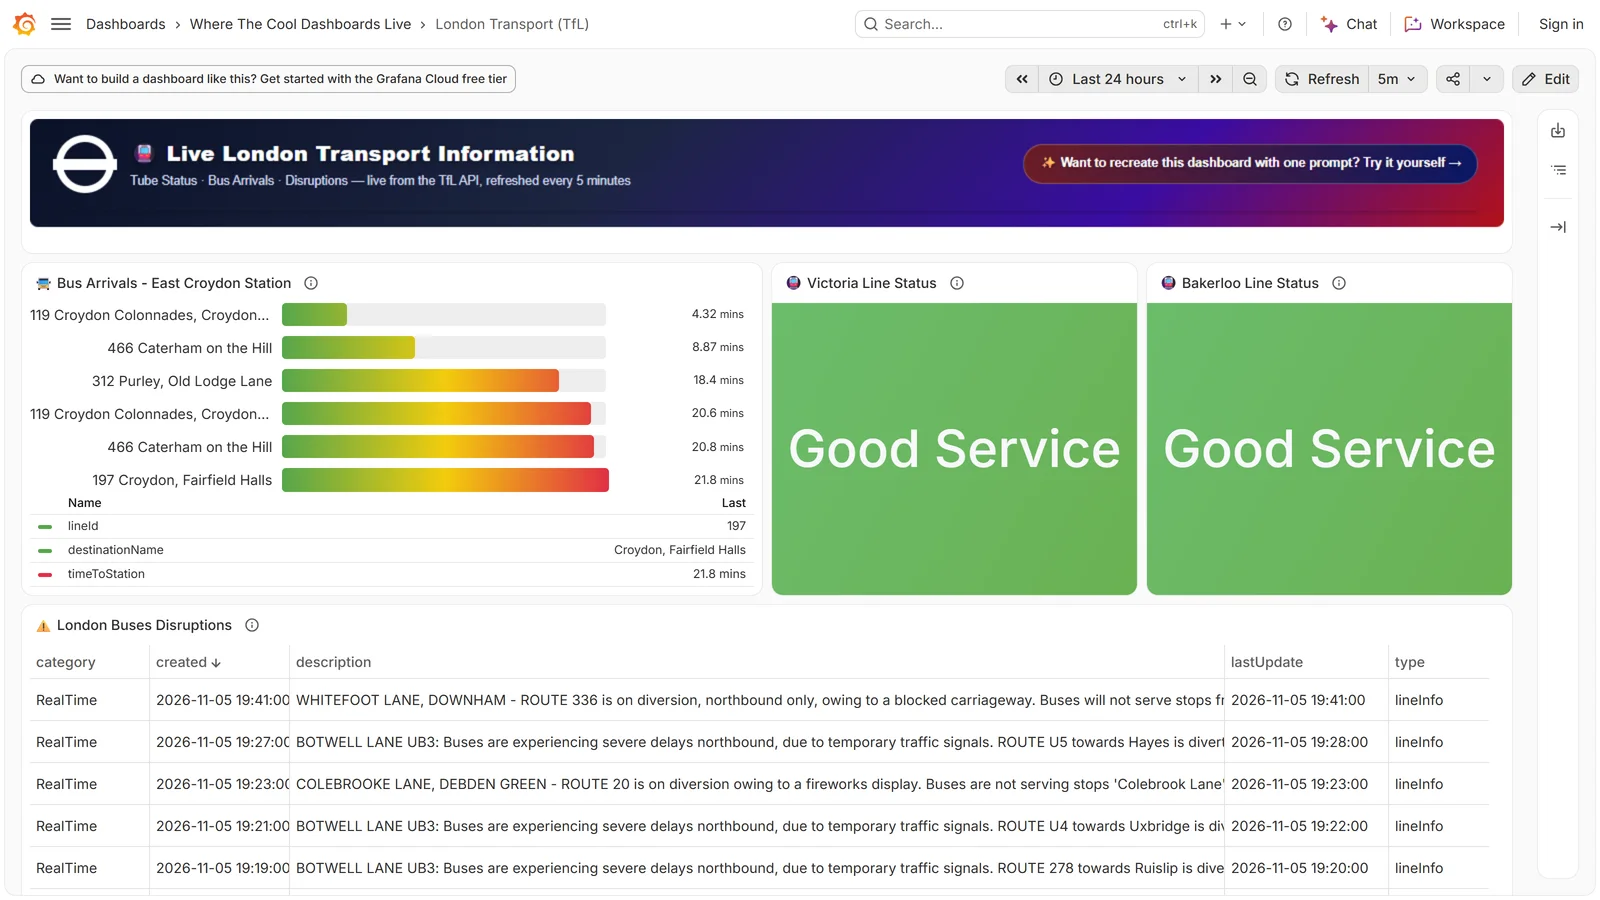
play.grafana.org/d/ec0c1486-03e6-4b64-bc80-11e764466e66, captured 5 November 2026.
5. PostgreSQL Database
Database monitoring of the kind most teams build first: server version, errors, data fetched, inserted and updated, maximum connections, CPU time and active sessions, with the server's log lines below.
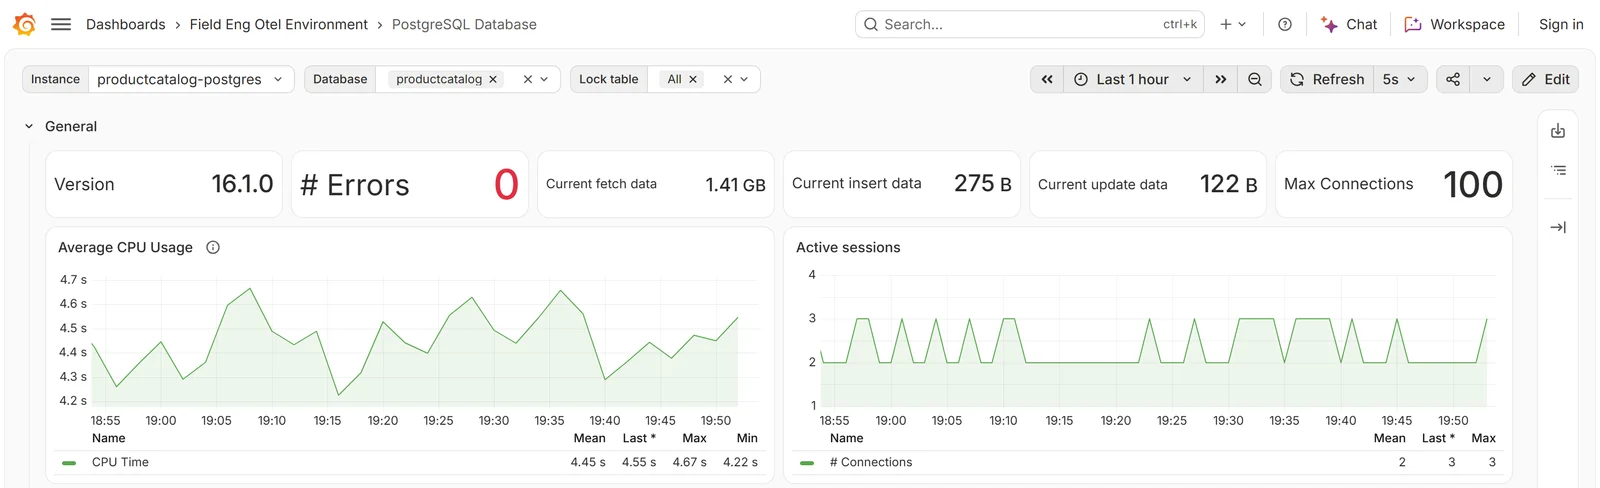
play.grafana.org/d/wLEXziM4z, captured 5 November 2026.
More on the demo site: the Examples folder has one dashboard per chart type (time series, bar and pie charts, stats, tables, geomaps, histograms, state timelines, candlesticks, heatmaps, flame graphs), which is the fastest way to find the right panel for your data. A few demos showed "No data" or had moved when we checked, including the QuickPizza business health, weather overview and Kubernetes cluster dashboards, so if one is empty, try another.
The most downloaded Grafana dashboards to import
Grafana's dashboard library at grafana.com/grafana/dashboards holds 10,135 community dashboards. Each has an ID you can import in seconds. The most downloaded, as grafana.com counted them on 5 November 2026:
| ID | Dashboard | Downloads | Monitors | Data source |
|---|---|---|---|---|
| 1860 | Node Exporter Full | 149,356,888 | Linux servers: CPU, memory, disk, network | Prometheus |
| 14584 | ArgoCD | 74,561,407 | Kubernetes deployments | Prometheus |
| 9614 | NGINX Ingress controller | 73,463,346 | Ingress traffic and latency | Prometheus |
| 7645 | Istio Control Plane Dashboard | 64,653,507 | Service mesh control plane | Prometheus |
| 14981 | CoreDNS | 58,992,904 | DNS inside Kubernetes | Prometheus |
| 13659 | Blackbox Exporter (HTTP prober) | 52,996,530 | Website uptime and response time | Prometheus |
| 10991 | RabbitMQ-Overview | 52,321,115 | Message queues | Prometheus |
| 14055 | Loki stack monitoring | 48,730,949 | Log pipeline health | Loki and Prometheus |
| 12239 | NVIDIA DCGM Exporter Dashboard | 41,943,627 | GPUs | Prometheus |
| 11265 | Amazon EC2 | 32,368,992 | EC2 instances | CloudWatch |
Counts this large include automated downloads from deployment scripts, so read them as popularity, not as people. Node Exporter Full's own description sums up what it does: "Nearly all default values exported by Prometheus node exporter graphed."
Connect any database. Ask in plain English.
Connect database →How to import a Grafana dashboard by ID
The steps from Grafana's documentation, the same in Grafana Cloud and in Grafana you run yourself:
- Click Dashboards in the main menu.
- Click New and choose Import dashboard.
- Paste a grafana.com dashboard URL or ID (for example
1860) and click Load. You can also upload a JSON file or paste JSON. - Optionally change the name, folder or UID.
- Select a data source, if the dashboard asks for one.
- Click Import.
The dashboard expects data shaped the way its author's was: Node Exporter Full needs Prometheus scraping node_exporter, for example. If panels show "No data", the usual cause is a different metric name or label in your setup.
Grafana dashboard templates
"Grafana dashboard templates" means two different things:
- Library dashboards, the importable JSON above, which is what most people mean.
- Grafana's built-in templates. Under Dashboards › New › Dashboard from template, "Grafana provides a variety of pre-built dashboard templates that you can use to quickly set up visualizations for your data." They open on sample data so you can see the layout first. The feature "is currently in public preview".
A third meaning is template variables: the dropdowns at the top of a dashboard, like the wind farm's turbine picker, which let one dashboard show any server, region or customer.
Grafana and business dashboards from SQL
The library shows where Grafana's strength lies. Of its 10,135 dashboards, 5,864 (58%) use Prometheus, and only about 350 are built on PostgreSQL or MySQL. Grafana can query SQL databases and plenty of teams do, but most examples, plugins and habits are about metrics and monitoring rather than revenue, orders or customers.
If the dashboard you need is business numbers from your database, such as weekly revenue by region, sign-ups and activation, or a report for a client, a SQL-first tool takes fewer steps. In Fastero you connect the database (Postgres, MySQL, SQL Server, BigQuery, Redshift and others), and each chart is a SQL query you write, or one Claude writes through Fastero's connector when you describe the chart you want. Dashboards refresh on a schedule, colleagues open them with their own login (viewers are free), and a dashboard can go out by email on a schedule or be published as a public link.
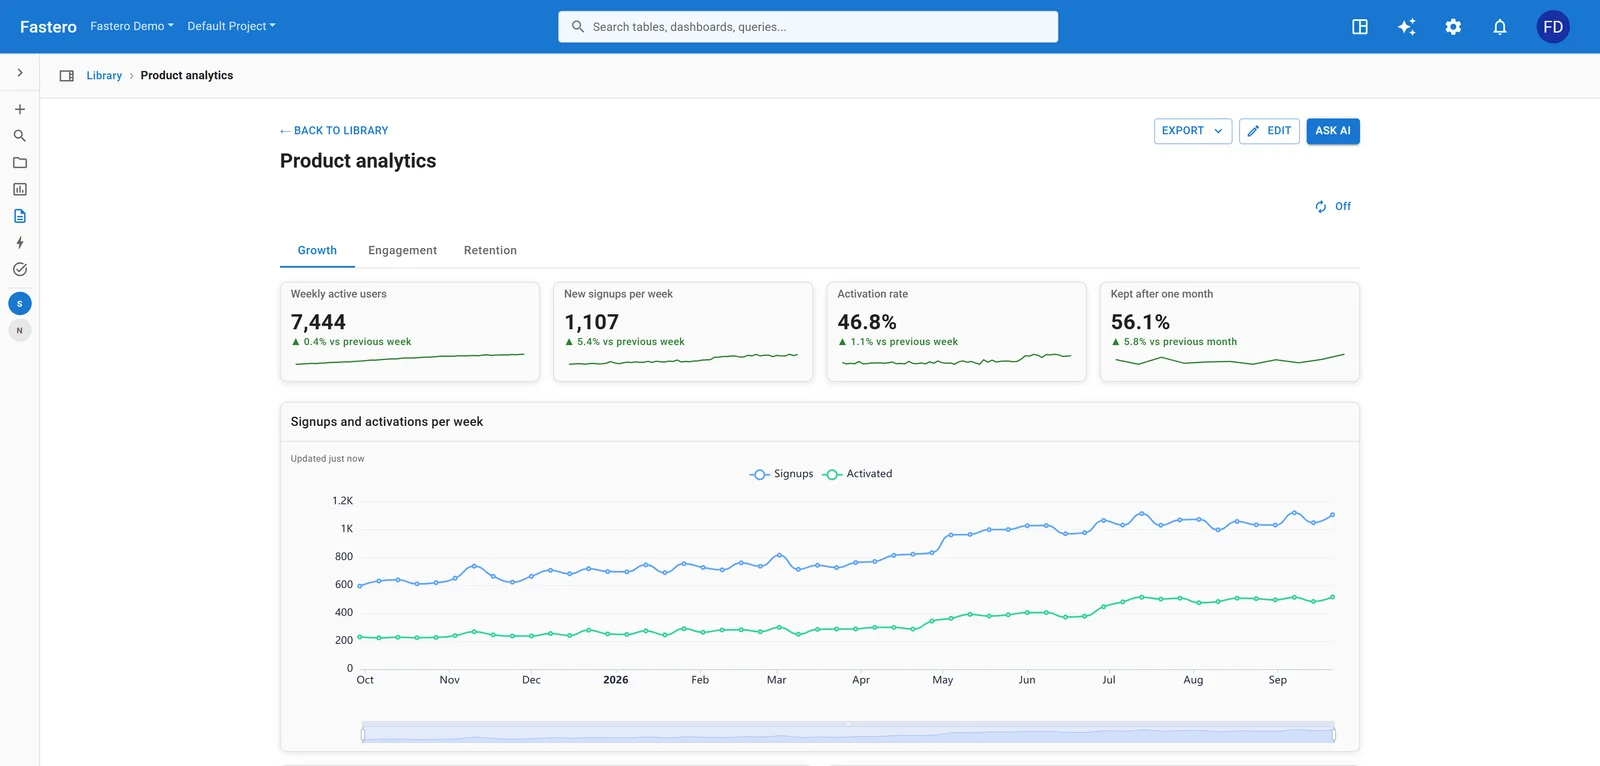
A business dashboard built from SQL in Fastero. Sample data.
Grafana in 2026: version and free tier
The current release is Grafana 13.3, from 27 October 2026. Grafana Cloud's free tier costs nothing ("Perfect for personal projects, exploring new ideas, and early-stage startups. No charges ever.") and includes 10,000 active metric series a month, 50 GB each of logs, traces and profiles, 14 days of retention and 3 active users. Pro starts at $19 a month plus usage, with $8 for each active user beyond the free three.
FAQ
Where can I see Grafana dashboard examples without installing anything?
At play.grafana.org, Grafana's public demo. It needs no account; open any dashboard and choose Edit on a panel to see its query.
What is the most popular Grafana dashboard?
Node Exporter Full, ID 1860, for Linux server metrics through Prometheus, with more than 149 million downloads on grafana.com as of November 2026.
How do I import a Grafana dashboard?
Go to Dashboards › New › Import dashboard, paste the dashboard's ID or grafana.com URL, click Load, pick your data source and click Import.
Are there Grafana dashboard templates for business data?
A few. The library has around 350 dashboards on PostgreSQL or MySQL out of more than 10,000, and Grafana's built-in templates are in public preview. For business reporting from SQL, a SQL-first dashboard tool usually needs less setup.
Is Grafana free?
Grafana is open source and free to run yourself. Grafana Cloud has a free tier with 10,000 active metric series, 50 GB of logs, traces and profiles, 14 days of retention and 3 active users.
Can Grafana show data from a SQL database?
Yes. PostgreSQL, MySQL, SQL Server and others are data sources; each panel runs a query. Most of Grafana's examples and community dashboards, though, are for Prometheus metrics.
Related reading:
- Best Grafana alternatives
- Grafana vs Metabase
- Grafana vs Apache Superset
- KPI dashboard examples
- Build live dashboards from any SQL query
Sources: Grafana Play, Grafana Play updates (November 2025), Grafana dashboard library, Node Exporter Full, importing dashboards, dashboard templates, Grafana releases, Grafana pricing. Download counts from grafana.com's public dashboard data, 5 November 2026.
Try Fastero free — connect your database and build business dashboards from SQL, or let Claude build them, with free viewers. No credit card required.