 Fastero Dev Team
A pivot table turns long data, one row per order, into a grid: months down the side, regions across the top, revenue in the cells. pandas has four ways to build one, pivot_table, pivot, crosstab and groupby(...).unstack(), and melt to go back.
The short answer: df.pivot_table(index="month", columns="region", values="revenue", aggfunc="sum") gives one row per month, one column per region and total revenue in each cell. Always pass aggfunc: the default is "mean". A list (["sum", "count"]) or a dict gives several aggregations, fill_value=0 fills empty cells, and margins=True adds a total row and column. pivot only reshapes and raises "Index contains duplicate entries, cannot reshape" when a row and column pair appears more than once; use it on data that is already one row per cell. pd.crosstab counts, and normalize="index" turns counts into shares. melt turns the grid back into rows. Every example ran on pandas 3.1.1 and Python 3.14.3 on 20 November 2026, with the output it printed.
Fastero
Connect your database. Ask questions. Get dashboards.
Postgres, BigQuery, Snowflake, and 10+ sources — live-connected, AI-powered, no dashboard builder learning curve.
Try free →The data
The same sample file as our pandas groupby examples: 4,734 invented orders from November 2024 to October 2026, with order_date, region, channel, segment, category, product, quantity, unit_price and revenue.
import pandas as pd

df = pd.read_csv("sample-sales.csv", parse_dates=["order_date"])
df["month"] = df["order_date"].dt.to_period("M")
Revenue by month and region
by_month = df.pivot_table(index="month", columns="region", values="revenue", aggfunc="sum")
print(by_month.shape)
print(by_month.round(0).tail(4))
(24, 4)
region East North South West
month
2026-07 15085.0 24444.0 21575.0 23032.0
2026-08 18667.0 24952.0 9482.0 34102.0
2026-09 16393.0 20928.0 8741.0 18757.0
2026-10 18411.0 12265.0 16431.0 10410.0index becomes the rows, columns the columns, and values is what gets aggregated. Each can be a list; two index keys give a row MultiIndex.
The default is the mean, not the sum
Leave out aggfunc and pandas averages:
print(df.pivot_table(index="month", columns="region", values="revenue").round(2).tail(2))region East North South West
month
2026-09 292.73 348.81 236.25 253.47
2026-10 375.74 227.14 328.62 212.46Those are average order values, not revenue. The signature says aggfunc='mean': when a pivot's numbers look far too small, check this first.
Several aggregations at once
A list of functions gives a column level per function:
print(df.pivot_table(index="region", columns="channel", values="revenue",
                     aggfunc=["sum", "count"]).round(0))
sum count
channel Online Partner Sales team Online Partner Sales team
region
East 151488.0 64769.0 119927.0 501 230 351
North 213297.0 88855.0 115330.0 660 266 384
South 142073.0 67118.0 97320.0 485 191 295
West 201271.0 83592.0 128660.0 692 286 393A dict picks a function per column:
print(df.pivot_table(index="category", values=["revenue", "quantity", "order_id"],
                     aggfunc={"revenue": "sum", "quantity": "mean", "order_id": "count"}).round(1))
order_id quantity revenue
category
Hardware 1366 2.5 704343.3
Services 405 1.0 196687.4
Software 1335 2.5 374298.4
Supplies 1628 6.4 198371.7Here the columns came back sorted by name, not in the order we listed them.
fill_value and margins
In October 2026, three of the twelve product-region cells for Services had no orders:
oct_services = df[(df["month"] == "2026-10") & (df["category"] == "Services")]
print(oct_services.pivot_table(index="product", columns="region", values="revenue", aggfunc="sum"))
print(oct_services.pivot_table(index="product", columns="region", values="revenue", aggfunc="sum",
                               fill_value=0))
region East North South West
product
Setup session 1314.87 371.76 NaN 1040.71
Support pack 247.93 NaN 225.90 474.06
Training day 1869.36 849.34 1739.71 NaN
region East North South West
product
Setup session 1314.87 371.76 0.00 1040.71
Support pack 247.93 0.00 225.90 474.06
Training day 1869.36 849.34 1739.71 0.00fill_value fills after aggregating, so it changes the display, not the sums. margins=True adds totals, named by margins_name (default "All"):
print(df.pivot_table(index="region", columns="channel", values="revenue", aggfunc="sum",
                     margins=True, margins_name="Total").round(0))
channel Online Partner Sales team Total
region
East 151488.0 64769.0 119927.0 336184.0
North 213297.0 88855.0 115330.0 417482.0
South 142073.0 67118.0 97320.0 306511.0
West 201271.0 83592.0 128660.0 413523.0
Total 708129.0 304335.0 461237.0 1473701.0The margins use the same aggfunc, so with "mean" the Total column is an average, not a sum of the row.
observed: categories with no rows
observed matters only when a key is a pandas Categorical. Its default changed to True in pandas 3.0, so categories with no rows are left out. Month names as an ordered categorical, over 2026, which has no November or December orders yet:
names = ["Jan", "Feb", "Mar", "Apr", "May", "Jun", "Jul", "Aug", "Sep", "Oct", "Nov", "Dec"]
y26 = df[df["order_date"].dt.year == 2026].assign(
    month_name=lambda d: pd.Categorical(d["order_date"].dt.strftime("%b"), categories=names, ordered=True))
default = y26.pivot_table(index="category", columns="month_name", values="revenue", aggfunc="sum")
wide12 = y26.pivot_table(index="category", columns="month_name", values="revenue", aggfunc="sum", observed=False)
print(len(default.columns), len(wide12.columns))
print(wide12.iloc[:, -3:].round(0))
10 12
month_name Oct Nov Dec
category
Hardware 22125.0 0.0 0.0
Services 8134.0 0.0 0.0
Software 17524.0 0.0 0.0
Supplies 9735.0 0.0 0.0With observed=False all twelve months appear, and the empty ones sum to 0. Use it when a report needs a fixed set of columns every time.
pivot_table vs pivot
pivot doesn't aggregate. On the raw orders it fails, because each month and region pair has dozens of rows (4,638 of the 4,734 rows repeat a pair already seen):
df.pivot(index="month", columns="region", values="revenue")ValueError: Index contains duplicate entries, cannot reshapeAggregate first and pivot gives the same table as pivot_table:
monthly = df.groupby(["month", "region"], as_index=False)["revenue"].sum()
print(monthly.shape, monthly.pivot(index="month", columns="region", values="revenue").equals(by_month))
(96, 3) Truepandas 3.1 also improved pivot's error for a misspelt column. columns="regoin" now raises KeyError: "The following 'columns' labels are not columns of the DataFrame: ['regoin']" instead of the cryptic TypeError older versions gave, per the 3.1.0 release notes.
pivot_table |
pivot |
pd.crosstab |
groupby(...).unstack() |
|
|---|---|---|---|---|
| Aggregates | Yes, default "mean" |
No | Counts by default; values plus aggfunc otherwise |
Yes, any aggregation |
| Repeated row and column pair | Aggregated | ValueError |
Counted | Aggregated |
| Totals | margins=True |
No | margins=True |
No |
| Shares | No | No | normalize= |
No |
| Takes | DataFrame column names | DataFrame column names | Arrays or Series | A grouped result |
Connect any database. Ask in plain English.
Start free →crosstab: counts and shares
pd.crosstab computes a frequency table unless you give it values and aggfunc:
print(pd.crosstab(df["category"], df["channel"], margins=True))
print(pd.crosstab(df["category"], df["channel"], normalize="index").round(3))
channel Online Partner Sales team All
category
Hardware 658 294 414 1366
Services 196 87 122 405
Software 641 286 408 1335
Supplies 843 306 479 1628
All 2338 973 1423 4734
channel Online Partner Sales team
category
Hardware 0.482 0.215 0.303
Services 0.484 0.215 0.301
Software 0.480 0.214 0.306
Supplies 0.518 0.188 0.294normalize="index" divides each row by its total, so each row sums to 1: 51.8% of Supplies orders came in online. "columns" does the same down each column, and "all" divides by the grand total. With values=df["revenue"], aggfunc="sum" the result equalled the pivot_table of revenue by region and channel when we checked with .equals.
melt: back to long
melt undoes a pivot. Reset the index so month is a column again, then name the two new columns:
long = by_month.reset_index().melt(id_vars="month", var_name="region", value_name="revenue")
print(long.shape)
print(long.head(3))
print(long.pivot(index="month", columns="region", values="revenue").equals(by_month))
(96, 3)
month region revenue
0 2024-11 East 10077.28
1 2024-12 East 8235.34
2 2025-01 East 9508.89
True24 months times 4 regions is 96 rows, and pivoting them again gives back the original exactly. groupby(["month", "region"])["revenue"].sum().unstack() builds the same table as the first pivot_table too (.equals printed True), and is the one to reach for when you already have a groupby.
A heatmap and a styled table from a pivot
A pivot is already the grid a heatmap needs. Orders by category and month, drawn with matplotlib 3.11.2:
import matplotlib.pyplot as plt

counts = df.pivot_table(index="category", columns="month", values="order_id", aggfunc="count")
fig, ax = plt.subplots(figsize=(14, 3.9))
im = ax.imshow(counts.values, cmap="Blues", aspect="auto")
ax.set_xticks(range(counts.shape[1]), counts.columns.strftime("%b %y"), rotation=90)
ax.set_yticks(range(counts.shape[0]), counts.index)
for i in range(counts.shape[0]):
    for j in range(counts.shape[1]):
        ax.text(j, i, counts.iat[i, j], ha="center", va="center", fontsize=8)
fig.colorbar(im, ax=ax, label="orders")
fig.savefig("heatmap.png", dpi=200, bbox_inches="tight")
The picture is that chart with our own colour ramp, white numbers on the dark cells and gaps between cells:
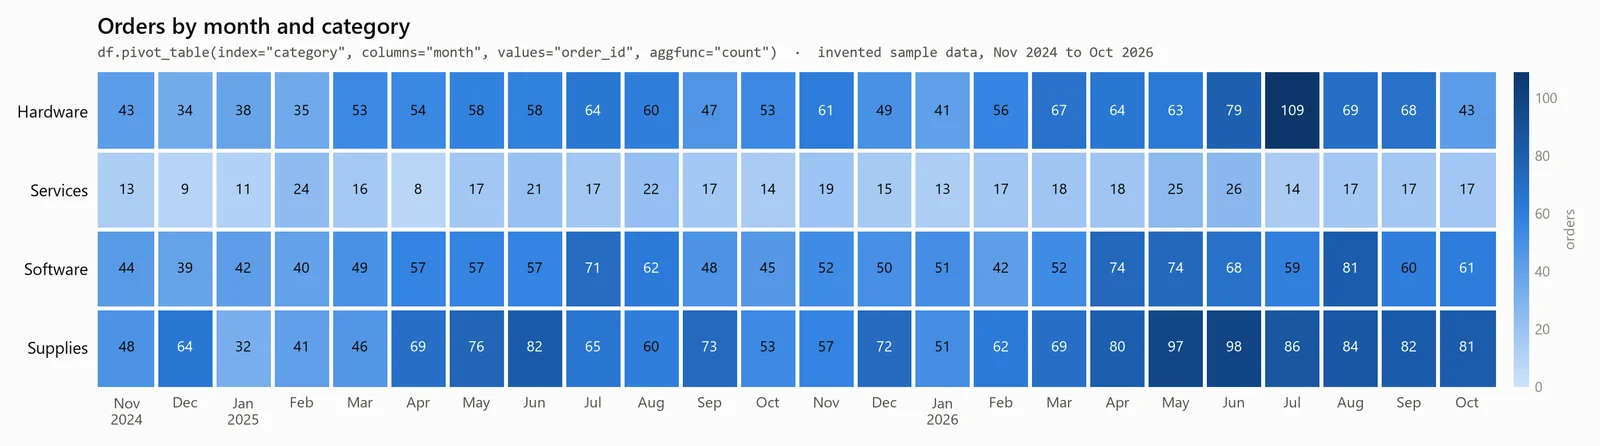
Orders by month and category from a pandas pivot_table, drawn with matplotlib. Invented sample data.
For a table people read, DataFrame.style colours the cells and writes HTML:
styled = (df.pivot_table(index="region", columns="channel", values="revenue", aggfunc="sum",
                         margins=True, margins_name="Total")
            .style.format("{:,.0f}")
            .background_gradient(cmap="Blues", axis=None,
                                 subset=(["East", "North", "South", "West"], ["Online", "Partner", "Sales team"])))
open("pivot.html", "w", encoding="utf-8").write(styled.to_html())
axis=None shades against the whole table rather than column by column, and subset keeps the totals out of the scale. Our first try left out axis=None, and the Partner column looked as large as Online. The screenshot adds a caption and grey totals:
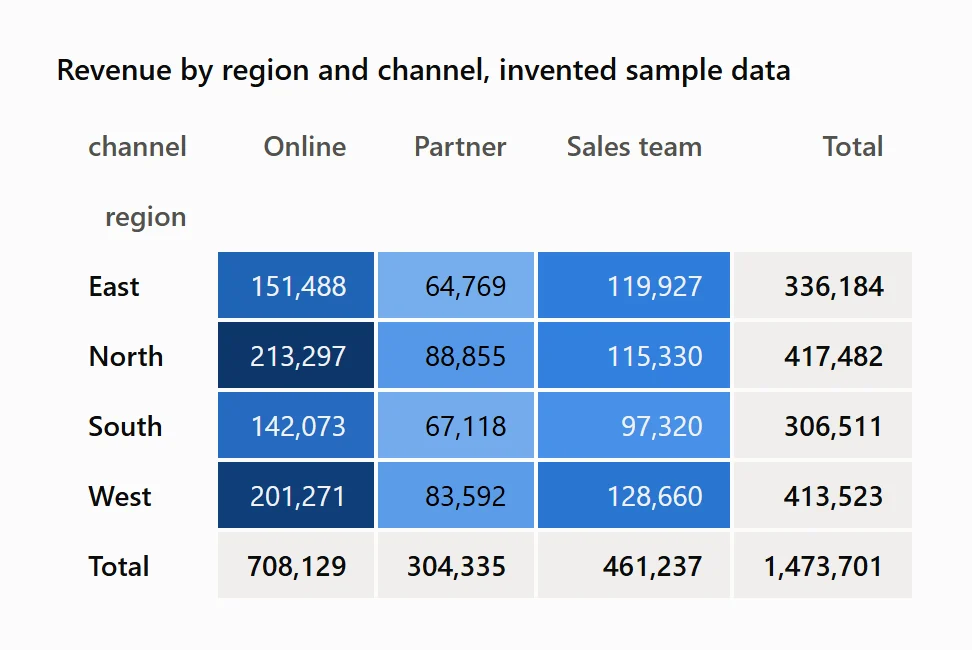
Revenue by region and channel, styled with pandas Styler and exported with to_html. Invented sample data.
The same pivot in SQL
DuckDB 2.0 has a PIVOT statement and reads the DataFrame by name:
import duckdb

sales = df.drop(columns="month")
duck = duckdb.sql("""
    PIVOT (SELECT strftime(order_date, '%Y-%m') AS month, region, revenue FROM sales)
    ON region USING sum(revenue) GROUP BY month ORDER BY month
""").df()
print(duck.round(2).tail(2))
month East North South West
22 2026-09 16392.75 20928.49 8741.29 18756.85
23 2026-10 18411.19 12265.30 16430.79 10410.30All 96 cells matched pandas to the cent, yet 57 of them were not exactly equal as raw floats, and rounded to whole numbers one differed: North in August 2026 summed to 24951.5 in pandas and 24951.499999999996 in DuckDB, which added the same floats in a different order. Compare money at cents, never with == on raw floats. For a database without PIVOT, pivoting and unpivoting in SQL covers the CASE WHEN version that works everywhere.
When the pivot is for a dashboard
A dashboard's heatmap doesn't need the pivot at all. Its widget takes the long result, one row per month and category, and lays out the grid itself:
print(duckdb.sql("""
    SELECT date_trunc('month', order_date) AS month, category, count(*) AS orders
    FROM sales GROUP BY ALL ORDER BY ALL
""").df().head(4))
month category orders
0 2024-11-01 Hardware 43
1 2024-11-01 Services 13
2 2024-11-01 Software 44
3 2024-11-01 Supplies 48Fastero is an AI and data platform where people and AI agents work together on a team's data. A query like that one, on a connected database, feeds a dashboard widget:
- Heatmap widget: pick the column that runs across, the one that runs down and the value; the SQL stays a plain
GROUP BY. - Refresh: a dashboard refreshes on a timer (1, 5, 15 or 60 minutes) or, for Postgres and BigQuery data only, when the data changes.
- From a notebook: Pin to Dashboard turns the DataFrame a Python cell shows, such as a pivot table, into a widget that refreshes when the notebook runs on its schedule. Keep it to one row key and one column key, or flatten the columns first, so the widget gets plain columns.
- Sharing: viewers are free; a dashboard gets a public link you can turn off, or a scheduled email, daily, weekly or monthly, with a PDF.
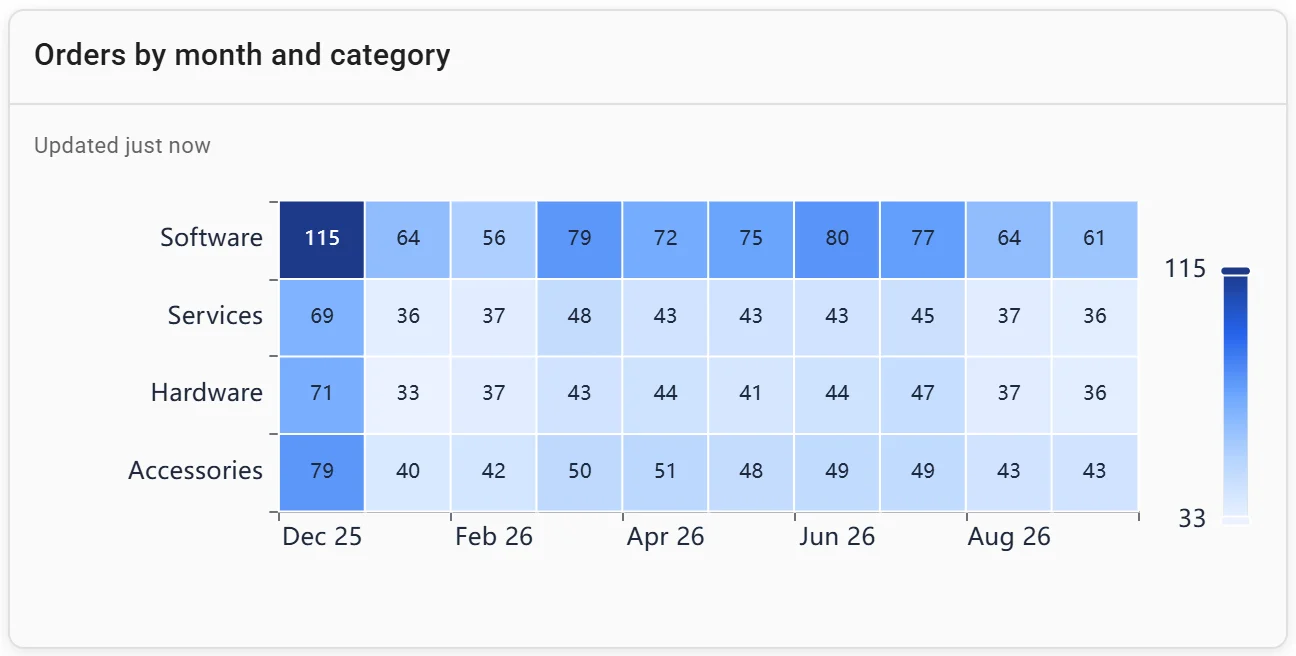
A heatmap: orders by month and category. Invented data.
More on sharing a dashboard with clients and the types of charts a dashboard can hold.
FAQ
What is the difference between pivot and pivot_table in pandas?
pivot only reshapes: each row and column pair must appear once, or it raises "Index contains duplicate entries, cannot reshape". pivot_table aggregates the repeats (by default with the mean) and adds fill_value and margins.
How do I sum instead of average in a pandas pivot table?
Pass aggfunc="sum". The default is "mean", which gives averages per cell.
How do I add totals to a pandas pivot table?
Pass margins=True; margins_name="Total" renames the All row and column. The totals use the same aggfunc as the cells.
What is pd.crosstab used for?
Counting how often combinations occur, such as orders per category and channel. normalize="index", "columns" or "all" turns the counts into shares.
How do I flatten a pivot table's columns?
After a pivot with several aggregations, t.columns = ["_".join(map(str, c)) for c in t.columns] turns ("sum", "Online") into sum_Online, and t.reset_index() makes the row labels a column.
How do I unpivot a DataFrame in pandas?
Use melt: wide.melt(id_vars="month", var_name="region", value_name="revenue") keeps month and turns every other column into rows.
Related reading:
- Pandas merge: every join type, with output
- Pandas groupby: 12 examples with output
- Pivot and unpivot in SQL
Sources
Read on 20 November 2026:
- pandas 3.1.1 documentation: pandas.pivot_table, DataFrame.pivot, pandas.crosstab, pandas.melt, DataFrame.unstack, Reshaping and pivot tables, Styler.background_gradient, What's new in 3.0.0, What's new in 3.1.0
- DuckDB 2.0 documentation: PIVOT statement
- Matplotlib 3.11.2: pyplot.imshow
- Hands-on: pandas 3.1.1, DuckDB 2.0.0, matplotlib 3.11.2 and Python 3.14.3, 20 November 2026, on Fastero's sample CSV of invented orders.
Try Fastero free: dashboards and notebooks next to your team's databases, with viewers free on every plan. No credit card required.