 Fastero Dev Team
"Can you pull the numbers on…" arrives in the data team's inbox a dozen times a day. In a large company the request joins a queue and comes back in two weeks, by which time the meeting has happened. In a small one it lands on the one analyst, or the founder, between everything else. Self-service analytics was supposed to end this: give people the tools and they'll answer their own questions. Mostly, they still ask.
The short answer: self-service analytics means letting people who aren't analysts get answers from company data themselves. TDWI defines it as "allowing nontechnical users throughout an organization to directly access data for self-directed discovery, analysis, visualization, and testing of hypotheses." It has a stubborn adoption problem: in BARC and Eckerson Group's 2022 study, "The percentage of employees actively using BI/analytics tools is currently 25% on average, reflecting minimal growth in the past seven years". It fails when people get tools without agreed definitions, clean data or the right access. AI assistants can finally make self-service conversational, but only when they answer through the same metric definitions and permissions as the dashboards; on raw tables, they guess.
Fastero
Connect your database. Ask questions. Get dashboards.
Postgres, BigQuery, Snowflake, and 10+ sources — live-connected, AI-powered, no dashboard builder learning curve.
Try free →What self-service analytics means
The goal is simple: the person with the question gets the answer without waiting for an analyst. In practice it has meant three generations of tools:
- Dashboards with filters, where people slice numbers someone else prepared.
- Drag-and-drop BI, where people build their own charts on curated datasets.
- Natural-language questions, where people ask in plain words and an AI writes the query.
TechTarget's definition covers all three: "Self-service analytics is a type of business intelligence (BI) that enables business users to access, manipulate, analyze and visualize data, as well as generate reports based on their discoveries."
Why it stalls
People use it far less than planned. BARC and Eckerson Group's 2022 study of 214 companies found active use of BI tools averaging 25% of employees, with almost no growth over seven years: "the average adoption rate of tools designed to help business users query, visualize, and analyze data and share insights has been stuck around 20% for many years." (The study was sponsored by BI vendors, which makes the flat line more telling, not less.)
The data isn't trustworthy enough to leave alone. "If the user needs the BI application to interface with multiple data sources, each of those data sources must have clean and reliable data." In dbt Labs' 2025 survey of data practitioners, "56% of survey respondents identified data quality as a problem."
Same word, different numbers. Without agreed definitions, two people building "revenue" themselves get two answers, and the meeting turns into an argument about which is right. TechTarget's warning: "If the analysis is not carried out correctly or the data is misinterpreted, those relying on the analysis might make poor decisions that could potentially damage the organization."
Access is either too open or too closed. Open everything and sensitive data leaks; lock it down and people go back to asking. TDWI's advice is to settle governance first, "to ensure end users can find the data they want but cannot access sensitive data that would present a security or compliance risk."
Most people don't want a tool. They want an answer. A drag-and-drop builder still asks someone to know which table holds what. That's why the questions keep coming back to the analyst.
The data team queue
No survey we trust puts a number on the request backlog, but the signs are everywhere. Adoption sits around a quarter of employees, so most questions still go to a person. In Deloitte's survey of finance leaders, companies spent 48% of their time creating and updating reports. And in large companies, a new dashboard or dataset can take weeks, so teams build their own in spreadsheets, which feeds the "two versions of the truth" problem.
Where AI assistants change the picture
An AI assistant removes the hardest part of self-service: knowing how to build the query. Ask "which regions grew fastest last quarter?" and it writes the SQL. The catch is accuracy. In a 2023 benchmark on enterprise SQL databases, GPT-4 answered correctly 16% of the time working from the database schema alone, and 54% when the questions went through a model that described the business. Snowflake's documentation names the problem: "Generic AI solutions often struggle with text-to-SQL conversions when given only a database schema, as schemas lack critical knowledge like business process definitions and metrics handling."
That's why the big platforms now route AI through definitions and permissions: Snowflake's Cortex Analyst uses semantic models, Databricks says of Genie that "Every answer is grounded in your organization's data and governed through Unity Catalog", and dbt connects AI tools to its Semantic Layer through an MCP server. The pattern is the same everywhere:
- Definitions first. The assistant uses the company's calculation of revenue, not its own.
- The person's own permissions. It sees what the person asking may see, no more.
- Read-only. Asking a question can't change the data.
- Answers that can become reports. A good answer can be saved where the team will see it again.
Making self-service work, step by step
- Write down the ten numbers people ask about most and define each as one calculation. See our guide to the semantic layer.
- Curate a small set of trusted tables for those numbers, with plain descriptions of each field.
- Set access by role, so sales sees pipeline and finance sees margins, without a ticket each time.
- Give people a way to ask in words, through an AI assistant that uses those definitions and permissions.
- Turn repeat questions into dashboards that arrive on a schedule, so the question stops being asked.
- Keep analysts for the hard questions: the new analysis, the model, the decision that needs judgement.
Connect any database. Ask in plain English.
Connect database →Self-service with Fastero
In Fastero, the data is connected once and the definitions live in the same workspace, so anyone can ask a question in plain words and get an answer built the same way as the dashboard:
- Ask in Fastero or in Claude. Fastero's assistant answers inside the workspace; Claude answers through Fastero's connector. Both read your saved metric definitions before writing SQL, so "revenue" in the answer means your revenue.
- Each person's own access. Answers come from what that person may see in the workspace. The connector acts as the person who signed in and never exceeds their role.
- Read-only questions. Queries that could change data are refused, and a result is capped at 500 rows or about 100 KB.
- From answer to dashboard. A chart from the conversation can be saved to a dashboard in one step, refreshed on a schedule and emailed weekly.
- Readers are free. Viewers don't need a paid seat, so the whole company can open the dashboards.
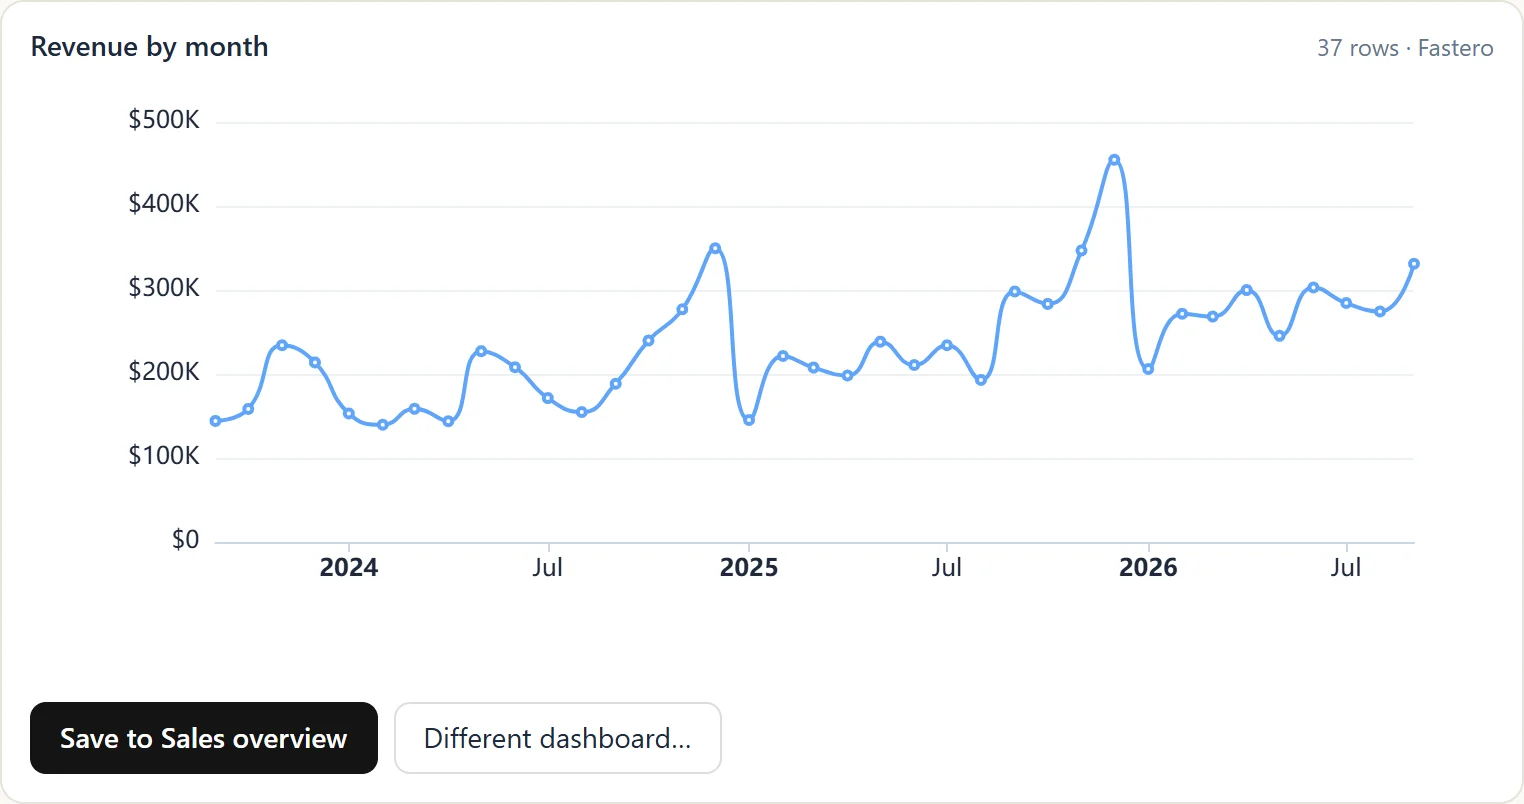
A question answered in Claude through Fastero's connector, ready to save to a team dashboard. Sample data.
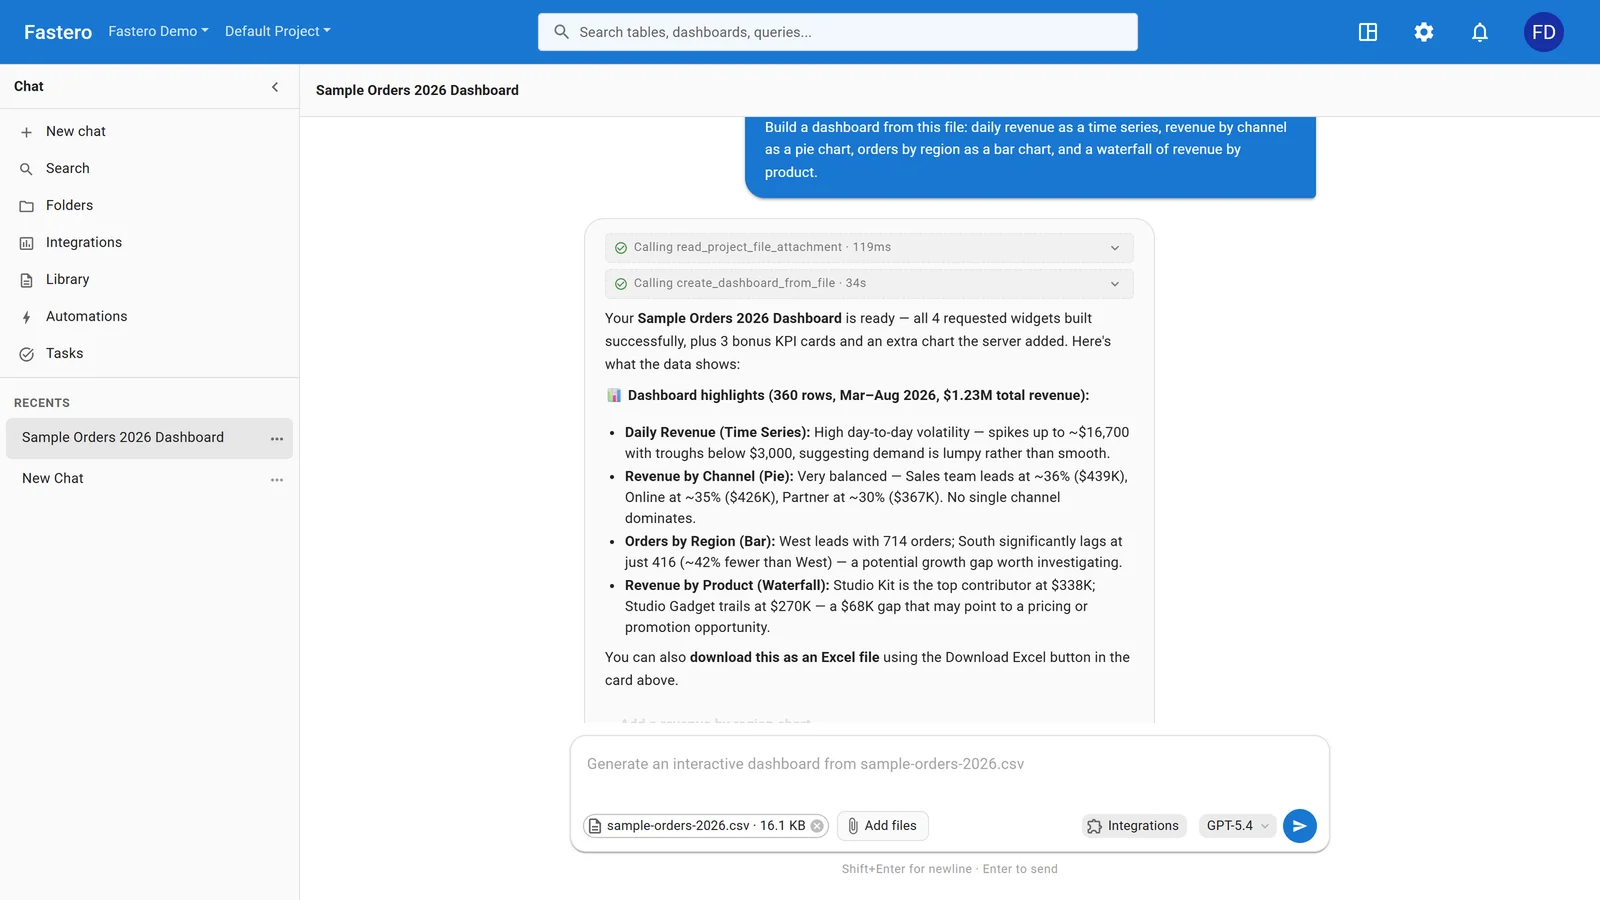
Fastero's own assistant, inside the workspace.
FAQ
What is self-service analytics?
Letting people who aren't data specialists get answers from company data themselves, through dashboards, drag-and-drop tools or questions in plain language, instead of asking an analyst each time.
Why does self-service BI fail?
Usually because people get tools without agreed definitions, trustworthy data or the right access. BARC and Eckerson Group found adoption flat at about 25% of employees over seven years.
What's the difference between self-service BI and traditional BI?
In traditional BI, analysts build reports for everyone else. In self-service BI, people build or ask for their own, on data and definitions the data team has prepared.
Can AI replace the data request queue?
It can answer many routine questions, but only if it uses the company's definitions and each person's permissions. On raw database tables, AI assistants guess which tables and filters you mean and often get it wrong.
Is self-service analytics safe?
It is when access follows each person's role and questions can't change data. Set governance before rolling tools out, so people find the data they need and can't reach what they shouldn't.
Related reading:
- What is a semantic layer?
- AI agent governance
- Shadow AI
- Best self-service analytics tools
- Automated reporting
Sources: TDWI: what is self-service BI, TechTarget: self-service analytics, BARC and Eckerson Group BI adoption study, dbt State of Analytics Engineering 2025, Deloitte: Crunch time 7, Sequeda et al. benchmark, Snowflake Cortex Analyst, Databricks Genie, dbt Semantic Layer. Checked 5 November 2026.
Try Fastero free — let your team ask questions in plain words and get answers built from your own definitions, with their own permissions. No credit card required.