 Fastero Dev Team
ipywidgets, also called Jupyter widgets, puts sliders, dropdowns, buttons and text boxes into a notebook, wired to your Python code. Move a slider and a chart redraws, with no cell to rerun. Every example below was run in a kernel before we published it.
The short answer: pip install ipywidgets (8.1.9, released 18 August 2026) sets up JupyterLab and Jupyter Notebook as well, so there's nothing else to enable. Then import ipywidgets as widgets, create a control such as widgets.IntSlider(value=100, min=0, max=200) and show it with display(); its current value is always in .value. The fastest route is interact, which builds controls from a function's arguments: a tuple becomes a slider, a list a dropdown, True a checkbox. Connect widgets with jslink (in the browser) or observe (in Python), and use an Output widget to catch what a callback prints. Widgets need a live kernel: they work in JupyterLab, Notebook 7, VS Code and Colab, but GitHub's notebook preview shows them as text.
Fastero
Jupyter notebooks for your team, with nothing to install.
Start a notebook or bring your .ipynb files. SQL cells query your databases with no password in the code, and a notebook runs now or on a schedule. Colleagues open it with their own login; viewers are free.
Try free →How we tested
We put the six examples in one notebook and executed it with nbclient 0.11.0 and ipykernel 7.4.0 on Python 3.14.3, Windows 11, on 12 November 2026: once with ipywidgets 8.1.9 and once with 7.7.1, the version in Colab's published package list. Further cells changed widget values and clicked the button from code, the way a person would in the browser, and we read the results from the widget state nbclient saved. Every cell ran without an error on both versions.
Two limits. Smart App Control on our machine blocked pandas from loading ("An Application Control policy has blocked this file"), so the examples filter a plain list of invented orders; swap in a DataFrame filter for real data. And we checked the widgets in a kernel, not by eye in each editor.
Every example starts from this setup cell:
import ipywidgets as widgets
from IPython.display import display
print("ipywidgets", widgets.__version__)

# Invented orders: week, region, amount
orders = [
    {"week": 1, "region": "North", "amount": 120},
    {"week": 1, "region": "South", "amount": 80},
    {"week": 2, "region": "North", "amount": 150},
    {"week": 2, "region": "West",  "amount": 95},
    {"week": 3, "region": "South", "amount": 170},
    {"week": 3, "region": "West",  "amount": 60},
]
1. Sliders
min_amount = widgets.IntSlider(
    value=100, min=0, max=200, step=10,
    description="Min amount",
    continuous_update=False,   # update on release, not on every pixel
)
weeks = widgets.IntRangeSlider(value=[1, 3], min=1, max=3, description="Weeks")
display(min_amount, weeks)
Read the values in any later cell with min_amount.value and weeks.value; ours printed 100 (1, 3). FloatSlider, FloatRangeSlider and SelectionSlider (for labelled steps such as month names) work the same way. continuous_update=False matters as soon as a slider drives anything slow.
2. Dropdowns
region = widgets.Dropdown(
    options=["All", "North", "South", "West"],
    value="All",
    description="Region",
)
metric = widgets.Dropdown(
    options=[("Revenue", "amount"), ("Order count", "count")],  # (label, value)
    description="Metric",
)
display(region, metric)
The (label, value) form shows friendly labels while your code gets column names. For several choices, SelectMultiple; for two to five, ToggleButtons or RadioButtons.
3. interact: controls from a function
from ipywidgets import interact

@interact(region=["All", "North", "South", "West"], min_amount=(0, 200, 10))
def show_orders(region="All", min_amount=100):
    rows = [o for o in orders
            if (region == "All" or o["region"] == region) and o["amount"] >= min_amount]
    print(f"Orders: {len(rows)}, revenue: {sum(o['amount'] for o in rows)}")
It printed Orders: 3, revenue: 440 before anyone touched it. The rules interact uses, from the ipywidgets docs:
| You pass | You get |
|---|---|
True or False |
Checkbox |
| A string | Text box |
An int, or (min, max) or (min, max, step) of ints |
IntSlider |
| The same with floats | FloatSlider |
A list, or a list of (label, value) pairs |
Dropdown |
fixed(20) |
No control: the argument stays at 20 |
A bare x=10 gives a slider from -10 to 30. For a slow function, interact_manual adds a button so it runs only when clicked.
4. Linking widgets
start = widgets.IntSlider(description="Start", max=52)
mirror = widgets.IntSlider(description="Mirror", max=52)
widgets.jslink((start, "value"), (mirror, "value"))      # two-way, in the browser

cities = {"North": ["Oslo", "Bergen"], "South": ["Rome", "Naples"], "West": ["Lisbon"]}
area = widgets.Dropdown(options=list(cities), description="Area")
city = widgets.Dropdown(options=cities[area.value], description="City")

def update_cities(change):
    city.options = cities[change["new"]]                  # runs in Python

area.observe(update_cities, names="value")
display(widgets.VBox([start, mirror, area, city]))
Three ways to connect widgets, and they behave differently:
jslink/jsdlinklink two values in the browser. "Javascript links persist when embedding widgets in html web pages without a kernel."link/dlinkdo the same through Python, which "only works if we are interacting with a live kernel".dlinkis one-way.observeruns any Python function on a change, like the dependent dropdown above. When we setarea.value = "South", the city options became('Rome', 'Naples').
Jupyter notebooks for your team.
Start free →5. A button and an Output widget
out = widgets.Output()
button = widgets.Button(description="Run report", button_style="primary")

def run_report(b):
    out.clear_output()
    with out:
        total = sum(o["amount"] for o in orders if o["amount"] >= min_amount.value)
        print(f"Orders of {min_amount.value} or more: {total}")

button.on_click(run_report)
display(widgets.VBox([button, out]))
Print from a callback without with out: and the text has nowhere obvious to go; the docs tell you to "send it to an Output widget". After button.click() from code, the Output widget held Orders of 100 or more: 440. Without the out.clear_output() line, each click's text is added below the last.
6. A small dashboard
import matplotlib.pyplot as plt

region_dd = widgets.Dropdown(options=["All", "North", "South", "West"], description="Region")
min_slider = widgets.IntSlider(value=0, min=0, max=200, step=10, description="Min amount",
                               continuous_update=False)

def render(region, min_amount):
    rows = [o for o in orders
            if (region == "All" or o["region"] == region) and o["amount"] >= min_amount]
    by_week = {}
    for o in rows:
        by_week[o["week"]] = by_week.get(o["week"], 0) + o["amount"]
    fig, ax = plt.subplots(figsize=(5, 2.5))
    ax.bar([str(w) for w in by_week], list(by_week.values()))
    ax.set_xlabel("Week"); ax.set_ylabel("Revenue")
    plt.show()
    print(f"Orders: {len(rows)}, revenue: {sum(by_week.values())}")

chart = widgets.interactive_output(render, {"region": region_dd, "min_amount": min_slider})
display(widgets.VBox([widgets.HBox([region_dd, min_slider]), chart]))
interactive_output is interact without the automatic controls: you build and lay out the widgets yourself, with HBox for a row and VBox for a column, and it reruns render into its own Output whenever one changes. We set the region to North and the slider to 130: the output became a new chart (a PNG) and Orders: 1, revenue: 150. With matplotlib 3.11.2, the same code worked under both ipywidgets versions.
Where ipywidgets work, and where they don't
| Where | Works? | Notes, checked 12 November 2026 |
|---|---|---|
| JupyterLab | Yes | pip install ipywidgets brings jupyterlab_widgets. If JupyterLab and the kernel are in different environments, install that in JupyterLab's and ipywidgets in the kernel's |
| Jupyter Notebook 7 | Yes | Installed for "JupyterLab and Jupyter Notebook" by the same package (widgetsnbextension for the classic interface) |
| VS Code | Yes | The Jupyter extension says widgets, "both the default and custom widgets", are supported; release 2025.8.0 made ipywidgets 8 its default. Third-party widget code can load from jsDelivr or unpkg |
| Google Colab | Yes, older version | Google's published list of Colab packages pins ipywidgets 7.7.1 (its repository was last updated on 9 November 2026). Users report that third-party widgets such as ipympl ask you to run from google.colab import output; output.enable_custom_widget_manager() first |
| JupyterLite | Yes | The ipywidgets docs' own "Try it online" runs in JupyterLite |
| GitHub, nbviewer | Static at best | Without the widget JavaScript you see text such as IntSlider(value=0); saved widget state can render on nbviewer, but nothing runs |
| Exported HTML | Looks only | embed_minimal_html or Save Notebook Widget State keeps the widgets; jslink still works, Python callbacks don't |
If you see IntSlider(value=0) instead of a slider in JupyterLab or Notebook, the docs say the widgets JavaScript "is either not installed or not enabled", and a common cause is a notebook server and a kernel in different environments.
On Colab, stay with the APIs that exist in 7.7.1. Everything on this page does.
Sharing a widget notebook
Widgets run Python callbacks, so whoever uses them needs a kernel. Voilà turns a notebook into a web app where "each user connecting to the Voilà tornado application gets a dedicated Jupyter kernel", and hides the code by default. Past a few controls, many teams move to Streamlit or Dash instead; we compared them in Streamlit vs Dash, and the wider choice in best Python dashboard frameworks.
When the dashboard is for a team
A slider in your notebook is for you. When colleagues need the same numbers every morning, with their own login, the job changes. Fastero is an AI and data platform where people and AI agents work together on a team's data:
- Notebooks next to the data: SQL cells query a workspace connection with stored credentials and return a pandas DataFrame, and Secrets reach cells as environment variables.
- On a schedule: run a notebook on any cron schedule, on the Free plan.
- Interactive apps behind a login: Streamlit apps run behind the workspace's login on every plan; on Free, as of 12 November 2026, an app wakes when opened and sleeps after 10 idle minutes.
- Dashboards people open: colleagues sign in and viewers are free, a public link can be turned off again, and a dashboard can be emailed daily, weekly or monthly.
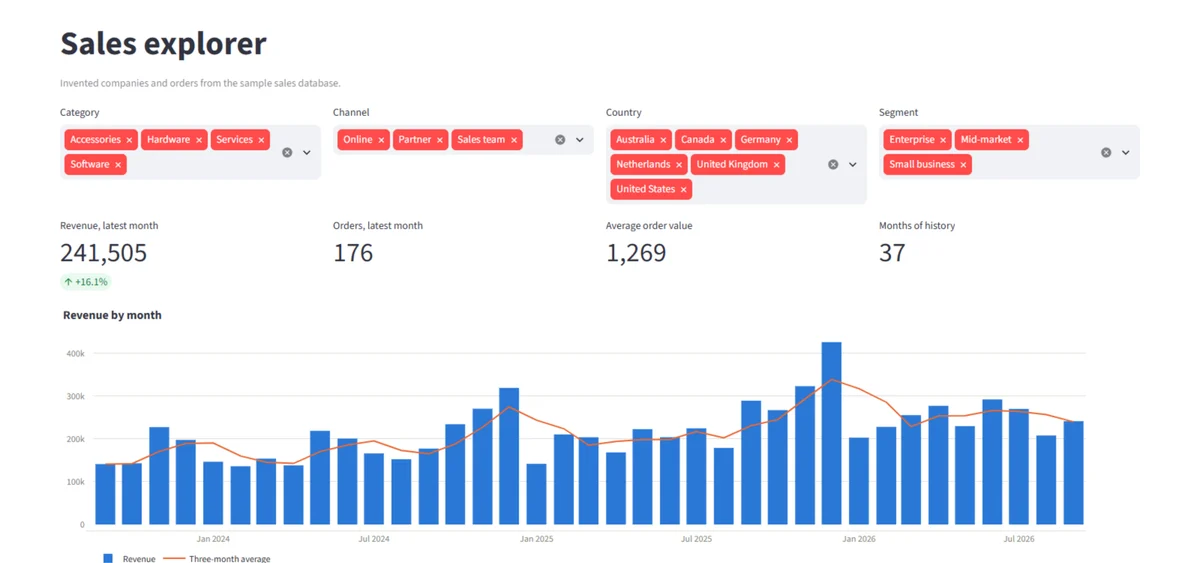
A Streamlit app hosted in Fastero. Invented data.
More in turning a Jupyter notebook into a live dashboard and notebooks vs Streamlit apps.
FAQ
How do I install ipywidgets?
pip install ipywidgets or conda install -c conda-forge ipywidgets. It sets up JupyterLab and Jupyter Notebook too. Only JupyterLab 1 or 2 and Notebook 5.2 or older need extra commands.
Why does my widget show as text, like IntSlider(value=0)?
The frontend can't load the widget JavaScript: usually the notebook server and the kernel are in different environments, or you're viewing a static copy such as GitHub's preview.
What is the difference between interact and interactive_output?
interact creates the controls for you from the function's arguments. interactive_output takes controls you built yourself, so you choose the layout.
Do ipywidgets work in Google Colab?
Yes, the built-in widgets do. Colab lists ipywidgets 7.7.1, and third-party widgets need output.enable_custom_widget_manager(), by user reports.
Do ipywidgets work in VS Code?
Yes, through the Jupyter extension, which bundles the standard widgets and has defaulted to ipywidgets 8 since release 2025.8.0.
How do I link two widgets?
widgets.jslink((a, "value"), (b, "value")) links them in the browser, and still works in exported HTML. Use widgets.link or observe when Python needs to react.
Sources
Read on 12 November 2026; examples run that day in a Python 3.14.3 venv with nbclient 0.11.0, ipykernel 7.4.0 and matplotlib 3.11.2, under ipywidgets 8.1.9 and 7.7.1:
- Jupyter Widgets docs: overview, installation, widget list, using interact, widget events, Output widget, embedding; ipywidgets on PyPI
- Editors: Notebook 7 migration guide, VS Code Jupyter: IPyWidgets, vscode-jupyter 2025.8.0 release
- Colab: package list (googlecolab/backend-info), custom widget manager report
- Voilà README