
Grafana is the right tool if your primary question is "is my system healthy right now?" But if you're building revenue dashboards, querying SQL databases, or combining business data from multiple sources, Grafana's time-series architecture works against you. The best alternative depends on whether you need open-source SQL analytics, enterprise BI, log-native search, or AI-assisted cross-source dashboards.
I've used or deployed most of these tools in production. This isn't a feature checklist copied from vendor pages — it's an honest breakdown of where each tool wins, where it doesn't, and what you'll actually pay.
Why teams outgrow Grafana
Grafana was born as a time-series visualization layer for Prometheus and InfluxDB. Every UX decision — the auto-refresh intervals, the PromQL editor, the default "last 6 hours" time picker — reflects that origin. When teams try to use Grafana for business analytics, three problems surface fast:
-
SQL is a second-class citizen. You can query Postgres from Grafana, but the SQL editor is bare-bones. No visual query builder, no schema browser worth using, no saved parameterized queries for non-technical users.
-
Non-time-series data feels bolted on. Revenue by region, pipeline by stage, churn by cohort — these are the bread and butter of business dashboards, and Grafana treats them like an afterthought. Panel types default to time-series lines. Getting a clean bar chart from a SQL query takes more configuration than it should.
-
Cross-source joins don't exist. Grafana can show Prometheus and Postgres data on the same dashboard, but it cannot join them. If you need to correlate Stripe revenue data with warehouse usage metrics or combine HubSpot pipeline numbers with product analytics, you need either an ETL pipeline or a tool that handles cross-source queries natively.
None of this makes Grafana bad. It makes it specialized. The question is what you need instead. For a deep dive into the Grafana-vs-BI-tool split, see the Grafana vs Metabase comparison.
Quick comparison
| Tool | Type | Best for | SQL-first | Cross-source | Self-host | Pricing |
|---|---|---|---|---|---|---|
| Metabase | Open-source BI | Business users + SQL teams | Yes | No | Yes | Free / $85/user/mo cloud |
| Apache Superset | Open-source BI | Large-scale SQL analytics | Yes | No | Yes | Free (self-host only) |
| Power BI | Enterprise BI | Microsoft-ecosystem orgs | Yes | Via dataflows | No | $10-$20/user/mo |
| Tableau | Enterprise BI | Visual analytics at scale | Yes | Via Prep | No | $15-$75/user/mo |
| Redash | Lightweight SQL | Quick SQL dashboards | Yes | No | Yes | Free (self-host only) |
| Kibana | Log analytics | ELK stack teams | No (KQL) | No | Yes | Free / Elastic Cloud |
| Datadog Dashboards | SaaS monitoring | Full-stack observability | No | Within Datadog | No | $23+/host/mo |
| Fastero | AI-powered analytics | Cross-source business dashboards | Yes + NL | Yes | No | Free tier / usage-based |
Fastero
Connect your database. Ask questions. Get dashboards.
Postgres, BigQuery, Snowflake, and 10+ sources — live-connected, AI-powered, no dashboard builder learning curve.
Try free →Which alternative fits your use case?
         Why are you leaving Grafana?
         |
         +-- Need SQL-first business dashboards
         |   +-- Non-technical users need self-serve?
         |   |   └── Metabase ✓
         |   +-- Enterprise scale, 100+ users?
         |   |   └── Apache Superset ✓ or Tableau ✓
         |   └── Small team, just need fast SQL → chart?
         |       └── Redash ✓
         |
         +-- Need enterprise BI with governance
         |   +-- Microsoft ecosystem (Azure, Teams, Excel)?
         |   |   └── Power BI ✓
         |   └── Need best-in-class visual analytics?
         |       └── Tableau ✓
         |
         +-- Need better log / APM visualization
         |   +-- Already on ELK stack?
         |   |   └── Kibana ✓
         |   └── Want SaaS monitoring + dashboards?
         |       └── Datadog ✓
         |
         └── Need cross-source queries + AI assistance
             └── Fastero ✓
1. Metabase — SQL-first, built for business users
Metabase is the tool I recommend most often to teams whose real problem is "non-technical people need dashboards from our Postgres database." It's open source, self-hostable, and the visual query builder is genuinely excellent — marketing managers can build funnel charts without writing a line of SQL, while analysts can drop into raw SQL mode when they need it.
When it beats Grafana: Business dashboards on relational databases. If your data lives in Postgres, MySQL, or BigQuery and your audience includes non-engineers, Metabase is the right call. The embedding story is also strong — you can embed individual charts or full dashboards into your own product.
When Grafana still wins: Real-time infrastructure monitoring, PromQL/LogQL queries, alerting on metrics thresholds, and any dashboard that needs to auto-refresh every 5 seconds. Metabase has no concept of a scrape interval.
Pricing: Self-hosted community edition is free (AGPL). Cloud starts at $85/user/month (Pro). Enterprise pricing on request.
For a deeper breakdown, see Grafana vs Metabase: Monitoring Tool or BI Tool? and Metabase vs Redash.
2. Apache Superset — open source with richer visualization
Superset is the open-source answer to "what if Metabase but bigger." It supports 40+ chart types (including deck.gl geospatial maps, treemaps, and sunburst charts), handles large datasets better through its SQL Lab query interface, and scales to hundreds of concurrent users. Airbnb built it, and it shows — it was designed for an org with thousands of data consumers.
When it beats Grafana: Enterprise-scale SQL analytics with rich visualization options. If you need geospatial charts, complex cross-tabs, or dashboards serving 500 users from a data warehouse, Superset handles it. The SQL Lab editor is a proper IDE-like experience — saved queries, query history, result preview, schema browser.
When Grafana still wins: Time-series monitoring and anything ops-related. Superset has no Prometheus integration, no alerting engine, and no real-time auto-refresh under 60 seconds. It's a reporting tool, not a monitoring tool.
Pricing: Apache 2.0 license, free to self-host. No official managed cloud (Preset was the managed option, but was acquired by Databricks). Self-hosting requires Redis, a metadata database, and a Celery worker — the operational overhead is real.
The Grafana vs Superset comparison covers the architecture differences in detail.
3. Power BI — enterprise BI for Microsoft shops
If your company runs on Azure, Teams, SharePoint, and Excel, Power BI is the path of least resistance. It integrates natively with the entire Microsoft ecosystem — pull data from Azure SQL, publish reports to Teams channels, embed dashboards in SharePoint, and let executives interact with reports in the Power BI mobile app. The DAX formula language is powerful once you learn it (and painful until you do).
When it beats Grafana: Business reporting in Microsoft-centric organizations. The combination of Power Query (ETL), DAX (calculations), and the drag-and-drop report builder covers 90% of enterprise BI needs. DirectQuery mode lets you query data warehouses without importing everything. The natural-language Q&A feature — ask "what were sales in Q2" and get a chart — works surprisingly well on well-modeled datasets.
When Grafana still wins: Anything Linux, anything open source, anything real-time. Power BI is Windows/cloud-only for authoring, refreshes data on a schedule (not live), and the licensing model gets expensive at scale. You also can't self-host it, which is a dealbreaker for some orgs.
Pricing: Power BI Pro at $10/user/month, Premium Per User at $20/user/month. Premium capacity pricing (dedicated infrastructure) starts around $5,000/month. Free Desktop version exists but only publishes to the Power BI service with a paid license.
4. Tableau — the enterprise drag-and-drop standard
Tableau has been the enterprise visualization gold standard for over a decade, and it earned that reputation. The drag-and-drop interface genuinely lets analysts build sophisticated visualizations faster than writing code. VizQL — the query language under the hood — is elegant. Tableau's handling of geographical data, level-of-detail calculations, and interactive filtering is still best-in-class.
When it beats Grafana: Complex visual analytics where the audience is analysts and executives, not engineers. If someone needs to drag Revenue to the Y-axis, Region to the X-axis, color by Product Line, and add a trend line — and do all of that in 30 seconds — Tableau is unmatched. Tableau Prep (the ETL companion) handles data cleaning and joining natively.
When Grafana still wins: Developer-friendly workflows, infrastructure monitoring, open-source deployments, and cost-sensitive teams. Tableau is expensive, requires a Salesforce-adjacent sales process, and doesn't speak PromQL. It's also not self-hostable unless you run Tableau Server on your own VMs, which is its own operational burden.
Pricing: Tableau Creator at $75/user/month, Explorer at $42/user/month, Viewer at $15/user/month. The tiered model means your bill scales with how many people touch the tool. For the full open-source-vs-enterprise tradeoff, see Grafana vs Tableau.
5. Redash — lightweight SQL dashboards
Redash is the minimalist option: write SQL, get a chart. No visual query builder, no drag-and-drop, no AI — just a clean SQL editor connected to your database with a simple visualization layer on top. It supports a wide range of databases (PostgreSQL, MySQL, BigQuery, Snowflake, Redshift, Presto, and more), and the query-to-dashboard workflow is fast.
When it beats Grafana: Quick SQL dashboards for technical teams that just want to write queries and share results. If your analysts already know SQL and don't need a visual query builder, Redash gets out of the way. Parameterized queries let you build simple interactive reports without much effort. The alert system — trigger a notification when a query result crosses a threshold — is basic but functional.
When Grafana still wins: Any monitoring or observability use case. Redash has no Prometheus support, no real-time refresh, and the visualization library is limited. The project's development pace has also slowed significantly since Databricks acquired the company — the community fork is active, but feature development is not what it was.
Pricing: Self-hosted is free (BSD license). There is no official managed cloud anymore. The community fork at github.com/getredash/redash is the canonical source.
For a SQL-tool comparison, see Metabase vs Redash.
6. Kibana — the ELK stack's native dashboard
Kibana is not a general-purpose dashboard tool. It's the visualization layer for Elasticsearch, and within that scope, it's excellent. Log exploration, full-text search across billions of documents, anomaly detection on log patterns, and security analytics (SIEM) — Kibana does all of this natively because it's built on top of the same index that stores your data.
When it beats Grafana: Log analytics and full-text search. If your primary question is "show me all error logs from service X in the last hour and let me drill into the stack traces," Kibana is purpose-built for that. The Discover view — real-time log tailing with filtering — is something Grafana's Loki integration approximates but doesn't fully match. Elastic's machine-learning anomaly detection also runs natively inside the stack.
When Grafana still wins: Mixed-source dashboards. Grafana can combine Prometheus metrics, Loki logs, and Postgres queries on one dashboard. Kibana only speaks Elasticsearch. If you need infrastructure metrics alongside logs, you'll need either Grafana or a second tool. Grafana's Loki + Prometheus combination is also operationally simpler than running the full ELK stack.
Pricing: The Basic tier is free (Elastic License, not OSS). Platinum and Enterprise tiers add ML, alerting, and security features. Elastic Cloud pricing starts around $95/month for a small deployment and scales with data volume. For a detailed comparison, see Grafana vs Kibana.
7. Datadog Dashboards — SaaS monitoring with everything included
Datadog is the "buy everything from one vendor" approach to observability. Infrastructure metrics, APM traces, logs, RUM, synthetics, security monitoring — and dashboards that visualize all of it in one place. The dashboard builder is polished, with drag-and-drop widgets, template variables, and notebook-style collaboration.
When it beats Grafana: Full-stack observability with zero self-hosting. If you want metrics, traces, logs, and dashboards without running Prometheus + Grafana + Loki + Tempo yourself, Datadog bundles it all. The correlation features — click a spike in a metric and jump to the related traces and logs — are genuinely useful for incident response. SLO tracking and error budgets are built in.
When Grafana still wins: Cost control and data ownership. Datadog's per-host pricing compounds fast — a 200-host fleet with APM, logs, and infrastructure monitoring can easily hit $50,000/month. Grafana + Prometheus + Loki, self-hosted, costs server time and your team's attention, but the software is free. For teams that want the open-source stack and don't mind the ops overhead, Grafana is the obvious choice.
Pricing: Infrastructure monitoring starts at $23/host/month. APM adds $40/host/month. Log Management starts at $0.10/GB ingested/day. Custom metrics at $0.05/metric/month. The bill gets complicated and can get large fast. No free tier for dashboards — the 14-day trial is the closest thing.
8. Fastero — AI-powered dashboards with cross-source SQL
Fastero is the alternative for teams that want database-driven business dashboards but don't want to wire up ETL pipelines or learn a new query language. Connect your databases, SaaS tools, or file uploads, and query them in SQL or plain English. The AI agent writes SQL for you, explains results, builds dashboards, and can monitor metrics on a schedule.
When it beats Grafana: Business KPI dashboards where data lives across multiple sources. Fastero runs cross-source queries natively — join your Postgres revenue data with Stripe payment data or combine HubSpot pipeline numbers with warehouse metrics in a single query. The NL-to-SQL interface means the marketing manager who can't write PromQL or SQL can still ask "what's our MRR by acquisition channel" and get an answer with the SQL visible underneath. Automated monitoring means the dashboard watches itself and alerts when metrics drift.
Pricing: Free tier available. Usage-based pricing beyond free limits. No per-seat fees — pricing scales with query volume, not headcount.
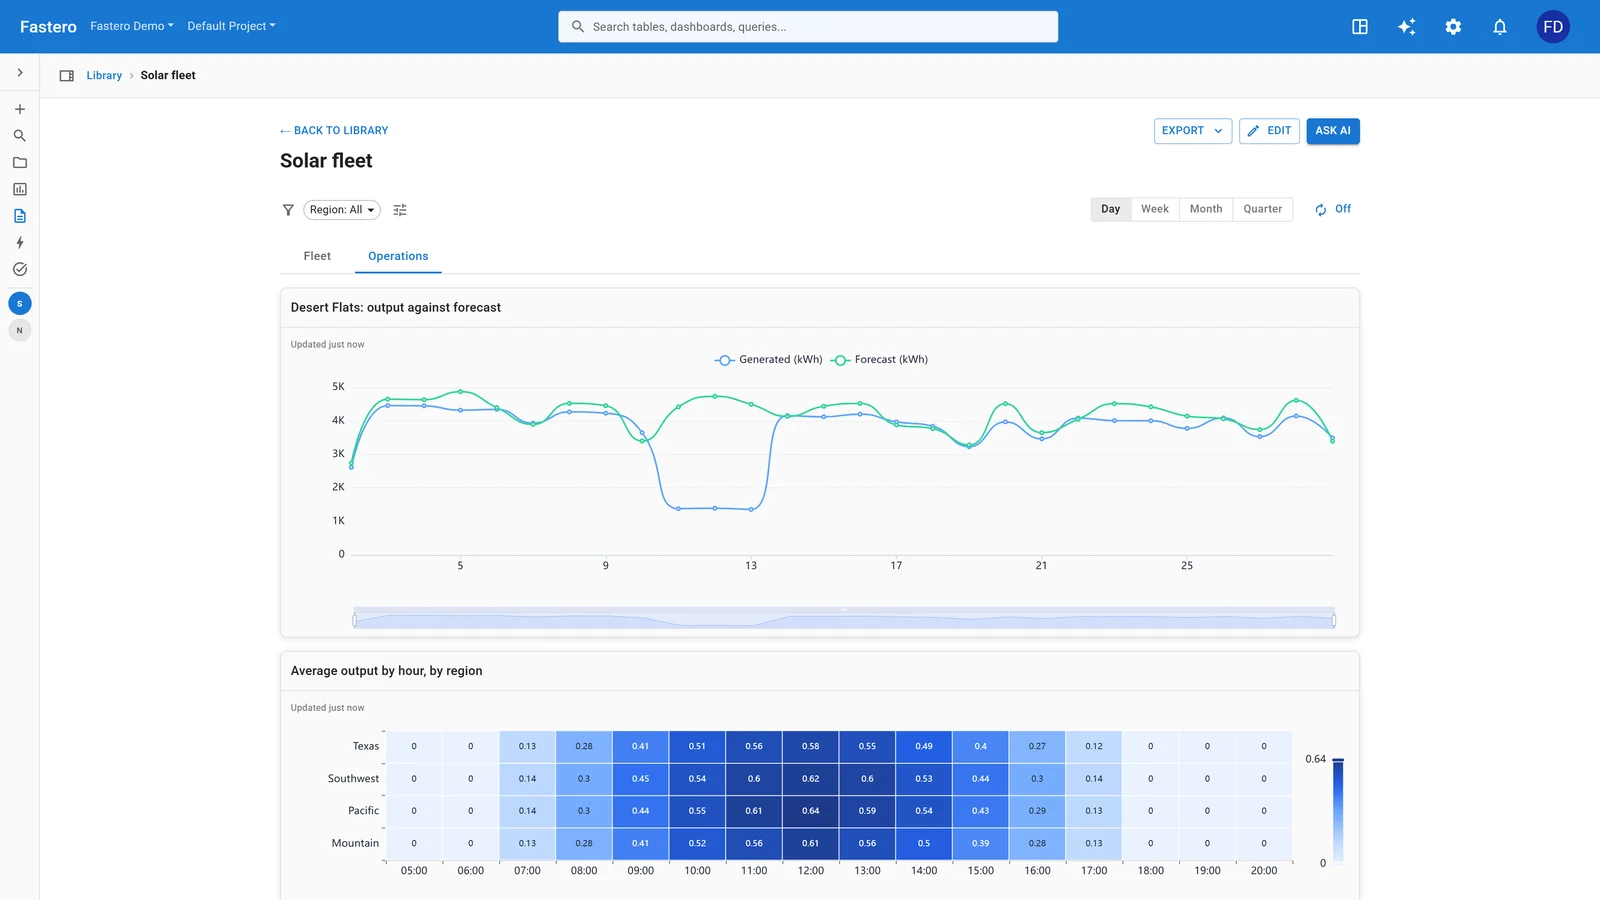
A dashboard in Fastero. Sample data.
For related comparisons, see Grafana vs Python for dashboards and Streamlit vs Grafana.
How to actually decide
The alternatives above split into three distinct categories, and the right pick depends on why you're leaving Grafana:
Staying in monitoring/observability? You're not really leaving Grafana — you're expanding it. Datadog replaces the whole self-hosted stack with SaaS. Kibana replaces it for log-heavy workloads on Elasticsearch.
Moving to business analytics? Metabase or Superset if you want open source. Power BI or Tableau if the org will pay for enterprise BI. Redash if your team writes SQL and just wants fast dashboards.
Need AI + cross-source queries? Fastero sits in a different spot — it's not a monitoring tool or a traditional BI platform. It's an AI analyst that queries across your sources and builds dashboards from the answers. The win is speed: instead of building an ETL pipeline, a data model, and a dashboard, you connect your sources and ask a question.
FAQ
Can Grafana do business dashboards at all?
Technically yes. Grafana can query SQL databases and render bar charts, tables, and stat panels. But the experience is built around time-series data — the default panel types, the time picker, the auto-refresh model all assume metrics, not business KPIs. You'll spend more time fighting Grafana's defaults than building the actual dashboard. For occasional SQL panels alongside your monitoring dashboards, it works fine. As your primary BI tool, it's the wrong fit.
Is Metabase or Superset better for replacing Grafana?
It depends on scale. Metabase is easier to deploy, easier for non-technical users, and handles most small-to-mid-size teams well. Superset handles larger datasets, has more chart types, and scales to hundreds of users — but it's harder to self-host and doesn't have a visual query builder as polished as Metabase's. If you're under 50 dashboard users, start with Metabase. If you're over 100, evaluate Superset.
What about Looker or Looker Studio?
Looker (now part of Google Cloud) is a strong enterprise BI tool, especially if your warehouse is BigQuery. I didn't include it because its LookML modeling layer puts it in a different category — it's a semantic layer platform, not a direct Grafana replacement. Looker Studio (the free, lightweight version) is worth looking at for quick Google Analytics and BigQuery dashboards, but it lacks the depth and self-hosting options of the tools on this list.
Can I use Grafana alongside a BI tool?
This is actually the most common setup I see. Keep Grafana for infrastructure monitoring (it's the best at what it does) and run Metabase, Superset, or Fastero for business dashboards. They serve different audiences — your SRE team lives in Grafana, your ops and business teams live in the BI tool. There's no reason to force one tool to do both jobs. The best open source dashboard tools comparison covers this dual-tool pattern in more detail.
Is Grafana Cloud a good alternative to self-hosted Grafana?
Grafana Cloud eliminates the operational overhead of running Prometheus, Loki, and Grafana yourself. The free tier is generous (10k metrics, 50GB logs). But it doesn't fix the fundamental issue — Grafana Cloud is still Grafana. If your problem is that Grafana doesn't handle business data well, Grafana Cloud won't solve it. If your problem is that self-hosting is painful, Grafana Cloud is the right answer.
Try Fastero free — connect your databases and SaaS tools, query them in SQL or plain English, and build business dashboards with AI assistance. No credit card required.