
Grafana is free, self-hostable, and built for real-time operational dashboards. Power BI costs $10/user/month, lives inside the Microsoft ecosystem, and is built for governed business analytics with DAX modeling. Pick Grafana when you need live monitoring, open-source control, or zero licensing cost. Pick Power BI when your org runs on Microsoft 365 and your users do not write queries.
Why do people compare Grafana and Power BI?
Five years ago this comparison would have been strange. Grafana was a Prometheus frontend. Power BI was an Excel upgrade. But Grafana has quietly expanded -- business data source plugins (PostgreSQL, MySQL, BigQuery, Snowflake), new panel types (bar charts, pie charts, stat panels), and a growing set of non-time-series use cases. Meanwhile Power BI added streaming datasets, real-time tiles, and Azure Monitor integrations that encroach on monitoring territory.
The overlap is real now. Both tools can query a PostgreSQL database. Both can show a bar chart of monthly revenue. Both can refresh automatically. The question is not can they do the same thing -- it is which one does it better for your team.
How do they handle data differently?
The architectural gap matters more than the feature list.
┌─────────────────────────────────────────────────┐
│                    GRAFANA                       │
│                                                  │
│  Dashboard ──query──► Data Source Plugin          │
│                       (Prometheus, PG, MySQL...) │
│                       ▼                          │
│                 Data source does                  │
│                 the computation                   │
│                                                  │
│  Result: lightweight server, fast refresh,       │
│  performance depends on your backend             │
└─────────────────────────────────────────────────┘

┌─────────────────────────────────────────────────┐
│                   POWER BI                       │
│                                                  │
│  Dashboard ──DAX──► VertiPaq Engine (in-memory)  │
│                     ▲                            │
│              Import / DirectQuery                │
│              from SQL, Excel, APIs               │
│                                                  │
│  Result: heavy server, interactive exploration,  │
│  performance depends on model size & capacity    │
└─────────────────────────────────────────────────┘
Grafana is a thin query layer -- it sends queries to your data source and renders the result. No analytical engine of its own. This keeps it lightweight but means your backend does the heavy lifting.
Power BI has VertiPaq, an in-memory columnar engine. When you import data, Power BI compresses it into VertiPaq and runs DAX queries against it locally. This is what gives Power BI its "drag a field, get instant aggregation" feel. The tradeoff: imported datasets consume memory, and large models need Premium capacity ($4,995/month) or Fabric.
Fastero
Connect your database. Ask questions. Get dashboards.
Postgres, BigQuery, Snowflake, and 10+ sources — live-connected, AI-powered, no dashboard builder learning curve.
Try free →What does the pricing actually look like?
This is where the conversation gets honest fast.
| Tier | Grafana | Power BI |
|---|---|---|
| Self-hosted, full features | Free (OSS) | Not available |
| Single user, basic | Free (Grafana Cloud) | $10/user/month (Pro) |
| Full creator, advanced features | $29/month (Grafana Cloud Pro) | $20/user/month (Premium Per User) |
| 50 dashboard consumers | $0 (self-hosted) | $0 if publisher has Pro; otherwise $10/user/month |
| 50 creators | $0 (self-hosted) | $6,000/year |
| Enterprise (self-hosted) | Free (OSS) or Grafana Enterprise (contact sales) | Power BI Report Server (included with Premium Per User) |
Grafana's cost advantage is structural. The open-source version has no per-seat licensing, no feature gates, and no usage limits you did not set yourself. You pay for infrastructure to run it -- a single VM handles hundreds of users. Power BI Pro at $10/user/month looks cheap until you multiply by 200 people across the org.
But -- and this matters -- if your company already pays for Microsoft 365 E5, Power BI Pro is included. Check your license agreement before assuming you will pay extra. That bundling is how Microsoft captured so much BI market share.
Which tool is better for real-time dashboards?
Grafana. This is not close.
Grafana was designed for "what is happening right now." Default auto-refresh is 5 seconds. Streaming data sources push updates via WebSockets. Alerting evaluates every 10 seconds (or faster). When your API latency spikes at 2am, Grafana shows it within seconds and fires an alert to PagerDuty.
Power BI has streaming datasets and real-time tiles, but they are bolted on, not native. Real-time tiles refresh every second in push mode, but the experience is limited -- no DAX, no interactivity, no filtering. Standard Power BI dashboards refresh on a schedule (minimum 15 minutes for Pro, 1 minute for Premium). For "show me yesterday's revenue," that is fine. For "show me the current error rate across 50 microservices," it is not.
Which tool is better for business users?
Power BI. Also not close.
Power BI Desktop's drag-and-drop report builder is designed for people who think in business terms, not queries. Drag "Product Category" to the axis, drag "Revenue" to values, get a chart. Add a slicer for date range. Publish to the Power BI Service. Share with your team via a Teams tab or SharePoint embed.
Grafana's panel editor has improved, but it still assumes you know how to write a query. PromQL, SQL, or whatever your data source speaks -- you are typing it. The variable system is powerful but not intuitive for non-technical users. I have watched business analysts try to build Grafana dashboards and give up within an hour.
The DAX/M power query stack in Power BI is a genuine differentiator. M handles data transformation (ETL inside Power BI Desktop). DAX handles business calculations -- year-over-year growth, rolling averages, customer cohort analysis. These are painful to replicate in Grafana, where your transformation options are limited to whatever your data source supports plus Grafana's transform tab.
How do they handle alerting?
Grafana's alerting is a first-class feature. You define alert rules against any data source, set evaluation intervals, group alerts by labels, and route them to Slack, PagerDuty, OpsGenie, email, webhooks, or Telegram. Silences, mute timings, and notification policies give you fine-grained control over alert fatigue. Grafana 11's ML-based anomaly detection learns normal patterns and flags deviations without manual threshold tuning.
Power BI's alerting is basic. You set a threshold on a dashboard tile -- "alert me when revenue drops below $50K" -- and get an email or notification in the Power BI mobile app. No label-based routing, no escalation policies, no integration with incident management tools. For operational alerting, Power BI is not a serious option.
What about ecosystem lock-in?
Grafana is open source (AGPL v3). Your dashboards are JSON files you can version-control in git. Your data source plugins are open-source or community-built. You can run Grafana on any Linux box, in Kubernetes, on AWS/Azure/GCP managed services, or on your laptop. If Grafana Labs disappeared tomorrow, the project would continue.
Power BI locks you into Microsoft. Your semantic models live in the Power BI Service. Your row-level security depends on Azure AD. Your scheduled refreshes use Power BI gateways. Your embedded reports need Azure capacity. Leaving Power BI means rebuilding everything from scratch -- there is no "export my data model to Tableau" button.
This is not inherently bad. If you are already a Microsoft shop, the lock-in is a feature -- single sign-on, Teams integration, SharePoint embedding, Excel's Analyze in Excel. But if you value portability, Grafana wins by default.
The comparison table
| Dimension | Grafana | Power BI |
|---|---|---|
| Pricing | OSS: free. Cloud: usage-based from free tier | Pro: $10/user/month. PPU: $20/user/month |
| Target user | Engineers, SRE, DevOps (expanding to analysts) | Business analysts, managers, executives |
| Data engine | None (queries data sources directly) | VertiPaq (in-memory columnar) |
| Calculation language | Depends on data source (SQL, PromQL, etc.) | DAX + M (Power Query) |
| Real-time refresh | Native, sub-second capable | Limited (streaming tiles or 1-min Premium refresh) |
| Drag-and-drop | No (query-based panel config) | Yes (core interaction model) |
| Alerting | Native, mature, multi-channel routing | Basic threshold alerts, email/mobile only |
| Self-hosting | Yes (free, full-featured) | Power BI Report Server (limited vs cloud) |
| Dashboard-as-code | JSON + Terraform provisioning | .pbix files (proprietary) |
| AI features | ML anomaly detection, adaptive alerting | Copilot (DAX generation, report creation) |
| Plugin ecosystem | 150+ data source plugins, open community | AppSource custom visuals, Microsoft connectors |
| Best ecosystem fit | Prometheus, Kubernetes, AWS, open-source stack | Microsoft 365, Azure, Dynamics, SharePoint |
| Mac support | Web-based (full parity) | Web only (Desktop is Windows-only) |
| Governance | Basic (folder permissions, RBAC in Enterprise) | Strong (endorsements, lineage, sensitivity labels) |
When does Grafana win?
You need real-time operational dashboards. API latency, error rates, queue depths, container health -- Grafana with Prometheus is the industry standard. Nothing in Power BI's feature set competes here.
Your budget is zero. Grafana OSS is free with no per-seat cost. For teams that need dashboards but cannot justify $10/user/month for hundreds of users, this matters.
You want infrastructure-as-code. Grafana dashboards are JSON. Provision them with Terraform. Store them in git. Review them in PRs. Power BI's .pbix files are binary blobs that do not play well with version control.
You are building on an open-source stack. If your infrastructure is Kubernetes + Prometheus + PostgreSQL, Grafana fits natively. Adding Power BI to this stack feels like bolting a Microsoft product onto a Linux ecosystem -- because that is exactly what it is.
When does Power BI win?
You are a Microsoft shop. Microsoft 365, Azure AD, Teams, SharePoint -- Power BI plugs into all of it. If your users already live in Teams, embedding a Power BI report in a channel tab takes two clicks.
Business users build their own reports. Power BI Desktop's drag-and-drop model means analysts can build dashboards without knowing SQL. Grafana requires query literacy.
Data governance is a priority. Power BI's semantic model pattern -- define metrics once, consume everywhere -- enforces consistency across the organization. Grafana does not have an equivalent governance layer.
You need DAX. Complex business calculations -- year-over-year comparisons, semi-additive measures, many-to-many relationships -- are DAX's strength. If your analytics involve these patterns, Power BI's calculation engine saves significant effort vs writing raw SQL.
What if neither tool fits?
Here is the scenario I keep running into: a team that needs operational data and business data on the same dashboard, wants non-technical users to interact with it, but does not want Microsoft lock-in or Power BI pricing at scale.
Grafana can show business data, but the experience is not built for business users. Power BI can show operational metrics, but real-time is an afterthought. Running both tools doubles your maintenance burden.
This is where Fastero fits. We connect directly to your databases -- PostgreSQL, MySQL, MongoDB, Snowflake, BigQuery -- and let you ask questions in plain English. The AI generates the query, runs it, and builds the visualization. No DAX to learn, no PromQL to write, no per-seat licensing. If you want the open-source flexibility of Grafana with the business-user friendliness of Power BI, that is the gap we built Fastero to fill.
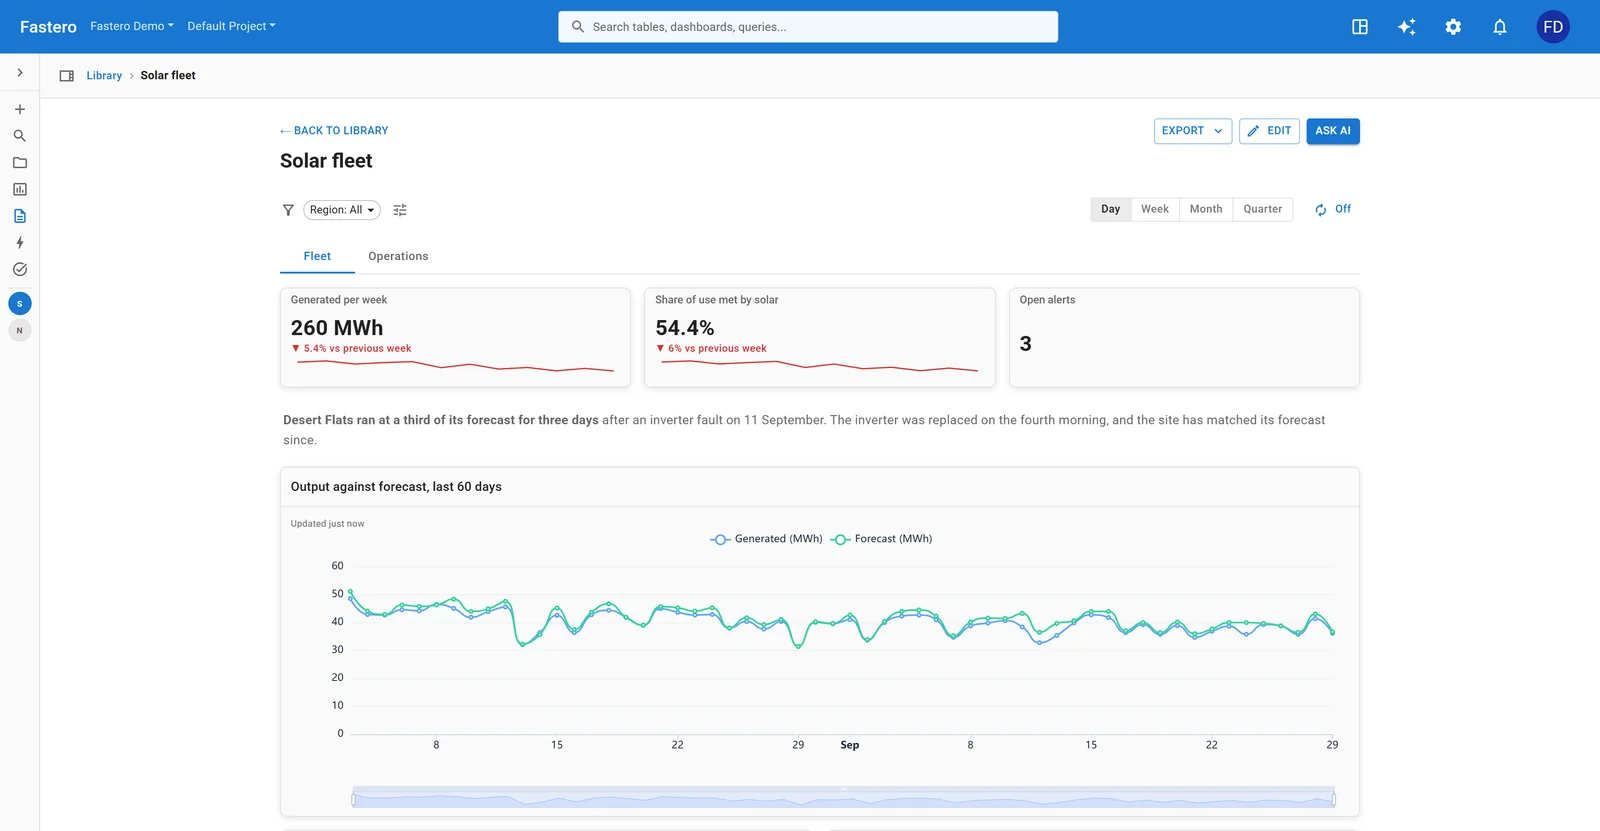
A dashboard in Fastero. Sample data.
For broader comparisons, see our best BI tools roundup and Grafana vs Tableau.
FAQ
Can Grafana replace Power BI for business analytics? Technically yes, but the experience is rough. Grafana can query SQL databases and render bar charts, but it lacks drag-and-drop, a semantic modeling layer, and business-user-friendly interactions. For a small technical team it works. For an org with non-technical stakeholders, you will spend more time building workarounds than you save on licensing.
Is Power BI really free with Microsoft 365 E5? Yes. Microsoft 365 E5 licenses include Power BI Pro at no additional cost. If your company already pays for E5, Power BI Pro is bundled. Check with your IT admin -- many organizations do not realize they already have it. Premium Per User ($20/user/month) and Fabric capacity are still extra.
Can I self-host Power BI? Power BI Report Server exists for on-premises deployment, but it is a subset of the cloud service. No AI features, no streaming datasets, no paginated reports through the service. Most of Power BI's value is in the cloud. Grafana's self-hosted version is feature-complete.
Is Grafana only for infrastructure monitoring? Not anymore. Grafana 11 supports business-oriented panels (bar charts, pie charts, stat panels, tables), has 150+ data source plugins including business databases, and can build dashboards that look nothing like a Prometheus metrics wall. But the query-first interaction model still assumes technical users.
Which tool has better AI features in 2026? Power BI Copilot (Azure OpenAI) generates DAX measures and report pages from natural language. Grafana's ML alerting detects anomalies without manual thresholds. They solve different problems -- Copilot helps you build reports, Grafana ML helps you detect incidents. Neither replaces the need for someone who understands the data.
Try Fastero free — connect your databases, ask questions in plain English, and get dashboards without DAX or PromQL. No credit card required.